
 ?Mathematical formulae have been encoded as MathML and are displayed in this HTML version using MathJax in order to improve their display. Uncheck the box to turn MathJax off. This feature requires Javascript. Click on a formula to zoom.
ABSTRACT
For people with disabilities or chronic diseases, an electrically supported tricycle (e-trike) could facilitate independence and participation in physical activity, and improve health conditions. This study investigates the exercise intensity and perceived exertion of e-trike cycling. Twenty healthy participants cycled on an e-trike with different speeds (12 and 18 km/h) and different levels of electric pedal support at an outdoor athletics track. Exercise intensity was measured with oxygen consumption () using a Cosmed K4B2 analysis unit, perceived exertion was measured with the Borg Rating of Perceived Exertion scale, pedaling power, and engine power were measured with a torque sensor. The effect of speed and support was analyzed with a Linear Mixed Effects model.
was 18.67 ± 3.13 ml/kg/min without support, with electric support the exercise intensity was significantly below moderate intensity (i.e. 10.5 ml/kg/min) at t = 11.37, p < .001, 95% CI: 1.90, 2.77. The Borg score without support was 9.79 ± 1.72 and all other conditions below this, which were significantly below moderate intensity (i.e. 11) at t = −3.07, p = .007, 95% CI: −2.04, −0.38. Speed and support significantly affected
(F = 185.49, p < .001). E-trike cycling is a low intensity activity, but intensity can be influenced by changing speed and support level.
Introduction
In the Netherlands, cycling is a very common activity and it proves to be suitable for achieving health benefits, as moderate to vigorous intensities can be achieved (Pucher & Dijkstra, Citation2003). These health benefits may include improved cardiovascular and muscular fitness, prevention of cognitive decline and falls, and a reduced risk of chronic diseases (Pucher & Dijkstra, Citation2003). In addition, the time spent cycling for Dutch adults is on average 74 minutes. The health benefits of cycling are related to the prevention of about 6500 deaths each year, and Dutch people who cycle have half-a-year longer life expectancy than those who do not (Fishman et al., Citation2015). Moreover, research has shown that bicycling not only has positive effects on individual health, but also on the environment and economy (Bopp et al., Citation2018).
The electrically assisted bicycle (e-bike) is becoming increasingly popular compared to a conventional bicycle, likely because e-bikes can increase travel range and speed, and reduce effort required by the cyclist (Langford et al., Citation2015; Plazier et al., Citation2018). Literature on e-bike cycling suggests that despite pedal support, the cyclist could still gain some health benefits (Johnson & Rose, Citation2013). For example, sub-maximal power output and maximum oxygen uptake increased after 6 and 4 weeks of commuter e-bike cycling, respectively, compared to commuting by car (De Geus et al., Citation2013; Peterman et al., Citation2016). This is supported by studies highlighting that e-bike cycling can result in moderate to vigorous exercise intensities, depending on support settings, speed, and slope (Gojanovic et al., Citation2011; Langford et al., Citation2017; Louis et al., Citation2012; Simons et al., Citation2009). On the other hand, riding an e-bike involves lower muscle activation, reduced cardiorespiratory and metabolic effort, and requires less effort from the cyclist (Gojanovic et al., Citation2011; Langford et al., Citation2017; Louis et al., Citation2012; Simons et al., Citation2009; Sperlich et al., Citation2012). Consequently, cycling becomes a more accessible physical activity also for those with lower endurance or muscle strength.
People with a disability or chronic disease might experience lower endurance, muscle strength, and functional status (Alahmari et al., Citation2016; Barnett et al., Citation2012; Saunders et al., Citation2016), which prevents them from cycling for a long time or at higher intensity. For example, stroke patients experience reduced maximum oxygen uptake () compared to age-matched healthy controls (Bachynski-Cole & Cumming, Citation1985; Smith et al., Citation2012). In rehabilitation, (passive) stationary cycling is used to enhance endurance, muscle strength, and functional status. For example, among children with cerebral palsy (CP) significant improvements in endurance, gross motor function, and strength could be observed in a treatment group that cycled as compared to a control group (Fowler et al., Citation2010).
People with a disability or chronic disease do not engage in activities during daily life as much as healthy people (Rimmer et al., Citation2004). A lack of adapted equipment is mentioned as one of the barriers to participate in leisure time physical activity or active transport (Jaarsma et al., Citation2014; Rimmer et al., Citation2004; Spivock et al., Citation2008). For example, conventional bicycles or e-bikes are not adapted for people with reduced balance. Tricycles can provide an opportunity to engage in physical activity for those unable to cycle on a conventional bicycle, but with the ability to pedal and steer (Hickman, Citation2016). Tricycles could also improve road safety, because cyclists do not need to worry about losing balance (Hagemeister et al., Citation2018). This could make tricycles a suitable option for people with disabilities or chronic diseases to engage in active transport or leisure time physical activity. However, another barrier to participate in physical activity is disability or reduced health (Jaarsma et al., Citation2014), which could hamper the ability to ride a tricycle. Electrically assisted tricycles (e-trikes) can be a suitable assistive technology for those with a disability or reduced health to participate in physical activity during daily life. They are similar to e-bikes and provide additional pedal support resulting in lower exercise intensity and effort, and higher speed.
Despite evidence on the intensity of e-bike cycling, it is unknown what the intensity of e-trike cycling is. In addition, the effect of cycling speed and amount of pedal support on cycling intensity is not known. Research must be performed to understand whether e-trike cycling provides an accessible opportunity to improve health through physical activity. Therefore, the goal of this pilot study is assessing the exercise intensity of e-trike cycling at different speeds (12 km/h and 18 km/h) and support levels (no, low, medium, and high support) in an outdoor controlled setting. Secondarily, we assess the influence of speed and support levels on exercise intensity and perceived exertion. The results of this study are a starting point for working toward optimizing e-trike cycling intensity to improve health through physical activity for people with a disability or chronic disease.
Materials & methods
Experimental protocol
To analyze the exercise intensity of e-trike cycling, participants did an exercise test on an e-trike (Easy Rider, Van Raam, Varsseveld, the Netherlands). They performed seven cycling conditions of 3 min at a standard outdoor running track (400 m) with a one minute break in between. Three minutes is long enough to reach a steady state of the fast component of oxygen kinetics (Xu & Rhodes, Citation1999), while the total time of the experiment is short enough to limit changes in the slow component of oxygen kinetics. We verified that participants returned to resting state during the 1 min break as oxygen consumption returned to a resting value. The order of cycling conditions was randomized.
The conditions included cycling without support at 12 km/h, and cycling with low, medium, and high support at 12 km/h and 18 km/h. We chose 12 km/h, because based on trial sessions, this speed is easily reached without large effort even without pedal support. A speed of 18 km/h was chosen because it is comparable to e-bike cycling speed in literature (for example (Langford et al., Citation2017)). The speeds are considered functional and easily achieved during daily commute or active transport.
Pedal support is provided through an electrical engine. The amount of support for each support level (low, medium, high) is based on an algorithm developed by the manufacturer (Van Raam). The following two parameters differ among support levels: maximum current (6A for low, 9A for medium, 18A for high), and a multiplication factor for pedal force (70 for low, 100 for medium, 200 for high). This means that for a certain pedal force, the engine provides two times more support with high, than with medium support. In addition, pedal support is also dependent on cadence.
Before the experiment, seat height was adjusted to the participant. The seat height was adjusted based on comfort and preference of the participant. Participants then practiced cycling on the e-trike. During cycling, participants viewed their real-time speed on a smartphone application mounted on the handlebars of the e-trike to keep speed as constant as possible. The e-trike was set to the fifth gear which did not change throughout the experiment. After each condition, participants took a one-minute break.
Participants
We recruited 20 healthy participants through snowball sampling, allowing included participants to suggest new participants. Sample size was chosen based on relevant literature (Louis et al., Citation2012). Inclusion criteria required participants to be experienced commuter or recreational cyclists. We only included experienced cyclists, such that results were not influenced by the skill level of the cyclist. For example, an inexperienced cyclist might consume relatively more oxygen than an experienced cyclist. Moreover, participation is safer for experienced cyclists. Participants were excluded if they had a condition preventing them from engaging in moderate intensity activity for 45 minutes. As this is a first pilot study, we included only healthy participants to provide initial insight in e-trike cycling intensity and to not place a burden on people with a disability or chronic disease. All procedures were completed in accordance with the ethical standards as described in the Declaration of Helsinki. The study was approved by the Health Research Ethics Board of Enschede, The Netherlands. Written informed consent was obtained from all participants.
Measurement equipment
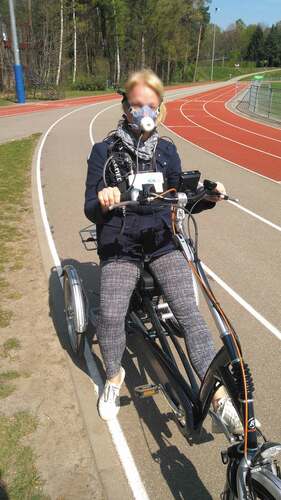
For the entire experiment, participants wore an ambulatory Cosmed K4B2 analysis unit (Cosmed, Rome, Italy) to monitor oxygen consumption (), sampled breath-by-breath in ml/kg/min (). A Thun X-CELL RT digital crank sensor installed on the e-trike collected pedal force (in N) and cadence (in rpm). This data was stored at 0.2 Hz. The engine controller collected current (in A) and voltage (in V) of the engine, settings of the support level, and remaining battery capacity. An additional module contained a global position system and an inertial measurement unit. Between cycling conditions, participants rated their perceived exertion on a 6–20 Borg Rating of Perceived Exertion (RPE) scale (Borg & Linderholm, Citation1967).
Figure 1. Measurement set-up.
Data analysis
We quantified the intensity of e-trike cycling for each condition with (ml/kg/min).
was first filtered using a low-pass digital filter at 0.04 Hz (Robergs et al., Citation2010) and then averaged over the last minute per condition. The last minute of a three-minute condition was used, because steady state is reached after approximately 3 min with (below) moderate exercise intensity (Xu & Rhodes, Citation1999). We computed average pedal force, cadence, and engine power output by using a low-pass filter at 0.025 Hz and averaging over the last minute of each condition. Cyclist power output was computed by multiplying pedal force with cadence. All data were processed using Matlab R2019a (The MathWorks, Inc., Natick, Massachusetts, United States) and presented as mean ± standard deviation.
Statistical analysis
The average for each condition was analyzed using a one-tailed one-sample t-test to check whether
is above 10.5 ml/kg/min (considered as the lower boundary of moderate exercise intensity (Ainsworth et al., Citation2011; Jetté et al., Citation1990)). The average perceived exertion was compared to a Borg RPE score of 11 (equal to “fairly light” on the Borg RPE scale (Borg & Linderholm, Citation1967)), considered as lowest threshold for moderate intensity activities. A Linear Mixed Effects model was used to compare the effect of support level and speed
, Borg RPE, pedaling power, and engine power across different conditions. We considered these conditions as the repeated measures. The correlated structure was dealt with using an unstructured covariance matrix. For pairwise comparison, Sidak correction was applied. We compared the model parameters of the mixed-effect model with estimates for missing data to the parameters of a model when participants with missing data were removed. For all statistical analyses, a value of p < .05 was set as the level of significance. The statistical analysis was performed using IBM SPSS Statistics for Windows, Version 19.0 (Armonk, NY: IBM Corp.).
Results
Descriptive statistics
Twenty participants were included (mean age 32 ± 12 years, mean height 1.75 ± 0.10 m, mean weight 70 ± 13 kg) of which seven were male. All participants were experienced commuter or recreational cyclists, although none had experience with cycling on a tricycle. All participants completed all seven cycling conditions. For three participants, the Cosmed K4B2 did not record the first condition, so no data was available. For three participants, the e-trike lost connection and did not record engine and pedal power during one condition. In total, 137 average
values were computed, 140 Borg RPE scores, and 137 average engine, and pedal power values.
Oxygen consumption and perceived exertion
Without support at 12 km/h, the average was 18.67 ± 3.13 ml/kg/min and thus at least moderate intensity (t = 11.37, p < .001, 95% CI: 1.90, 2.77). The average perceived exertion without support at 12 km/h was a Borg RPE score of 9.78, which was significantly below moderate intensity (t = −3.07, p = .007, 95% CI: −2.04, −0.38). In all other conditions,
did not significantly rise above 10.5 ml/kg/min and the Borg RPE score did not significantly rise above 11. The lowest exercise intensity (5.81 ± 0.87 ml/kg/min) and the lowest Borg RPE score (6.3 ± 0.8) were observed with high support at 12 km/h ().
Figure 2. Average exercise intensity and perceived exertion per condition.
Influence of speed and support settings
Oxygen consumption was significantly affected by speed and support level (F = 185.49, p < .001). However, between the following conditions no significant differences were found: low support at 12 km/h and 18 km/h (p = .992, 95% CI: −1.935, 0.879), medium support at 12 and 18 km/h (p = .212, 95% CI: −1.235, 0.134), medium support at 12 km/h and high support 18 km/h (p = .355, 95% CI: −0.224, 1.395), and high support at 12 and 18 km/h (p = .087, 95% CI: −1.395, 0.052). A decrease in was observed as support level increased ().
The perceived exertion as measured with the Borg RPE was also significantly influenced by speed and support level (F = 15.95, p < .001). However, only without support at 12 km/h, the Borg RPE score differed significantly from all other conditions, while with support, not all differences were significant. We observed lower Borg RPE scores for lower speed and higher support ().
Pedaling power was also significantly affected by speed and support level (F = 958.92, p < .001). All conditions significantly differed from each other, except medium support at 12 km/h and high support at 18 km/h (p = .810, 95% CI: −0.668, 2.221). A decrease in pedaling power was observed with increasing support level, as well as an increase in pedaling power with increasing speed ().
Table 1. Mean ± standard deviation of oxygen consumption, perceived exertion, pedaling power, and engine power per condition.
Engine power output also showed significant differences between different conditions (F = 476.21, p < .001), except for the following: medium and high support 12 km/h (p = 1.00, 95% CI: −14.04, 7.86), and medium and high support 18 km/h (p = 1.00, 95% CI: −24.71, 16.77). Engine power increases with higher speed ().
Discussion
Our study showed that cycling on an e-trike with any level of support corresponds to a low exercise intensity for healthy adults. Only without support, participants achieved a moderate exercise intensity. This means that e-trike cycling seems to be insufficient to establish moderate intensity physical activity in healthy adults (Samuelson, Citation2004).
The finding that e-trike cycling resulted in low intensity with low, medium, or high support level and speed of 12 or 18 km/h, contrasts with literature about e-bike cycling. Louis et al. (Citation2012) concluded that cycling on an e-bike at 16 km/h with high support could already result in a moderate exercise intensity ( of 13.7 ± 1.7 ml/kg/min). Cycling with low support and high speed even resulted in vigorous exercise intensities (Louis et al., Citation2012). Bourne et al. (Citation2018) also suggest in their review that e-bike cycling at a self-chosen speed and with varying inclinations always results in at least moderate intensity. The reported intensities range from a
of approximately 15.8 ml/kg/min (Langford et al., Citation2017) to 29.4 ml/kg/min (Berntsen et al., Citation2017). These findings suggest that e-bike cycling induces higher intensities and is thus expected to be more intensive than e-trike cycling.
The lower during e-trike cycling in this experiment, compared to e-bike cycling in literature could be caused by several factors. Firstly, the engine power output for each support level (low, medium, high) is expected to play the biggest role, but engine power is not reported in literature (Gojanovic et al., Citation2011; Langford et al., Citation2017; Louis et al., Citation2012; Simons et al., Citation2009; Sperlich et al., Citation2012). Based on our results, we expect that the e-trike in this study provided more support than the e-bikes described in literature, causing a lower oxygen consumption. Another factor that could reduce
is removing the balancing component of bicycling. It is also possible that a different body posture on the e-trike or different biomechanics of e-trikes compared to e-bikes causes lower demand. It is recommended that future studies on e-bike or e-trike cycling also report engine power output to make comparison possible.
Another interesting finding is that it appears that there is no difference in motor output between medium and high support level (). This might be caused by the engine providing too much support for the desired speeds (12 km/h and 18 km/h), resulting in a higher variance in cadence (due to stopping with pedaling when speed exceeds the desired speeds) and higher variance in pedal force in order to cycle with constant speed. This might have resulted in a lower average engine output and larger standard deviation with high support settings.
Our study showed that a cyclist could use speed and support level to control exercise intensity (). We also observed a similar influence of speed and support level on pedaling power output (). This suggests that pedaling power is a possible measure of the influence of speed and support levels on oxygen consumption. In addition, literature states that peak pedaling power output is a strong predictor of maximum oxygen consumption (Hawley & Noakes, Citation1992). The e-trike used in this study is capable of continuously measuring pedaling power, thus providing the opportunity for (real-time) feedback about exercise intensity during e-trike cycling in daily life.
Exercising at the right intensity can improve health, but should be tailored to the specific capabilities of the individual. For example, chronic obstructive pulmonary disease (COPD) patients have trouble regulating their activity intensity in the morning. As a result, they show an activity dip in the afternoon (Tabak et al., Citation2012). They might benefit from feedback on exercise intensity to distribute their activity more evenly. In this way, the e-trike is an assistive technology that provides the opportunity to engage in physical activity during daily life and to gain health benefits for people with a disability or chronic disease.
The physical response to e-bike and e-trike cycling intensities (and physical activity in general) depends on training status (Louis et al., Citation2012). For example, children with CP have a lower cycling efficiency than healthy children, possibly due to reduced muscle strength, muscle spasticity, and altered motor and posture control. This can lead to earlier fatigue and larger dissatisfaction with cycling (Johnston et al., Citation2007). In addition, exercise tolerance is lower in patients with COPD (Pepin et al., Citation2007), suggesting that they may not be able to cycle at a higher intensity. In this study, we show that outdoor e-trike cycling is a low intensity activity for health adults (). Combined with the benefits of improved road safety using a tricycle (Hagemeister et al., Citation2018), outdoor e-trike cycling facilitates people with a disability or chronic disease to enjoy the benefits of cycling in general. These benefits include among others reduced joint stress compared to walking or running (Gregor et al., Citation1991) and improved muscle strength and cardiovascular fitness (Johnston et al., Citation2007). We expect that outdoor e-trike cycling also provides mental benefits such as an increased sense of independence. To understand these benefits as well, we recommend issuing a questionnaire on mental health and enjoyment related to e-trike cycling among people with a disability or chronic disease.
Currently, e-trikes are not yet widely accepted as assistive devices for active transport or leisure physical activity. For people with a chronic disease or disability, the mobility scooter is a popular means of transport, and subsidies for such motorized vehicles are increasingly available (Auger et al., Citation2008). Whilst mobility scooters may help to improve quality of life by providing an opportunity to get around, they might also contribute to adverse effects of a sedentary lifestyle (Sullivan et al., Citation2019; Thoreau, Citation2015). We could potentially achieve great health benefits if these current mobility scooter users would transfer to an e-trike as their means of transport, because riding an e-trike requires more physical activity than riding a mobility scooter. In addition, especially among elderly, the step toward obtaining a mobility scooter is a difficult transition. In semi-structured interviews, older non-users of mobility scooters express that scooter uptake suggests physical decline and aging, and they are reluctant toward using mobility scooters (Thoreau, Citation2015). For these people, an e-trike might be a good compromise, as they can still be active, while receiving the benefits of pedal support and more stability.
Strengths and limitations
One of the strengths of this study is the large number of participants. In e-bike literature where similar experiments were conducted, only one other study included as many participants (Louis et al., Citation2012). Another strength is using oxygen consumption as a measure of exercise intensity, because it is a golden standard (Sperlich et al., Citation2012). In addition, we conducted this experiment outdoors, to simulate realistic e-trike cycling. We expect that for this reason, our results are similar to those achieved during regular outdoor e-trike cycling with constant speed and support. This increases the relevance of the results and allows translating to real life. It must be noted however, that in real life cycling will most likely not be at constant speed continuously due to obstacles such as other road users, crossings, and traffic lights.
Outdoor measurements might also introduce a limitation as results could be biased between measurement days due to changing weather conditions. In addition, giving participants control over speed could bias results among participants. However, the weather conditions were fairly similar between measurement days, and averaging each parameter per condition limits bias between participants as well. Another limitation was introduced by missing data of three participants. However, we compared model parameters before and after removing the participants with missing data and found only negligible differences. This suggests that missing data has a negligible effect on model parameters.
In this study, e-trike cycling is perceived as a low intensity physical activity and speed and support level had little influence on Borg RPE scores. However, it can be difficult to perceive differences in effort when the effort is low, therefore Borg RPE scores might not be a good indicator of effort during e-trike cycling at low intensities for healthy adults. The participants in this experiment were healthy adults and therefore not target e-trike users whom generally have a disability or chronic disease or lower fitness. We expect that target e-trike users cycle at a higher exercise intensity and with higher Borg scores during similar conditions. This limits the generalizability of the results and follow-up studies would be needed to analyze intensity among target e-trike users.
Conclusion
The exercise intensity of e-trike cycling is moderate without support and low with low, medium, or high support level, at 12 or 18 km/h for healthy adults. Our findings suggest that e-trike cycling can facilitate people with a disability or chronic disease to enjoy the benefits of cycling in general, as pedal support during e-trike cycling may delay or prevent the onset of fatigue. With speed and support level, exercise intensity can be further controlled. This allows for tailoring e-trike cycling intensity to each user to help them distribute their physical activities better. This study is the first step toward tailoring e-trike cycling for people with a disability or chronic disease and it is recommended to perform another study with target e-trike users.
Acknowledgments
The authors would like to thank all participants in the experiment, and Ing. Ronnie Kroekenstoel for his assistance in retrieving the data collected by the e-trike. This research was funded by the European Union and the European Fund for Regional Development (EFRO, project Embipro). The e-trike used in this research was provided by Van Raam, Varsseveld, the Netherlands. The funding sources had no influence in study design; in the collection, analysis, and interpretation of data; in the writing of the report; nor in the decision to submit the article for publication.
Disclosure statement
The funding sources had no influence in study design; in the collection, analysis and interpretation of data; in the writing of the report; nor in the decision to submit the article for publication.
Additional information
Funding
References
- Ainsworth, B. E., Haskell, W. L., Herrmann, S. D., Meckes, N., Bassett, D. R., Tudor-Locke, C., Greer, J. L., Vezina, J., Whitt-Glover, M. C., & Leon, A. S. (2011). 2011 compendium of physical activities: A second update of codes and MET values. Medicine and Science in Sports and Exercise, 43(8), 1575–1581. https://doi.org/https://doi.org/10.1249/MSS.0b013e31821ece12
- Alahmari, A. D., Kowlessar, B. S., Patel, A. R. C., Mackay, A. J., Allinson, J. P., Wedzicha, J. A., & Donaldson, G. C. (2016). Physical activity and exercise capacity in patients with moderate COPD exacerbations. European Respiratory Journal, 48(2), 340–349. https://doi.org/https://doi.org/10.1183/13993003.01105-2015
- Auger, C., Demers, L., Gélinas, I., Jutai, J., Fuhrer, M. J., & DeRuyter, F. (2008). Powered mobility for middle-aged and older adults. American Journal of Physical Medicine & Rehabilitation, 87(8), 666–680. https://doi.org/https://doi.org/10.1097/PHM.0b013e31816de163
- Bachynski-Cole, M., & Cumming, G. R. (1985). The cardiovascular fitness of disabled patients attending occupational therapy. Occupational Therapy Journal of Research, 5(4), 233–242. https://doi.org/https://doi.org/10.1177/153944928500500404
- Barnett, K., Mercer, S. W., Norbury, M., Watt, G., Wyke, S., & Guthrie, B. (2012). Epidemiology of multimorbidity and implications for health care, research, and medical education: A cross-sectional study. The Lancet, 380(9836), 37–43. https://doi.org/https://doi.org/10.1016/S0140-6736(12)60240-2
- Berntsen, S., Malnes, L., Langåker, A., & Bere, E. (2017). Physical activity when riding an electric assisted bicycle. International Journal of Behavioral Nutrition and Physical Activity, 14(1), 55. https://doi.org/https://doi.org/10.1186/s12966-017-0513-z
- Bopp, M., Sims, D., & Piatkowski, D. (2018). Benefits and risks of bicycling. In M. Bopp, D. Sims, & D. Piatkowski (Eds.), Bicycling for transportation (pp. 21–44). Elsevier. https://doi.org/https://doi.org/10.1016/b978-0-12-812642-4.00002-7
- Borg, G., & Linderholm, H. (1967). Perceived exertion and pulse rate during graded exercise in various age groups. Acta medica Scandinavica, 181(472S), 194–206. https://doi.org/https://doi.org/10.1111/j.0954-6820.1967.tb12626.x
- Bourne, J. E., Sauchelli, S., Perry, R., Page, A., Leary, S., England, C., & Cooper, A. R. (2018). Health benefits of electrically-assisted cycling: A systematic review 11 Medical and Health Sciences 1117 Public Health and Health Services. In H. van der Ploeg (Ed.), International journal of behavioral nutrition and physical activity (Vols. 15, Issue 1, pp. 116). BioMed Central. https://ijbnpa.biomedcentral.com/about/editorial-board
- De Geus, B., Kempenaers, F., Lataire, P., & Meeusen, R. (2013). Influence of electrically assisted cycling on physiological parameters in untrained subjects. European Journal of Sport Science, 13(3), 290–294. https://doi.org/https://doi.org/10.1080/17461391.2011.606845
- Fishman, E., Schepers, P., & Kamphuis, C. B. M. (2015). Dutch cycling: Quantifying the health and related economic benefits. American Journal of Public Health, 105(8), e13–e15. https://doi.org/https://doi.org/10.2105/AJPH.2015.302724
- Fowler, E. G., Knutson, L. M., DeMuth, S. K., Siebert, K. L., Simms, V. D., Sugi, M. H., Souza, R. B., Karim, R., & Azen, S. P. (2010). Pediatric Endurance and Limb Strengthening (PEDALS) for children with cerebral palsy using stationary cycling: A randomized controlled trial. Physical Therapy, 90(3), 367–381. https://doi.org/https://doi.org/10.2522/ptj.20080364
- Gojanovic, B., Welker, J., Iglesias, K., Daucourt, C., & Gremion, G. (2011). Electric bicycles as a new active transportation modality to promote health. Medicine and Science in Sports and Exercise, 43(11), 2204–2210. https://doi.org/https://doi.org/10.1249/MSS.0b013e31821cbdc8
- Gregor, R. J., Broker, J. P., & Ryan, M. M. (1991). The biomechanics of cycling. Exercise and Sport Sciences Reviews, 19(1), 127–169. https://doi.org/https://doi.org/10.1249/00003677-199101000-00004
- Hagemeister, C., Krause, J., & Bunte, H. (2018, May). “I wouldn’t even sit on one.” Relevant attitudes towards tricycles for adults. Transportation Research. Part F, Traffic Psychology and Behaviour, 55, 483–491. https://doi.org/https://doi.org/10.1016/j.trf.2018.02.011
- Hawley, J. A., & Noakes, T. D. (1992). Peak power output predicts maximal oxygen uptake and performance time in trained cyclists. European Journal of Applied Physiology and Occupational Physiology, 65(1), 79–83. https://doi.org/https://doi.org/10.1007/BF01466278
- Hickman, K. (2016). Disabled cyclists in England: Imagery in policy and design. Proceedings of the Institution of Civil Engineers: Urban Design and Planning, 169(3), 129–137. https://doi.org/https://doi.org/10.1680/udap.14.00048
- Jaarsma, E. A., Dijkstra, P. U., Geertzen, J. H. B., & Dekker, R. (2014). Barriers to and facilitators of sports participation for people with physical disabilities: A systematic review. In S. Harridge (Ed.), Scandinavian Journal of Medicine and Science in Sports (Vols. 24, Issue 6, pp. 871–881). London, UK: Blackwell Munksgaard. https://onlinelibrary.wiley.com/page/journal/16000838/homepage/editorialboard.html
- Jetté, M., Sidney, K., & Blümchen, G. (1990). Metabolic equivalents (METS) in exercise testing, exercise prescription, and evaluation of functional capacity. Clinical Cardiology, 13(8), 555–565. https://doi.org/https://doi.org/10.1002/clc.4960130809
- Johnson, M., & Rose, G. (2013). Electric bikes - cycling in the New World City: An investigation of Australian electric bicycle owners and the decision making process for purchase. In Australasian Transport Research Forum, ATRF 2013 - Proceedings. Australasian Transport Research Forum.
- Johnston, T. E., Barr, A. E., & Lee, S. C. (2007). Biomechanics of submaximal recumbent cycling in adolescents with and without Cerebral Palsy. Physical Therapy, 87(5), 572–585. https://doi.org/https://doi.org/10.2522/ptj.20060261
- Langford, B. C., Chen, J., & Cherry, C. R. (2015, September). Risky riding: Naturalistic methods comparing safety behavior from conventional bicycle riders and electric bike riders. Accident Analysis and Prevention, 82, 220–226. https://doi.org/https://doi.org/10.1016/j.aap.2015.05.016
- Langford, B. C., Cherry, C. R., Bassett, D. R., Jr., Fitzhugh, E. C., & Dhakal, N. (2017, September). Comparing physical activity of pedal-assist electric bikes with walking and conventional bicycles. Journal of Transport & Health, 6, 463–473. https://doi.org/https://doi.org/10.1016/j.jth.2017.06.002
- Louis, J., Brisswalter, J., Morio, C., Barla, C., & Temprado, J. J. (2012). The electrically assisted bicycle an alternative way to promote physical activity. American Journal of Physical Medicine & Rehabilitation, 91(11), 931–940. https://doi.org/https://doi.org/10.1097/PHM.0b013e318269d9bb
- Pepin, V., Saey, D., Laviolette, L., & Maltais, F. (2007). Exercise capacity in chronic obstructive pulmonary disease: Mechanisms of limitation. COPD: Journal of Chronic Obstructive Pulmonary Disease, 4(3), 195–204. https://doi.org/https://doi.org/10.1080/15412550701480489
- Peterman, J. E., Morris, K. L., Kram, R., & Byrnes, W. C. (2016). Pedelecs as a physically active transportation mode. European Journal of Applied Physiology, 116(8), 1565–1573. https://doi.org/https://doi.org/10.1007/s00421-016-3408-9
- Plazier, P. A., Weitkamp, G., & Den Berg, A. E. V. (2018). Exploring the adoption of e-bikes by different user groups. Frontiers in Built Environment, 4, 47. https://doi.org/https://doi.org/10.3389/fbuil.2018.00047
- Pucher, J., & Dijkstra, L. (2003). Promoting safe walking and cycling to improve public health: Lessons from The Netherlands and Germany. American Journal of Public Health, 93(9), 1509–1516. https://doi.org/https://doi.org/10.2105/AJPH.93.9.1509
- Rimmer, J. H., Riley, B., Wang, E., Rauworth, A., & Jurkowski, J. (2004). Physical activity participation among persons with disabilities: Barriers and facilitators. American Journal of Preventive Medicine, 26(5), 419–425. https://doi.org/https://doi.org/10.1016/j.amepre.2004.02.002
- Robergs, R. A., Dwyer, D., & Astorino, T. (2010). Recommendations for improved data processing from expired gas analysis indirect calorimetry. Sports Medicine, 40(2), 95–111. https://doi.org/https://doi.org/10.2165/11319670-000000000-00000
- Samuelson, G. (2004). Global strategy on diet, physical activity and health. Scandinavian Journal of Nutrition/Naringsforskning, 48(2), 57. https://doi.org/https://doi.org/10.1080/11026480410034349
- Saunders, D. H., Sanderson, M., Hayes, S., Kilrane, M., Greig, C. A., Brazzelli, M., & Mead, G. E. (2016). Physical fitness training for stroke patients. In Cochrane database of systematic reviews (Vols. 2016, Issue 3). John Wiley & Sons, Ltd. https://doi.org/https://doi.org/10.1002/14651858.CD003316.pub6
- Simons, M., Van Es, E., & Hendriksen, I. (2009). Electrically assisted cycling: A new mode for meeting physical activity guidelines? Medicine and Science in Sports and Exercise, 41(11), 2097–2102. https://doi.org/https://doi.org/10.1249/MSS.0b013e3181a6aaa4
- Smith, A. C., Saunders, D. H., & Mead, G. (2012). Cardiorespiratory fitness after stroke: A systematic review. International Journal of Stroke, 7(6), 499–510. https://doi.org/https://doi.org/10.1111/j.1747-4949.2012.00791.x
- Sperlich, B., Zinner, C., Hebert-Losier, K., Born, D. P., & Holmberg, H. C. (2012). Biomechanical, cardiorespiratory, metabolic and perceived responses to electrically assisted cycling. European Journal of Applied Physiology, 112(12), 4015–4025. https://doi.org/https://doi.org/10.1007/s00421-012-2382-0
- Spivock, M., Gauvin, L., Riva, M., & Brodeur, J. M. (2008). Promoting active living among people with physical disabilities. Evidence for neighborhood-level buoys. American Journal of Preventive Medicine, 34(4), 291–298. https://doi.org/https://doi.org/10.1016/j.amepre.2008.01.012
- Sullivan, S. J., Handcock, P., & Jackson, D. S. (2019). Does the purchase of a mobility scooter alter physical activity levels in older adults? Disability and Rehabilitation. Assistive Technology, 15(8), 856–861. https://doi.org/https://doi.org/10.1080/17483107.2019.1620352
- Tabak, M., Vollenbroek-Hutten, M. M. R., Van Der Valk, P. D. L. P. M., Van Der Palen, J., Tönis, T. M., & Hermens, H. J. (2012). Telemonitoring of daily activity and symptom behavior in patients with COPD. International Journal of Telemedicine and Applications, 2012, Article ID 438736, 8. https://doi.org/https://doi.org/10.1155/2012/438736
- Thoreau, R. (2015). The impact of mobility scooters on their users. Does their usage help or hinder?: A state of the art review. Journal of Transport and Health, 2(2), 269–275. https://doi.org/https://doi.org/10.1016/j.jth.2015.03.005
- Xu, F., & Rhodes, E. C. (1999). Oxygen uptake kinetics during exercise. In S. McMillan & R. Olney (Eds.), Sports medicine (Vols. 27, Issue 5, pp. 313–327). Springer. https://www.springer.com/journal/40279/editors