
ABSTRACT
Pressure injuries for individuals with spinal cord injuries (SCI) are correlated with mortality and are a leading cause for rehospitalizations. The Assisted Weight Shift (AW-Shift©) is a mobile pressure mapping application designed to provide users with a live map view and reminders to perform weight shifts. Novel visualization techniques were used to understand daily distributions of user interaction wit h AW-Shift©. The date and time of system interactions were recorded for six participants with SCI over 7 days (five males/one female, five manual users/one power user, 55.3 ± 17.3 years old, 10.6 ± 6.5 years since injury). Circular frequency plots were created to visualize the time and frequency participants brought the app to the foreground of their phone and received alerts and reminders to complete weight shifts. While some participants used the system regularly throughout the day, others primarily used it before 8am; highlighting the system’s importance for regular spot checks and morning wheelchair setup. Participant adherence to weight shift reminders was low suggesting the live pressure map may be more useful. Circular frequency plots can be used by clinicians to more easily review large amounts of patient data. Future work will investigate raw pressure mat data and create a closed-loop weight shift detection algorithm.
Introduction
Pressure injuries are one of the most challenging secondary health conditions for people with a spinal cord injury (SCI) with incidence across a lifespan as high as 30% (National Spinal Cord Injury Statistical Center, Citation2018). Due to lack of sensory and motor function below the level of injury, people with SCI spend prolonged periods of sitting with unmitigated pressure to their seated area (Consortium for Spinal Cord Medicine Clinical Practice Guidelines, Citation2014; S.E. Sonenblum et al., Citation2016). Pressure injuries are the second-leading cause for rehospitalization and for morbidity in the SCI population (National Spinal Cord Injury Statistical Center, Citation2018). Additionally, pressure injuries are the only secondary condition consistently correlated with mortality risk for this population (Krause et al., Citation2016). Further, a person’s quality of life, social participation, and the ability to engage in daily activities decline significantly following a pressure injury (Adriaansen et al., Citation2016; Piatt et al., Citation2016).
While pressure injury development is complex, there is consensus that a primary risk factor is the duration and magnitude of pressure applied to the skin in relation to the individual’s physiological tolerance to that pressure (DeJong et al., Citation2014). Educating patients with SCI about pressure injury risks and how to manage those risks is a primary clinical task during inpatient (Guihan et al., Citation2009) and outpatient rehabilitation. Occupational and physical therapists teach patients how to manage pressure distribution through equipment selection, positioning strategies, and the use of weight shift maneuvers (leaning forward, to the side, or tilting/reclining in a wheelchair). Typical recommendations may include shifting weight by leaning forward or tilting back as far as possible every 15 minutes and holding that position for at least one minute (Consortium for Spinal Cord Medicine Clinical Practice Guidelines, Citation2014), but these guidelines vary depending on the source (Mayo Clinic, Citation2009). Strategies involving the redistribution of pressure through the use of weight shifts are widely accepted as evidence-based standard practice (Chen et al., Citation2014; Coggrave & Rose, Citation2003; Regan et al., Citation2009; Sonenblum et al., Citation2014; Sprigle & Sonenblum, Citation2011; Stinson et al., Citation2018).
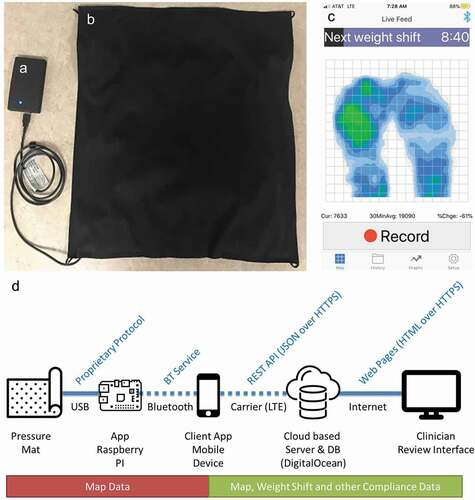
Adherence to recommended weight shifting routines is a challenge for individuals with SCI (Guihan & Bombardier, Citation2012; Sonenblum et al., Citation2016; Yang et al., Citation2009). Assistive technologies, such as timers, have been used (Vos-Draper & Morrow, Citation2016) to prompt individuals to perform weight shifts according to recommendations. However, previous technologies have not been shown to result in long-term changes in frequency, consistency, quality of, or duration of weight shifts (Vos-Draper & Morrow, Citation2016). Feedback gathered from Veterans and civilians with SCI indicated that visual feedback of their seating pressures, as opposed to a timer alone, would motivate them to improve their weight shifting behaviors and more closely match clinical recommendations (Olney et al., Citation2019). In response to the priority set by Veterans and civilians regarding visual feedback, our group developed the Assisted Weight Shift (AW-Shift©) system (Olney et al., Citation2019; Vos-Draper et al., Citation2013). The current AW-Shift© system provides real-time images of seat interface pressure with integrated pressure monitoring features on a smartphone () which connects via Bluetooth to a pressure mat that sits atop the participant’s wheelchair cushion. The AW-Shift© system was designed as a personal use technology for daily self-monitoring of pressure distribution.
Figure 1. The Assisted Weight Shift system; comprised of (a) an integrated battery and Raspberry Pi to pull pressure data via USB from the (b) commercially available pressure mat in a custom cover to fit on a wheelchair cushion. The pressure data is transmitted via Bluetooth to an app on a smart phone for (c) user visualization and interactions. (d) Data is transmitted through multiple steps form the pressure mat to a Clinician Review Interface, where the data were downloaded.
The overall goal of the AW-Shift© system and other similar mobile health (mHealth) interventions is to elicit behavioral change via the feedback provided to the user from the mobile application (app) (McKay et al., Citation2019). The AW-Shift© system targets weight shift behaviors and is grounded in social cognitive theory as a tool to build self-efficacy around managing pressure distribution (Bandura, Citation1997). Thus, theoretically, self-efficacy is strengthened with the ability to see the impact of movement on pressure, increasing motivation to initiate or maintain weight shift behaviors (Vos-Draper, Citation2018).
Sustaining participant engagement with mHealth interventions can be a challenge for long-term behavior change success. Despite utilizing user-centered design methods, mHealth interventions have high rates of attrition which is driven by intervention engagement and intervention fatigue (Nahum-Shani et al., Citation2018). Evidence suggests that the balance between engagement (i.e., motivational commitment) and fatigue (i.e., burnout, state of emotional or cognitive weariness) ebbs and flows throughout the intervention (Heckman et al., Citation2015; King et al., Citation2014). For mHealth interventions such as the AW-Shift© System, tracking real-time user interactions with the system can provide objective data on the level of engagement with the intervention. Further, these data can inform when engagement is decreased and may illuminate methods to sustain user interests.
The long-term goal of this project is to understand how access to live pressure mapping of the seating surface may change pressure management behaviors of individuals with SCI who use a wheelchair. As part of that goal, it is important to understand how an individual engages with the system through tracking their interactions with the system functions. The goal of this study was to use visualization techniques to understand the daily distributions of user interaction with a mobile pressure mapping application for wheelchair users at risk for pressure injuries. Data were captured from adults with SCI who use wheelchairs for seven days in their daily lives.
Methods
Participant recruitment
Participants between the age of 18 and 80 with SCI, who use a wheelchair (power or manual) as their main mode of mobility, were considered for enrollment in this study. Participants were required to be able to perform weight shifts independently, own/be able to operate a smartphone with iOS or android operating systems and tolerate sitting on the system for a minimum of six hours per day, seven days a week. Participants were excluded from the study if they had an active stage 3, 4, or unstageable pressure ulcer anywhere on their sitting surface as defined by the National Pressure Injury Advisory Panel definitions (Edsberg et al., Citation2016). Participants were also excluded if they were not able to complete an adequate weight shift without assistance, lived in a long-term care facility or group home, required 24-hour assistance, or had a known history which might have hindered their ability to follow the protocol. Participants were recruited from querying medical records, previous enrollment in an ancillary study, or referral by research or clinical staff. The study protocol was approved by the Mayo Clinic, University of Minnesota, and Minneapolis Veterans Administration Health Care System Institutional Review Boards and written informed consent was obtained from each participant prior to enrollment into the study.
The AW-shift system and data streams
The Assisted Weight Shift (AW-Shift©) system consists of (): (1) a 22 × 22 inch commercially available pressure mat (“Citation2020,”) encased in a custom seat cover, (2) a mobile app on a mobile phone (iOS or Android) (Regents of the University of Minnesota, Citation2020), and (3) a Raspberry Pi minicomputer with integrated battery (“Citation2020,”). The mat is commercially designed to detect seated pressures in wheelchair users and has met basic criteria for long-term use (Olney et al., Citation2019).
A four-part data transfer process was utilized to transmit the data from the pressure mat to an online Clinician Review Interface (). (1) Pressure data from the pressure mat were streamed to the Raspberry Pi via a USB connection. (2) Through Bluetooth connection, the data were then transmitted to an app on the user’s phone allowing for real-time pressure mat visualization. (3) Pressure data along with user interaction data were streamed to a cloud-based database via wireless fidelity (Wi-Fi) or the cell phone carrier data plan. (4) Finally, the pressure and app interaction data were viewable and downloaded through an online Clinician Review Interface. Data were downloaded in a comma separated variable (csv) format for post-processing. The Clinician Review Interface is an online portal that allows access to the research and/or clinical team to view a log of users weight shift reminder and notification settings, data on all user interaction with the AW-Shift© app, adherence to weight shift protocols, pressure map recordings made by the user, and pressure map frames recorded during alerts and during weight shifts.
Participant system use
Data presented here were collected as part of two studies (cohort A and cohort B). Upon enrollment into the study, all participants attended an in-person visit with study staff. During the visit, the pressure mat system was installed on participants’ wheelchair. Participants were instructed on how to install and remove the pressure mat encased in a cover. Participants in cohort A downloaded the AW-Shift© mobile phone app (Regents of the University of Minnesota, Citation2020) through the app store associated with their personal phone’s operating system. Cohort B received a study-provided phone that had the AW-Shift© app installed prior to providing the phone to the participant. The study that involved Cohort B was the first at-home use of the system, and the mobile app, at that time, only worked on Apple®-based products with an iOS operating system. We did not want access to a specific type of smartphone to be an exclusion to participation in the study. Further, participants in Cohort B were provided with a pre-paid 30-day data plan to allow for continuous data upload to the server in the absence of a Wi-Fi signal. Participants in Cohort B were given the phone to keep as part of their participation in the study as previously described (Olney et al., Citation2019). Study staff instructed participants on the system use, including navigating through four user screens (live map view, history of recordings, graphs of use, and setup/settings) (Olney et al., Citation2019).
Participants self-selected the frequency and duration of weight shift alerts. With the assistance of a licensed Occupational Therapist, participants also selected thresholds for global and local pressure alerts. The purpose of the global and local high pressure alerts was to help the user identify potential problems with pressure that they may not otherwise be able to detect due to impaired sensation. Initially, the global threshold was set as a jump of 50% above their 30 minute average pressure recording; however, participants were able to fine-tune and optimize this setting for their body and wheelchair setup. A global alert would be triggered by an overall rise in pressure, such as if a participant’s child sat on his/her lap or if an air-filled cushion deflated resulting in overall increased pressure. A local pressure alert occurred when there is a sustained increase in pressure in a small 4-sensor area of the mat. At the beginning of the study, this was set to a threshold of 30% increase for 5 minutes; however, users were again able to self-select the best parameters for them throughout the remainder of the study. If the percent change in pressure and duration thresholds exceeded in one of the 4-sensor regions of the mat, a local pressure alert was triggered. The local alerts could be triggered if a participant leaned to one side to complete a task for longer than the identified duration of time or if there was an object accidentally placed between them and their cushion. After these thresholds were set, users were educated on how to adjust the settings. Users were able to change the time-frame wherein notifications would start and end each day. Additionally, the type of alert/notification settings (sound, vibrate, screen flashing) could be set to the users’ preferences.
Participants were given a user manual and instructed on how to follow up with study staff if any questions arose. Users in cohort A were instructed to use the system for seven full days. Users in cohort B were instructed to use the system for four weeks; however, only the first seven consecutive days of data are presented here. Therefore, the data presented here include seven days for all participants. Participants were also instructed to charge the system each night and change any settings to match their individual needs; the goal was to better understand how users would interact with and utilize the AW-Shift© system in everyday life. All user setting changes and system interactions and their timestamps were tracked and recorded in a Clinician Review Interface.
AW-SHIFT© user interactions
A cloud-based server was utilized to record each pressure mat recording and user interaction with AW-Shift©. The variables tracked on the server included the date and time of weight shifts, alerts, and user actions (). Additional steps were taken to de-identify date/time variables for users in cohort B (data collected in the VA system).
Table 1. AW-Shift© system data which were collected and stored on the cloud-based server for post-processing.
To understand the benefits and use of the system, the number of application prompts and user interactions was recorded over the seven days and an average for each day for each category of data was calculated.
Weight shifts: Participants were able to select the duration and frequency of the weight shift reminders. When prompted to complete a weight shift they were able to select: “complete”, “snooze”, or “ignore”. When “complete” was selected, a timer with the pre-determined length for the duration of the weight shift was started. Once finished, the weight shift would be considered complete. The alert was snoozed when a participant manually clicked to “snooze” it; however, an alert was considered ignored when the “ignore” was manually clicked or the user did not interact with the system after the prompt. The number of reminders and participant’s responses were recorded.
Alerts: When participants were alerted of a local, global, or disconnection, they were able to acknowledge the alert. An alert was acknowledged when a participant clicks to accept it; an alert was considered ignored when the user did not interact with the phone after the alert.
User actions: The number of setting changes, logins, times the app was brought to the foreground of the phone, recordings, and playback of recordings were also recorded.
User interaction visualizations
Visualizing the individualized trends of these data inform how each participant utilized the system and can lead to clinical insights and hardware/software system improvements. Utilizing the date and time of specific events, circular frequency plots were created. Circular frequency plots are radial histograms which indicate how many times a specific activity occurs each hour. These methods were modeled after traditional wind rose plots (Pereira, Citation2020). Circular frequency plots were created for the number of times the app was brought to the foreground of the phone, participants were prompted to perform weight shifts, and alerts of potential increases in pressure were received. Data were also plotted for participants’ interactions with weight shift reminders, types of alerts received, and if participants interacted with or changed settings within two minutes of receiving an alert.
Results
Participants
This study included six adults with an SCI each using a manual or power wheelchair ().
Table 2. Participant demographics.
Summary data
All participants utilized the system differently (). Participant 1 brought the app to the foreground the most times (153 times) and had the highest rate of weight shift prompts. Participant 2 changed settings multiple times and fine-tuned them and was prompted to do the fewest number of weight shifts, receiving the fewest alerts. On average, users brought the app to the foreground of their phone between five and 22 times per day.
Table 3. The frequency of participant interactions with and prompts from the AW-Shift© app over the seven-day use period. Data are averaged for each day.
Data visualizations
Overall AW-Shift© app use
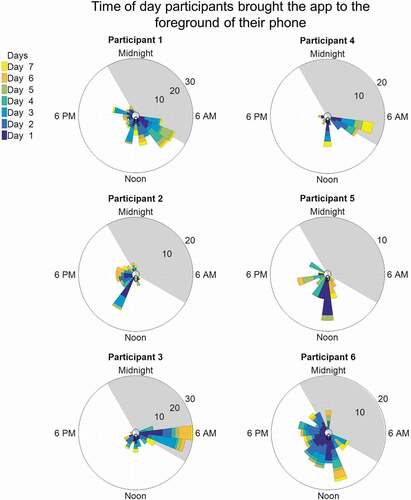
Participants brought the app to the foreground of their phone in different patterns of daily use (). For example, participants 1 and 6 utilized the app relatively evenly throughout the day. In contrast, participants 3 and 4 had peaks of use in the morning (before 8am). Participant 5, had high use patterns on day one with decreased use occurring during the remaining days of the study.
Figure 2. The number of times each participant brought the app to the foreground of their phone. The shaded grey regions indicate when notifications were originally set to not go off (10pm - 8 am).
Weight shift reminders
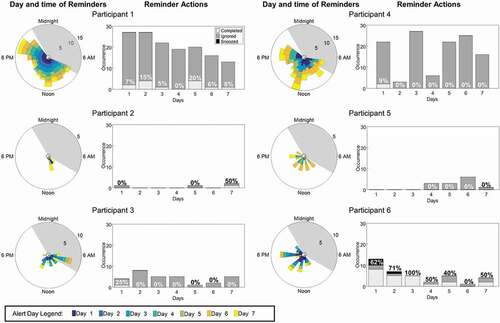
Participants also had varying responses to utilizing the app for weight shifts. demonstrates the time of day participants were prompted to complete a weight shift (these prompts were dependent on the individual user settings). This figure also shows the participants’ interaction with the reminder prompt and whether each participant self-reported completing the prompted weight shift. While participants 1 and 4 set the system to prompt a weight shift almost every hour, participants 2 and 5 set the app to rarely (greater than every 12 hours) prompt a weight shift. Participant 6 was the only participant to indicate she completed the majority of the weight shift reminders throughout the week. All other participants had low indication of completing the weight shift reminders throughout the week.
Figure 3. The day and time participants were prompted to complete weight shifts (left panel) and their responses to the completing the weight shifts prompts. The shaded grey diagonal lines indicate a completed weight shift, solid grey indicates an ignored weight shift, and black indicates a snoozed weight shift (right panel). The percent of completed weight shifts for each day is also indicated.
Alerts and setting changes
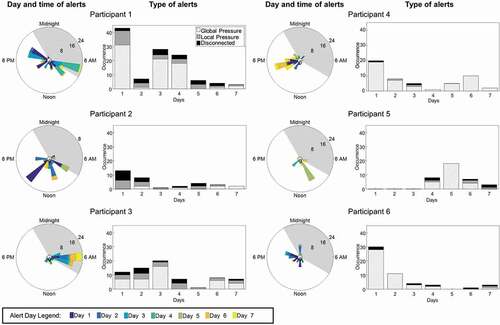
Multiple participants had alerts triggered in succession (example: participant 2, day 1 at 3pm and participant 5, day 5 at 10am, ). After the first day of system use, participant 2’s alerts began to decrease and stabilize. Participants 1 and 6 followed a similar trend, with overall decreased alerts throughout the week. Global alerts were the most frequent alert for all participants. All participants experienced daily alerts of disconnection between the phone and the AW-Shift© system.
Figure 4. The time of day participants are alerted of a global pressure alert, local pressure alert, or a disconnection of the system (left panel). The type of alerts participants receive each day (right panel).
When receiving an alert participant 3 was the most likely participant to interact with the app. Participants 1 and 6 interacted with the app a higher percentage of times on the first day than subsequent days (). Participant 5 received no alerts the first three days and rarely interacted with their phone following alerts on subsequent days. All participants had a low rate of setting changes after receiving an alert. Specifically, participant 2 who made the most changes did not make them within two minutes of receiving an alert ().
Figure 5. The number of times participants interacted (solid grey) or did not interact (grey diagonal lines) with the app after receiving an alert (left panel). The percentage indicates the percentage of time users interacted with the app after receiving an alert each day. The number of times participants changed their settings (solid grey) or did not change settings (solid black) within 2 minutes of receiving an alert (right panel). The percentage indicates the percentage of times users changed settings within 2 minutes of receiving an alert each day.
Discussion
This study aimed to use novel visualization techniques to understand how individuals with SCI interacted with a mobile pressure mapping app. This study is part of a larger project aimed at understanding how access to a live pressure mapping system may change pressure management of individuals with SCI who are at risk for pressure injuries. Circular frequency plots were used to understand the distribution of user interactions throughout the day.
Overall AW-Shift© app use
Participants utilized the app in different patterns. For example, two participants utilized the system throughout the course of the day (participants 1 and 6), while others had large peaks of use before 8am (participants 3 and 4). These patterns highlight two types of use for this system: regular spot checks throughout the day and morning daily wheelchair set up. There were no observed trends in overall use, weight shift reminders, alerts, or user interactions based on whether participants were in Cohort A (used personal phone, participants 1–3) or Cohort B (used study-provided phone, participants 4–6). Similar patterns of use and disuse were seen across both groups.
Weight shift reminders
If utilized, reminders to perform weight shifts could increase the frequency and duration of weight shifts participants perform each day. Two participants set the app to receive reminders throughout the entire course of their waking day (participants 1 and 4), two received reminders every 2–4 hours (participants 3 and 6), and two received reminders only a few times a day if any (participants 2 and 5). Independent of how often reminders were received five of the six participants rarely indicated the completion of weight shifts (participants 1, 2, 3, 4, and 5). This may indicate that other features of the app (such as the live map or alerts) were more useful to the participants than the reminder to complete a weight shift. These behaviors align with previous reports that timers alone are not as beneficial as including a live map for participants to view (Olney et al., Citation2019). Further, participant use patterns may also indicate a need to better educate participants that the current system does not count a weight shift as completed unless the participant indicates it on the app. As this study was not designed to understand the implications of self-management, future work should focus on empowering and measuring participant self-management. Future work should also utilize a closed-loop system to automatically determine when weight shifts occur (both after a prompted reminder and throughout additional periods of the day) and alter reminders accordingly.
Alerts and setting changes
Alerts can be used to inform participants of potentially risky positions and clinicians of the need to reevaluate a patient’s wheelchair setup. The frequency and type of alerts are also important for both groups as they give more details about potentially risky areas or setup improvements. The triggering of multiple alerts on the first day, followed by lower rates of triggering indicates participants were able to fine-tune their settings to their body and wheelchair setup. Additionally, the utilization of the system and prompts/alerts were new to participants and could have been challenging for participants to get accustomed to. A high rate of setting changes within two minutes of alerts could indicate annoyance with the system. As this was not seen, we assume participants were able to optimize the alerts to their needs so they occurred in appropriate times of need. However, system disconnection alerts were common for all participants, indicating challenges with the system coming unplugged. Future hardware design should implement improved techniques to ensure the system stays connected while on a variety of different wheelchairs.
Tracking participant engagement in mobile health interventions
Maintaining participant engagement in mHealth interventions can be challenging as data suggest that individuals abandon mHealth apps after only a few uses (Eysenbach, Citation2005; Fukuoka et al., Citation2015). In a trial testing the use of a weight-loss app, user interactions were tracked by the number of logins (Laing et al., Citation2014). In the first month of use, the median number of logins was eight times while in the second month the median logins dropped to one time. After six months of use, the number of logins dropped by 64%. The number of logins is a common, yet unidimensional metric to explore user interactions. All participants in the current study had no logins, as the system login occurred before data collection began. By investigating the types of user interactions and setting changes, we are able to dig deeper into system functionality that may draw more or less attention from users. For example, our data suggest that Participant 2, made many setting changes (n = 136), which disabled weight shift reminders, but maintained all alerts. Through follow-up discussion, we could determine if this was reflective of the participant’s dislike of weight shift reminders, but motivation to shift when alerted of high pressures. There is a need for mHealth interventions to develop methods to accommodate changing needs and desires of users over time. Future use of Ecological Momentary Assessment (sampling of participants experiences in real-time) during major setting changes could enhance understanding of the motivations of our participants allowing for better tailoring of the mHealth intervention to the individual (Shiffman et al., Citation2008).
Wind rose charts were developed for meteorologists to graph the speed and direction of winds at a specific location. However, with the growth of day-long, field-based sensor data collections, the circular shape of the charts and the clock-like format has leant itself to the representation of data plotted over a 24-hour period in a day. Circular frequency plots have been used to plot the locations of Parkinson’s patients in their home including the time spent in bed detected by a stand-off monitoring system (Kabelac et al., Citation2019). The color representation of different conditions allows for quick interpretation as to the time and the magnitude or volume of a condition. Visualizing the mobile app interactions in this way has highlighted multiple use cases of this system. For example, some participants primarily viewed the live map in the morning indicating its use in morning wheelchair set up, while others viewed the app throughout the day indicating its use for live pressure mat spot checks. Additionally, this visualization technique allows for a novel and easily understood tool for clinicians.
Clinical benefits
The use of circular frequency plots is an innovative visualization tool for succinctly depicting AW-Shift© usage patterns and this is potentially very useful clinically. Clinicians who specialize in SCI rehabilitation or seating and mobility services could receive a weekly or monthly visual overview of a client or patient’s adherence to a recommended weight shift routine. Clinicians often have little time to read large amounts of data on their many clients; however, if the data were condensed into a simple graphic, they may be able to more easily integrate a system like AW-Shift© into their clinical practices.
There are a number of clinically relevant uses for the ability to visualize user interaction with technology designed for self-monitoring. First, clinicians can gain a clearer understanding about user preferences for using real-time pressure mapping as a way to initiate and sustain behaviors around managing pressure. Pressure injury prevention education focuses heavily on strategies for offloading or redistributing pressure, and this technology is commonly used clinically to help make decisions about seating equipment and wheelchair set-up. When users are able to use this same information throughout their daily routine, they may have increased adherence to managing pressure. Another potentially useful clinical application for AW-Shift© is in the area of early training in the use of weight shifts. The detailed information available in the Clinician Review Interface can inform goal setting, intervention planning, and objective documentation of progress toward weight shift adherence goals for example.
Limitations
A major limitation of the conclusions drawn from this study is the small sample size. At the time of this study, the AW-Shift© system was not designed with the ability to continuously upload pressure data from the system to the cloud server. Additionally, the AW-Shift© system’s weight shift reminders are based on an independent timer and the execution of a weight shift between reminders did not change the frequency of weight shift reminders. Ideally, pressure map data would be classified as a weight shift or lean event and a closed-feedback system would restart the weight shift timer. Further, participants indicated their adherence to weight shifts through the app; however, the pressure mat data were not used to verify their recorded adherence. Due to the lack of continuous pressure mat data and weight shift participant self-reporting, the number of accomplished weight shifts could be inaccurate. We did not collect data on whether participants in Cohort B had access to a personal phone or if they used another phone in addition to the study-provided phone. Therefore, we do not know if access to another phone affected their use of the study-provided phone. Presentation and discussion of structured interview data would improve the interpretation of the results; however, the protocol of Cohort A did not include a structured interview. Structured interview data from Cohort B is reported in (Olney et al., Citation2019). Our collection of baseline characteristics of each participant was limited. We did not collect important factors such as technology aptitude, health literacy, hand function, pain level, fatigue, or cognitive function. The collection of expanded factors would aid in interpretation of our results.
Conclusion
This study aimed to utilize novel visualization techniques to understand user interactions with a pressure mapping system. The visualizations demonstrated the system was utilized for both morning wheelchair setup and pressure spot checks throughout a seven-day period. Additionally, participant-indicated adherence to reminders to perform a weight shift was low suggesting other parts of the system (such as the live pressure mat) were more useful than the weight shift reminders. In the future, these visualizations can be used to provide clinicians with a daily view of amount and times of weight shifts for patients. Future work will investigate raw pressure mat data and create a weight shift detection algorithm.
Additional information
Funding
References
- Adriaansen, J. J., Ruijs, L. E., van Koppenhagen, C. F., van Asbeck, F. W., Snoek, G. J., van Kuppevelt, D., Visser-Meily, J., & Post, M. W. (2016). Secondary health conditions and quality of life in persons living with spinal cord injury for at least ten years. Journal of Rehabilitation Medicine, 48(10), 853–860. https://doi.org/https://doi.org/10.2340/16501977-2166
- Bandura, A. (1997). Self-efficacy: The exercise of control. W.H. Freeman.
- BodiTrack Seat System. (2020). http://www.vista-medical.com/subsite/stretchseat.php
- Chen, Y., Wang, J., Lung, C.-W., Yang, T. D., Crane, B. A., & Jan, Y.-K. (2014). Effect of tilt and recline on ischial and coccygeal interface pressures in people with spinal cord injury. American Journal of Physical Medicine & Rehabilitation, 93(12), 1019–1030. https://doi.org/https://doi.org/10.1097/PHM.0000000000000225
- Coggrave, M., & Rose, L. (2003). A specialist seating assessment clinic: Changing pressure relief practice. Spinal Cord, 41(12), 692–695. https://doi.org/https://doi.org/10.1038/sj.sc.3101527
- Consortium for Spinal Cord Medicine Clinical Practice Guidelines. (2014). Pressure ulcer prevention and treatment following injury: A clinical practice guideline for health-care providers. http://www.pva.org/media/pdf/CPG_Pressure%20Ulcer.pdf
- DeJong, G., Hsieh, C.-H. J., Brown, P., Smout, R. J., Horn, S. D., Ballard, P., & Bouchard, T. (2014). Factors associated with pressure ulcer risk in spinal cord injury rehabilitation. American Journal of Physical Medicine and Rehabilitation, 93(11), 971–986. https://doi.org/https://dx.doi.org/10.1097/PHM.0000000000000117
- Edsberg, L. E., Black, J. M., Goldberg, M., McNichol, L., Moore, L., & Sieggreen, M. (2016). Revised national pressure ulcer advisory panel pressure injury staging system: Revised pressure injury staging system. Journal of Wound, Ostomy, and Continence Nursing, 43(6), 585. https://doi.org/https://doi.org/10.1097/WON.0000000000000281
- Eysenbach, G. (2005). The law of attrition. Journal of Medical Internet Research, 7(1), e11. https://doi.org/https://doi.org/10.2196/jmir.7.1.e11
- Fukuoka, Y., Gay, C., Haskell, W., Arai, S., & Vittinghoff, E. (2015). Identifying factors associated with dropout during prerandomization run-in period from an mHealth physical activity education study: The mPED trial. JMIR mHealth and uHealth, 3(2), e34. https://doi.org/https://doi.org/10.2196/mhealth.3928
- Guihan, M., & Bombardier, C. H. (2012). Potentially modifiable risk factors among veterans with spinal cord injury hospitalized for severe pressure ulcers: A descriptive study. The Journal of Spinal Cord Medicine, 35(4), 240–250. https://doi.org/https://doi.org/10.1179/2045772312Y.0000000016
- Guihan, M., Hastings, J., & Garber, S. L. (2009). Therapists’ roles in pressure ulcer management in persons with spinal cord injury. The Journal of Spinal Cord Medicine, 32(5), 560–565. https://doi.org/https://doi.org/10.1080/10790268.2009.11754561
- Heckman, B. W., Mathew, A. R., & Carpenter, M. J. (2015, October). Treatment burden and treatment fatigue as barriers to health. Current Opinion in Psychology, (5), 31–36. https://doi.org/https://doi.org/10.1016/j.copsyc.2015.03.004
- Kabelac, Z., Tarolli, C. G., Snyder, C., Feldman, B., Glidden, A., Hsu, C.-Y., Hristov, R., Dorsey, E., & Katabi, D. (2019). Passive monitoring at home: A pilot study in Parkinson disease. Digital Biomarkers, 3(1), 22–30. https://doi.org/https://doi.org/10.1159/000498922
- King, G., Currie, M., & Petersen, P. (2014). Child and parent engagement in the mental health intervention process: A motivational framework. Child and Adolescent Mental Health, 19(1), 2–8. https://doi.org/https://doi.org/10.1111/camh.12015
- Krause, J. S., Cao, Y., DeVivo, M. J., & DiPiro, N. D. (2016). Risk and protective factors for cause-specific mortality after spinal cord injury. Archives of Physical Medicine and Rehabilitation, 97(10), 1669–1678. https://doi.org/https://doi.org/10.1016/j.apmr.2016.07.001
- Laing, B. Y., Mangione, C. M., Tseng, C.-H., Leng, M., Vaisberg, E., Mahida, M., Bholat, M., Glazier, E., Morisky, D. E., & Bell, D. S. (2014). Effectiveness of a smartphone application for weight loss compared with usual care in overweight primary care patients: A randomized, controlled trial. Annals of Internal Medicine, 161(10_Suppl.), S5–S12. https://doi.org/https://doi.org/10.7326/M13-3005
- Mayo Clinic. (2009). Mayo clinic guide to living with a spinal cord injury. Demos Medical Publishing.
- McKay, F. H., Wright, A., Shill, J., Stephens, H., & Uccellini, M. (2019). Using health and well-being apps for behavior change: A systematic search and rating of apps. JMIR mHealth and uHealth, 7(7), e11926. https://doi.org/https://doi.org/10.2196/11926
- Nahum-Shani, I., Smith, S. N., Spring, B. J., Collins, L. M., Witkiewitz, K., Tewari, A., & Murphy, S. A. (2018). Just-in-time adaptive interventions (JITAIs) in mobile health: Key components and design principles for ongoing health behavior support. Annals of Behavioral Medicine, 52(6), 446–462. https://doi.org/https://doi.org/10.1007/s12160-016-9830-8
- National Spinal Cord Injury Statistical Center. (2018). Facts and figures at a glance. https://www.nscisc.uab.edu/Public/Facts%20and%20Figures%20-%202018.pdf
- Olney, C. M., Vos-Draper, T., Egginton, J., Ferguson, J., Goldish, G., Eddy, B., … Morrow, M. (2019). Development of a comprehensive mobile assessment of pressure (CMAP) system for pressure injury prevention for veterans with spinal cord injury. J Spinal Cord Med, 6(42), 1–10. https://doi.org/https://doi.org/10.1080/10790268.2019.1570437
- Pereira, D. (2020). Wind rose. https://www.mathworks.com/matlabcentral/fileexchange/47248-wind-rose
- Piatt, J. A., Nagata, S., Zahl, M., Li, J., & Rosenbluth, J. P. (2016). Problematic secondary health conditions among adults with spinal cord injury and its impact on social participation and daily life. The Journal of Spinal Cord Medicine, 39(6), 693–698. https://doi.org/https://doi.org/10.1080/10790268.2015.1123845
- RaspberryPi. (2020). https://www.raspberrypi.org/
- Regan, M. A., Teasell, R. W., Wolfe, D. L., Keast, D., Mortenson, W. B., & Aubut, J. A. L. (2009). A systematic review of therapeutic interventions for pressure ulcers after spinal cord injury. Archives of Physical Medicine and Rehabilitation, 90(2), 213–231. https://doi.org/https://doi.org/10.1016/j.apmr.2008.08.212
- Regents of the University of Minnesota. (2020). AW-Shift In (Vol. 0.1.0). App Store (iTunes/Google Play).
- Shiffman, S., Stone, A. A., & Hufford, M. R. (2008). Ecological momentary assessment. Annual Review of Clinical Psychology, 4(1), 1–32. https://doi.org/https://doi.org/10.1146/annurev.clinpsy.3.022806.091415
- Sonenblum, S. E., Sprigle, S., & Martin, J. S. (2016). Everyday sitting behavior of full time wheelchair users. Journal of Rehabilitation Research and Development, 53(5), 585–598. https://doi.org/https://dx.doi.org/10.1682/JRRD.2015.07.0130
- Sonenblum, S. E., Vonk, T. E., Janssen, T. W., & Sprigle, S. H. (2014). Effects of wheelchair cushions and pressure relief maneuvers on ischial interface pressure and blood flow in people with spinal cord injury. Archives of Physical Medicine and Rehabilitation, 95(7), 1350–1357. https://doi.org/https://doi.org/10.1016/j.apmr.2014.01.007
- Sprigle, S., & Sonenblum, S. (2011). Assessing evidence supporting redistribution of pressure for pressure ulcer prevention: A review. Journal of Rehabilitation Research and Development, 48 (3), 203–213. https://www.ncbi.nlm.nih.gov/pubmed/21480095
- Stinson, M., Ferguson, R., & Porter-Armstrong, A. (2018). Exploring repositioning movements in sitting with ‘at risk’ groups using accelerometry and interface pressure mapping technologies. Journal of Tissue Viability, 27(1), 10–15. https://doi.org/https://doi.org/10.1016/j.jtv.2017.11.001
- Vos-Draper, T. (2018). Seat interface pressure mapping to improve weight shift performance in spinal cord injured wheelchair users [PhD]. University of Minnesota.
- Vos-Draper, T., & Morrow, M. M. B. (2016). Seating-related pressure injury prevention in spinal cord injury: A review of compensatory technologies to improve in-seat movement behavior. Current Physical Medicine and Rehabilitation Reports, 4(4), 320–328. https://doi.org/https://doi.org/10.1007/s40141-016-0140-7
- Vos-Draper, T., Rindflesch, A., & Morrow, M. M. B. (2013). Wireless, real-time seat interface pressure mapping with a smartphone as biofeedback for positioning and pressure relief[ Paper presentation]. The Rehabilitation Engineering and Assistive Technology Society of North America’s 36th International Annual Conference, Seattle, WA.
- Yang, Y. S., Chang, G. L., Hsu, M. J., & Chang, J. J. (2009). Remote monitoring of sitting behaviors for community-dwelling manual wheelchair users with spinal cord injury. Spinal Cord, 47(1), 67–71. https://doi.org/https://doi.org/10.1038/sc.2008.72