
ABSTRACT
The supply of and market demand for assistive products (APs) are complex and influenced by diverse stakeholders. The methods used to collect AP population-level market data are similarly varied. In this paper, we review current population-level AP supply and demand estimation methods for five priority APs and provide recommendations for improving national and global AP market evaluation.
Abstracts resulting from a systematic search were double-screened. Extracted data include WHO world region, publication year, age-groups, AP domain(s), study method, and individual assessment approach.
497 records were identified. Vision-related APs comprised 65% (n = 321 studies) of the body of literature; hearing (n = 59), mobility (n = 24), cognitive (n = 2), and studies measuring multiple domains (n = 92) were proportionately underrepresented. To assess individual AP need, 4 unique approaches were identified among 392 abstracts; 45% (n = 177) used self-report and 84% (n = 334) used clinical evaluation. Study methods were categorized among 431 abstracts; Cross-sectional studies (n = 312, 72%) and secondary analyses of cross-sectional data (n = 61, 14%) were most common. Case studies illustrating all methods are provided.
Employing approaches and methods in the contexts where they are most well-suited to generate standardized AP indicators will be critical to further develop comparable population-level research informing supply and demand, ultimately expanding sustainable access to APs.
Introduction
An assistive product (AP) is defined as a product used externally to the human body, whose primary purpose is to maintain or improve an individual’s functioning and independence and thereby promote his or her well-being (WHO, Citation2016). Global population aging forecasts a rise in the need for solutions that support participation and independence, including APs. AP provision is complex largely due to many different types of AP and the accompanying service provision systems that are necessary to meet the supply of and demand for each product. The AP supply and demand markets are therefore influenced by many different stakeholders, including product designers, manufacturers/producers, suppliers, distributors, purchasers, healthcare providers, policy-makers, and users, all who are collectively referred to as AP market-shapers in this paper. Given their diversity across industries and settings, AP market-shapers perceive and evaluate AP markets in distinct ways. Therefore, it is difficult to compare much of the existing market-level research on APs, or gauge how each market-shaper is being informed, due to varying definitions of AP measures and methodological strategies used. This review will explore the research informing AP supply and demand estimates by identifying common approaches and methods, comparing their strengths and limitations, and describing the settings where each may be most effective.
sData on AP supply and demand are needed for AP purchasers, such as governments, UN agencies, and civil society organizations, to make decisions about investing in AP supply chain infrastructure, and for AP designers and distributors to identify populations in need of APs. Yet these data are severely limited. Globally, the AP supply chain is highly fragmented and hardly exists in many low-resource settings characterized by little purchasing power and lacking service delivery systems. This sector has historically not been prioritized by governments in low/middle-income countries (LMICs), and only recently been recognized on the international agenda (Albala et al., Citation2019). As a result, individual needs for APs have not been measured and supply chain infrastructure is not in place to approximate or infer the population-level need. Data in this sector must be improved to make the case for prioritizing AP access. Without these data, it is difficult to attract innovators and entrepreneurs to this space since an understanding of market size is required to attract investment. Initiatives and policies aimed at expanding AP access are also difficult to prioritize, evaluate, and compare internationally (de Witte et al., Citation2018). This gap in supply and demand data leads to uncertainties and inconsistencies in AP provision, procurement, and provider training, three major parts of an AP market.
In order to estimate AP supply and demand, researchers have used a variety of strategies to understand the coverage and need of APs at the population-level. Three characteristics of reported research must be understood when interpreting this body of evidence. First, the indicators of access to APs that inform estimates of population-level supply and demand, which are generated in AP research. Second, the approach to assessing the presence or absence of individual AP need. Third, the study design and/or analysis method reported in each study.
AP market-shapers need a comprehensive understanding of how different research characteristics can be used to evaluate AP markets, including their strengths, limitations, and contexts where they may be most appropriate. Therefore, there is a need to consolidate existing research to identify and review the approaches and methods that inform population-level AP supply and demand estimates (Layton & Borg, Citation2019; Matter et al., Citation2017). Understanding how to appropriately apply these characteristics and interpret their findings is essential to reliably inform AP market-shapers and improve access to APs.
Objectives
Scoping reviews are well-suited to describe the characteristics of a body of evidence, examine and clarify definitions in literature, and inform future systematic reviewing (Munn et al., Citation2018). We therefore chose this method to learn how different approaches and methods have been used to generate AP indicators that inform supply and demand estimates. This method further allows us to identify overarching research gaps. This scoping review is also nested within the corpus of literature captured for a systematic review of population-level estimates of AP needs and coverage, with the more direct aim of collating the findings of each included study.
In this review, we present how population-level estimates of AP supply and demand are informed at the national and global levels for five priority APs: wheelchairs, hearing aids, limb prosthetics, eyeglasses for distance and reading, and personal digital assistants (ATscale & AT2030, Citation2020). Specific objectives include (1) characterizing the contexts and components of existing research, (2) develop working definitions for AP supply and demand, (3) identify assessment approaches used to generate AP indicators and recommend the most effective setting for each, (4) identify population-level study design and analysis methods using these approaches, and recommend the most effective setting for each, and (5) identifying gaps in knowledge and practice in existing research on AP supply and demand.
Methods
Defining key AP indicators
To inform our literature search, we compiled a list of AP indicators with proposed definitions that can inform supply and demand estimates for APs, based on authors’ expertise and relevant literature (Frost et al., Citation2016; WHO, Citation2011) and the contributions of this author group. The working definitions and equations were iteratively developed by authors before beginning the systematic search and are provided in . These AP indicators informed the systematic literature search string presented in , and their definitions were used for consistency when reviewing and categorizing studies’ outcomes relevant to APs.
Table 1. Population-level AP indicators and definitions
Table 2. Systematic search string
Indicators described in may be estimated depending on variations in available data. The consistent use of these definitions in AP research is recommended, however, their comparability across studies is influenced by the approach and method used to gather the data. The influences of relevant approaches and methods are described in .
Systematic search
A systematic search was conducted for this scoping review in March 2020, designed to identify studies reporting population-based estimates of AP indicators (as shown in ). PRISMA reporting guidelines for systematic reviews were adhered to throughout, as the search and review process is also designed for the accompanying systematic review, published separately (Moher et al., Citation2016).
The search spanned fifteen databases: Ovid (MEDLINE, EMBASE, AMED, Global Health, PSYCHInfo), Global Index Medicus (AIM – African Index Medicus; LILACS – Latin American and Caribbean Health Sciences Literature; IMEMR – Index Medicus for the Eastern Mediterranean Region; IMSEAR – Index Medicus for the South-East Asian Region; WPRIM – Western Pacific Region Index Medicus), CINAHL Plus, Cochrane Database of Systematic Reviews, Science Direct, OpenGrey, and Grey Literature Report.
Our search string was iteratively developed with contributions of key terms and working definitions from and preliminary test-searches in Ovid MEDLINE. displays the string used in our systematic search. These parameters specified that a study must include a synonym for assistive product and/or the name of the actual AP, as well as an AP measurement and a synonym for impairment in its title and/or abstract. To accommodate different database search needs, minor alterations to the string regarding truncation and structure were made.
Complementary searching
To identify relevant estimation methods outside of literature published in databases, an inquiry was emailed to key AP stakeholders from relevant IGO/NGOs, ministries, and private companies. Representatives were purposively identified as either contributors to the Product Narratives (ATscale & AT2030, Citation2020) or attendees of the 2019 GReAT Consultation (Layton & Borg, Citation2019). A total of 109 representatives were asked to e-mail records documenting how they assessed demand for APs among the population they served, like protocols, studies, or reports, in order to inform their supply decisions. Evidence provided by these AP market-shapers helped to select and categorize case studies for our results and added overall to our body of literature.
Selection criteria
Peer-reviewed and gray literature were included in our review. Our search included records dating from 2000, published in either English, French, Spanish, or Portuguese, or providing a translation to one of these languages.
Inclusion Criteria:
Study outcomes include at least one AP indicator informing supply/demand, as shown in .
Study uses a representative population-based sample.
AP indicator includes at least one of the followings: wheelchairs, hearing aids, limb prosthetics, eyeglasses for distance and reading, and personal digital assistants (WHO, Citation2016).
Exclusion Criteria:
Study focuses only on services associated with AP, without providing an AP indicator from .
Study does not have an abstract (if peer-reviewed).
Screening & extraction
After removing duplicates, all studies resulting from the systematic search underwent a title/abstract screening protocol to identify records relevant to the inclusion criteria. Identified records were then screened by second reviewers and conflicts resolved by a third. To reduce the risk of bias, 10% of initially excluded records were also screened by two second reviewers, selected as the first 100 of every 1000. Included studies were combined with records resulting from stakeholder outreach, with duplicates removed, and finalized as our collection of literature. Records not meeting the inclusion criteria, but still providing valuable background information, were flagged at each stage and are included as references. Due to the high volume of resulting studies, only abstract-level data were extracted, with the exception of case studies. However, full-text data extraction is completed for the subset of these records comprising the accompanying systematic review.
Study characteristics data, including publication date, AP domain, age groups included, country location(s), and corresponding WHO world region(s), were extracted from all abstracts providing this information. AP assessment approaches and study design method were also extracted. Assistive products were grouped by functional domain during extraction, as many assessments included similar APs: in this review, vision corresponds to distance and reading glasses, hearing to hearing aids, mobility to prosthetics and wheelchairs, and cognitive to personal digital assistants.
For the purpose of this paper, case studies were identified to illustrate each of the main methods (i.e. study design/analysis) used to generate AP indicators that inform supply or demand estimates. Studies were included if they captured the main strengths and limitations of their respective method and were judged by the authors to contribute a useful strategy for settings that differed in data and resource availability. Case studies were also chosen to represent a range of populations with respect to geography, age groups, and AP domains. Identified studies were subject to two full-text reviews and those approved were summarized and are included in Results & Discussion.
Results & discussion
Our results and discussion are combined in the following five sections corresponding to our objectives: (1) Literature Characteristics, (2) Working Definitions of Supply and Demand, (3) AP Assessment Approaches, (4) AP Study Methods, and (5) Gaps in Research. Recommendations for using each study characteristic when conducting population-based AP research or maximizing existing datasets are included at the end of sections 3 and 4, with overall recommendations provided after Results & Discussion.
Literature characteristics
A total of 14,867 unique records were captured in the systematic search. After a broad title/abstract review, 1,206 records were identified for a second review. Following the second review of title and abstract only, 462 studies were included in our body of literature. A total of 63 conflicts were settled by a third reviewer, demonstrating inter-rater agreement of 95%. Our inquiries to 109 AP market-shapers resulted in 42 responses via e-mail. 35 relevant, unique articles were identified from this process and were combined with the results from the systematic database search, resulting in a total collection of 497 records.
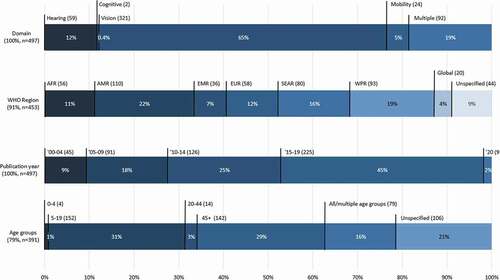
Study characteristics were extracted from the 497 records. Functional domains and publication year were extracted from all records; however, WHO region and age groups studied are available in 91% (n = 453) and 79% (n = 391) of studies, respectively. These results are represented in . Regarding functional domains, 65% (n = 321) of the studies relate to vision. Only 0.4% of studies (n = 2) exclusively studied cognitive impairment and relevant APs, though this domain is also included in 10 of the 91 studies covering multiple domains. A total of 12% of studies (n = 59) exclusively focus on hearing and 5% (n = 24) on mobility. The WHO region of the Americas (AMR) is most frequently represented in our literature, at 22% (n = 110); however, over half of these (n = 60) focus on the United States of America with less representation of Latin American countries. The most represented country for the AFR region is Nigeria (n = 14); for EMR, Iran (n = 11) and Pakistan (n = 10); for EUR, the United Kingdom (n = 10); for SEAR, India (n = 45), and for WPR, China (n = 27). Publication dates, represented in in 5-year intervals, demonstrate that studies reporting AP indicators as outcomes consistently increase over the past twenty years. Age groups included in each study are roughly categorized with no more than 10 years of overlap, with groupings defined based on those most commonly used in the literature. Most studies focusing on older adults (45+) did not include an upper-age limit. These findings show most studies focus on the school-aged population between 5 and 19 years old (31%, n = 152) and older adults over the age of 45 (29%, n = 142). School-based screenings are reflected as a widely practiced research strategy in the literature, as significant health gains are associated with early intervention. The higher prevalence of functional limitations among older adults may also explain the significant focus on those near or post-retirement.
Figure 1. Abstract characteristics.
represent the proportions of different AP assessment approaches and study methods by functional domain and WHO world region. Reviews, mixed-methods, pilot studies, and those with unspecified methods (67 studies in total) are excluded from . Subsequently, 431 remaining abstracts specify both domain and study method, while 392 specify both domain and assessment approach; these totals are reflected in . WHO world region and study method are specified in 402 abstracts, while WHO world region and assessment approach are specified in 355 abstracts; these data are detailed in .
Table 3. AP study methods and assessment approaches by functional domain
Table 4. AP study methods and assessment approaches by WHO world region
Results displayed in reflect that cross-sectional vision surveys dominate the identified literature and most often used clinical assessments. Vision is also the only domain to use indirect assessment approaches to generate AP indicators (see ). There is very little population-level research done on mobility APs; the majority of data gathered on mobility devices is a result of self-report in cross-sectional surveys and secondary analyses of the same data. However, studies examining cognitive APs at the population-level are even less common.
Data displayed in demonstrate that cross-sectional studies are the most common study design/analysis method used in every WHO world region. Key informant studies are a newer method and have only been conducted in Malawi and Nigeria (Duke et al., Citation2013; Tataryn et al., Citation2017). It is difficult to ensure an analysis of medical records is representative of the population; this method is made easier in countries with centralized health information management systems and more universal health coverage, which may explain why this method is most common in Europe. For all regions, most of the evidence was based on clinically assessed AP need. However, AMR countries have also incorporated a substantial proportion of self-reported data. In WPR and EMR countries, roughly one-third of the existing evidence basis is considerate of the individual’s perception of their needs.
Working definitions of supply and demand
Initially, apparent in our findings is the lack of a common definition and indicators for AP supply, which reflects the highly fragmented AP marketplace. In our body of literature, 3% of studies (n = 14) mention the supply of APs and services. Of these, five studies mention that supply chains should be well-developed as a concluding recommendation, and none of the studies provide a more detailed outcome measure for supply than the quantity of APs stocked in, or prescribed by, a clinic. This represents a significant gap in understanding how effective, sustainable supply chains are defined, planned and evaluated. Additionally, in our literature, “supply” more often refers to industry-level action and “supply-side” is used to describe the relationship between manufacturers and distributors/service providers. This finding indicates that this market aspect is less influenced by individual-level data, and may be better understood by examining international trade and market-shaping (Ramos & Battistella, Citation2019).
AP demand appears more frequently in the literature, but with several definitions/conceptual understandings. Where data are limited, demand is often equated to need or potential demand, (Harkins et al., Citation2013). Where more nuanced information on AP ownership, use, and coverage are collected in the study, demand is sometimes described in more detail with consideration of existing met need or user preference (Cornman & Freedman, Citation2008). Some studies also measure AP awareness, which may directly or indirectly influence perceived and expressed demand, but more research is required to better understand this relationship, specifically regarding under and overestimates of demand. It is also important that essential AP services to meet individuals’ AP needs are included when estimating the total demand for an AP. To establish a measure of total AP demand, the product’s essential services must be included alongside AP need. We therefore propose the following definitions for use in future research:
Supply: The process by which APs and essential parts are delivered from manufacturers to AP/essential service providers, either through sale or donation.
Demand: The proportion of a defined population who are willing to seek, in some instances pay for, and use an AP/essential service which they perceive they could benefit from, and do not currently have.
These definitions accommodate different approaches and methods used to obtain population-level AP indicators. Approaches and methods are described in detail in the following two Results & Discussion sections.
Approaches to AP assessment
Several approaches are currently used to assess AP needs among individuals within studies and subsequently generate AP indicators for a population. These approaches include participant self-report, clinical impairment assessment, functional assessment, and the use of indirect or proxy measurements, such as impairment prevalence (Boggs et al., Citation2019). For each approach used in a study method, there are inherent strengths and limitations, as described in . Multiple approaches can be used in a single study; all instances of each approach being used in the first summary column, “Overall use.” The instances of studies relying exclusively on a particular approach are also provided in the second summary column, “Exclusive use.” For example, of all abstracts detailing assessment approaches (n = 392), 85% incorporated clinical assessment data, yet 68% of these studies (n = 228, or 58% of the total) exclusively rely on clinical assessment. This may mean those findings are limited in the consideration of an individual’s experience or personal environment when determining whether they may benefit from having an AP. Alternatively, studies employing multiple approaches could support or validate a clinical assessment with self-reported data.
Table 5. Approaches to AP Assessment
As many AP procurers and suppliers estimate their target market’s demand based on existing research, understanding the strengths and limitations of the AP assessment approaches used is important. For example, using impairment prevalence as a proxy for AP need may require several assumptions that may limit the accuracy of AP indicator estimates. Some conditions or pathologies are strongly associated with specific APs; uncorrected refractive error (URE) indicates need for distance glasses and supply/demand measurements for this AP may reasonably be estimated from prevalence estimates of URE, according to clinical impairment assessments. However, for other APs (e.g., prostheses) the association with impairment may be more complex and influenced by the environment. An individual’s perception of their own impairment may also differentiate their AP demand from their AP need (e.g., hearing aids). Methods using these approaches are detailed in the next section of Results & Discussion and summarized in .
Table 6. Summary of methods generating AP indicators at the population-level
AP study methods
Approaches for individual AP needs assessment can be used in a variety of study methods; it is therefore important to present an overview of these methods and describe the strengths and weaknesses. The following Results & Discussion section details the most used methods and includes case study examples, for which the AP assessment approaches and measurements are also described. These methods and their representative case studies are categorized as (1) study designs for collecting primary data and (2) study designs using secondary data sources. Analysis techniques that are feasible for all included study designs are also detailed in the final section of AP Study Methods.
Collecting primary data
Primary data collection of AP indicators may be useful where existing population-level data are lacking or inadequate, and where resources permit. Cross-sectional surveys were the most common method of primary data collection appearing in our body of literature, as both population-based (household surveys) and those conducted in specific settings/population (e.g. school based). Other study designs included key informant and longitudinal studies.
Cross-sectional study
Population-based surveys can be used to generate estimates of AP indicators as detailed in and are important for planning supply and estimating demand. Data collected with this method can also be disaggregated by socio-demographic characteristics (e.g. age, sex, socio-economic status, geographical area) to estimate inequalities, for example, in AP coverage. Where resources allow, surveys can be repeated periodically to monitor trends in the population. Sampling strategies are also an important aspect of cross-sectional population-based survey methods and might require input from national statistics office for their design and implementation. However, household surveys can also be prohibitively time and resource intensive. To address these issues, particularly for low resource settings, rapid survey methods (e.g. Rapid Assessment of Refractive Error, Rapid Assessment of Hearing Loss) have been developed which enable data to be collected in shorter time and lower cost.
Typically, data on AP use and/or need had been collected either as part of surveys of disability, specific impairments or conditions (e.g. eye health surveys), or general health (e.g., National Health and Nutrition Examination Survey), which makes comparison amongst studies challenging. These surveys may also be insufficiently powered to derive reliable estimates of some APs and the variation in approaches used to assess AP need (e.g. self-report and clinical impairment assessment; see ) further limits comparability. To address this gap, the WHO has developed the Rapid Assistive Technology Assessment (rATA) tool, a population-based structured questionnaire for rapid data collection on self-reported AP need/unmet need, demand, and use.
Case study: In 2018, an adaptation of the WHO Assistive Technology Assessment-Needs (ATA-N), a precursor to the rATA, was incorporated into the Bangladesh Rapid Assessment of Disability survey (RAD), in two districts with a subsample selected through a two-staged cluster random sampling process (Pryor et al., Citation2018). In the first stage, 60 clusters were selected in each of the two districts using a probability proportional to size procedure. In the second stage, approximately 15 households were randomly selected in each cluster using a systematic sampling approach. The survey was adapted for cultural relevance through workshops with key stakeholders before translation and refinement. The adapted ATA-N was administered to adult participants “at risk of disability” who identified functional disabilities, based on questions in the RAD from the Washington Group Short Set of Questions on Disability, which ask participants to self-report on level of difficulty in different functional domains (vision, hearing, mobility, cognition, self-care, communication) (Washington Group Short Set of Disability Questions, Citation2016). Age and sex matched controls without functional limitations were selected for comparison. The survey had a sample size of 4254, of which 31.9% reported at least some functional difficulty in at least one domain. The study generated estimates of self-reported AP use and unmet need, as well as components of demand including facilitators and barriers for AP use. A Logistic regression was used to assess the association between different socioeconomic factors, use, and unmet need of AP. Sampling weights and adjustments were used to control for survey design effect.
Key informant study
The key informant method (KIM) has been used in low-resource settings to generate population-level data on prevalence of specific impairments/health conditions and associated AP need. The KIM involves training volunteers (KIs, or “key informants”) to identify individuals in their communities with the outcome of interest to the study. This method also includes a clinical approach, as those identified are invited to attend screening camps for examination by a medical professional and a potential referral for appropriate services and AP, as available. KIM has been developed and validated for use as a cheaper and more rapid alternative to population-based surveys. KIM can be most relevant where the prevalence of the outcome of interest is relatively low, for example, mobility impairment among children, as this would require large population-survey sample sizes to provide reliable information and make meaningful interpretation from the data. Additionally, children with impairments may be hidden from view due to stigma and perceived shame, meaning that survey teams do not see and therefore do not register all possible children. KIs are more likely to be able to identify all children with impairments living in their community, given that they are trusted, long-term members of the same population. KIs engage with local communities and stakeholders and have an important capacity building and awareness raising role. As with cross-sectional surveys, KIMs have typically been used to estimate impairment prevalence and associated service needs, but to our knowledge have not been designed specifically to estimate AP. If it is only utilizing clinician assessed/impairment-based AP assessment, this method is subject to limitations associated with this approach (see ). KIMs may also miss individuals with mild or less visible impairments and therefore underestimate AP need. Further, studies have shown that not all of those identified by KIs in the community consequently attend the screening camps, which has further implications for the reliability and generalizability of prevalence estimates and AP indicators that inform supply and demand estimates.
Case Study: In a 2017 study, disability researchers trained KIs to identify and refer children with impairments in two rural districts of Malawi: Thyolo and Ntcheu (Tataryn et al., Citation2017). These districts are considered comparable to, or slightly above, the average of all rural districts in their respective regions in terms of key socio-economic metrics. KIs were trained in a one-day training workshop (conducted in groups of 20), covering: disability sensitization, identification of the specific impairments included in the study, methods for case finding, and procedures of the screening camps. KIs returned to their communities where, during a 3–6 week period, they identified children suspected to have one or more of the conditions included in the study. 15,000 children were identified and invited to a screening camp; 7220 (48%) attended and underwent assessment by medical professionals for moderate/severe hearing, vision, physical, and intellectual impairments, and epilepsy. Impairment prevalence was estimated. Based on the assessment of cause of impairment, the number who would benefit from APs including glasses, hearing aids, wheelchairs and prosthesis was recorded as well as physio/occupational therapy and refractive error services, approximating an unmet need and an expected demand for AP services. This study had a 52% drop-out rate between identification and screening camp attendance; this could be random or influenced by level of impairment, causing an over or underestimation of prevalence and potential to benefit from services. It is possible families did not agree with the KIs and perceive the child’s need for AP, or alternatively, individuals couldn’t access camps due to their lack of suitable AP in the first place. Functioning was not measured in the study, and no estimations for services relevant to APs were made apart from for vision and refractive index services. However, service needs could be implied from the hearing loss numbers and overall estimates for physical therapy service needs.
Longitudinal study
Conducting longitudinal cohort studies allows researchers to measure AP adoption, adherence, impact over time, as well as barriers to access and reasons for product abandonment, by collecting baseline and follow-up data on a cohort of participants. Each of these measurements inform both supply and demand, as they measure the individual’s need and want of a particular AP, while providing opportunities to address barriers to use at different stages. Consideration of how similar the cohort is to the population of interest will determine how representative and informative the study is on a larger scale. This study design method can be expensive, requiring ongoing funding over a length of time, particularly if researchers provide AP and essential services, and loss to follow up can impact results. When based around a specific setting or population (e.g. school based), follow-up may be easier, but the study population may not be representative of the general population. Also, participating in a longitudinal study may influence the participants’ health outcomes and awareness, progressively making their cohort less representative of the population of interest.
Case Study: The Shahroud Schoolchildren Eye Cohort Study collected its first-wave, baseline data on visual impairment (VI) amongst 5620 children, aged 6 to 12 years, in 2015 (Emamian et al., Citation2018). Investigators coordinated with schools to set up examination sites, where student participants underwent anthropometric and optometric exams, and glasses were given to those presenting need. Parents also responded to questionnaires that recorded medical history, insurance, and students’ daily activities. This round of examinations is repeated every 3 years for the cohort, until students age out at 18. This allowed investigators to report the prevalence of VIs, glasses use, newly-met need (glasses dispensed), associations with health and social factors, as well as how these results change with age. These measurements estimate the current level of need for AP and essential services and will inform reasons for disuse over time. This study’s findings will highlight the difference between need and demand and identify individual-level barriers to meeting the AP need, and the measurements generated can be used to appropriately scale supply chains within the country. Shahroud’s population is considered representative of Iran in terms of key sociodemographic averages reported in the 2016 National Population and Housing Census. The results from this cohort can be (with caution) generalized to represent the national school-age population at this point in time.
Using secondary data sources
Our findings suggest that secondary analysis of preexisting datasets can be beneficial for providing AP indicator estimates to inform supply/demand more quickly and at lower cost. Many studies in our review provided analyses of existing data, which typically included datasets from censuses, national health surveys, and global health repositories. This approach is governed by the availability of reliable, up-to-date data, and caution should be exercised when using preexisting datasets and deriving AP indicators from indirect sources (see ). Often many assumptions are made which should be explicitly stated to provide more detailed understanding of the data analysis and any limitations. If multiple survey datasets are used to generate composite estimates (e.g., global or regional estimates), it is important to acknowledge that these data are often not collected in a uniform way; sampling, examination methods, and AP indicator across surveys will be varied (Smith et al., Citation2019). While extrapolations can also be made to fill data gaps, caution should be applied given this method can be used among diverse groupings. In most cases, existing data infrastructure limits what level of analysis is possible.
Cross-sectional surveys
Large-scale household surveys, including censuses and national health surveys which collected data on APs, can provide nationally representative estimates of use and unmet need. These datasets can be used by analyzing a sub-sample of the surveyed population, based on responses to certain questions about disability or activity limitation in the original survey. This method allows more nuanced analyses that maximize the use of the original dataset. However, many existing national health surveys and censuses do not adequately capture AP indicators (Smith et al., Citation2019). In these cases, following up with the sub-sample can be useful to generate new data in a study that is quicker and lower cost, but still nationally representative, with the use of survey weights. Using data from censuses and national surveys which have integrated these questions provides access to population data which is not dependent on diagnosis or contact with a health system. Statistical models based on the sub-sample and previous census data can also be developed, which may be predictive of future need/demand, and permit evaluation of the relationship between AP use, unmet need, and demographic factors which are typically collected in a census (i.e. income, location, age, sex, level of education, employment status). Mandatory participation in census activities in some jurisdictions may reduce self-selection and response bias found in other studies. However, self-report is a major limitation; individuals who do not perceive themselves to have an activity limitation may not have responded. Responses are also limited to who is included in the census; often, institutionalized individuals, those living on reservations, and those active in a country’s military are not included. This limitation can have a larger impact when secondary analyses of these data intend to focus on vulnerable populations (e.g., AP use among older adults, many of whom may reside in care homes). Further, not all national surveys are comparable, as sample size, sampling strategies, and approach of assessing AP need can differ significantly.
Case study: The 2012 Canadian Survey on Disability (CSD) was a post-census cross-sectional representative sample survey conducted across Canada with persons who identified as having an activity limitation in the National Household Survey (NHS: 2011 Census)(Berardi et al., Citation2020). The total sample for the CSD was 45,443 individuals, with bootstrapping weights provided by Statistics Canada to provide population level estimates. The CSD included questions about over 70 different types of AT, related to impairments in mobility (gross and fine motor), hearing, seeing, and learning. The most recent study addressed the most commonly used (self-reported use) and needed (self-reported unmet need) for assistive technology in Canada. Where disability/functioning questions are integrated into national surveys, this sub-sampling method can be used to conduct an in-depth analysis and identify AP indicators informing supply and demand. Reasons for unmet need were also reported, highlighting barriers that can differentiate need from demand. This analysis benefitted from questions on disability being integrated in the population census; where possible, health and social demographic surveys should include standardized questions about activity limitation to data collection and comparability of AP indicators at the population-level.
Medical records
A retrospective analysis of clinical records of a population can also be used to assess AP adoption, adherence, follow-up, impact, and cost. Medical records can provide very detailed data. A retrospective cohort can also be designed with medical record data to study long-term effects of AP use and other health measurements. Within universal health care systems, it can be easier to get a representative sample of records to estimate AP indicators and/or the prevalence of related conditions. However, it is more often difficult to ensure a sample of records is representative; the coverage of a clinic participating in a study may be limited by its main practice domain, funding source/level, and capacity. It may also serve a population uniquely defined by residence or insurance, which can influence the frequency of referrals and follow-up. In more fragmented health care settings, there may not be a centralized health information management system and obtaining a representative sample of records may not be possible. Analyses of medical records are also subject to limitations of clinical diagnoses, including variations in definitions for impairments related to APs and referral practices.
Case study: A retrospective analysis of hospital record and cost data was conducted in 2004 (Vuorialho et al., Citation2004). Data were collected on the costs associated with assessment and fitting for hearing aids in two Finnish hospitals (a tertiary care and secondary care center, respectively,). The number of fittings and hearing aids provided were calculated as a proportion of inhabitants in the catchment area (number of fittings/1000 inhabitants and number of provided hearing aids/1000 inhabitants). Differences in these proportions were attributable to individuals who were assessed as requiring a hearing aid but chose not to be provided with one. The number of fittings/1000 population over age 65 and 75 respectively were also calculated. This provides an estimate of required hearing aids in each of the catchment areas and may be extrapolated to a population estimate. As hearing aids are provided through government/public insurance, it is highly likely that this is representative of the individuals who require hearing aids in each jurisdiction, as there is little private provision. The difference noted between those who were fitted and those who chose to be provided a hearing aid represents a measure of unmet need; as this is intentional nonuse of the AP, this may impact estimated demand.
Global population data
In the absence of censuses and national surveys, a rough estimate of prevalence and population growth can be used to ascertain the current and future potential need for an AP and contribute to supply chain planning. An average prevalence of the related impairment(s) can be multiplied by the projected population at a specific year, based on data provided by global repositories, to obtain the potential AP need. This method may be more effective for specific APs within functional domains with a higher documented population prevalence of and relevance to related impairments, such as distance glasses and uncorrected refractive error for vision, as opposed to the more complex multiple impairments related to mobility APs. However, utilizing these data to identify areas with high potential AP demand can also be the first step in planning a more in-depth assessment survey (Al-Tayar et al., Citation2019). This method can help suppliers and purchasers plan for robust AP supply chain infrastructure as populations age more rapidly. Only two types of data are required, which are generally either readily available (global population growth estimates) or can be generalized from similar populations if the target population has been under-researched (impairment prevalence among demographically similar populations). Historical trends can also be analyzed to strengthen projection reliability. Ultimately, caution should be applied when using this method given it equates impairment prevalence with AP need and is limited by a lack of information on existing coverage, under-met need and assumptions made when using an indirect source approach (see ). It is therefore most useful in contexts with extremely low AP coverage, where prevalence and AP need are the closest. A comprehensive estimate would also need to consider all impairments that would necessitate a particular AP; for example, if only limited to the projected prevalence of cerebral palsy, the total need for wheelchairs in a future population would be underestimated. Further, the likelihood of an individual with a particular impairment needing and wanting an associated AP would also refine the estimate significantly.
Case study: Holden et al’s 2008 study reports AP indicators for glasses resulting from population projections. These estimates are based on a group of population-based studies whose results were generalized to the world population and later extrapolated using projections (Holden et al., Citation2008). Their global estimates of vision impairment due to presbyopia collated the findings of a systematic review spanning 20 years, population projections of the US Census Bureau’s International Data Base, and economic development classifications of the UN Department of Economics and Social Affairs. With these data, this study calculated the prevalence of functional presbyopia, spectacle coverage rate, un- and under-corrected visual impairment, and disability caused by this condition in 2005, 2010, 2020 and 2050. These results estimate the global coverage, unmet, and under-met need for certain visual APs at each point in time, informing where there is inadequate supply and expected demand. In projecting, assumptions were inevitably made about the behavior of demand and supply levels over time, despite the changes that sociodemographic development are expected to cause. Extrapolating study findings to other populations based on ethnicity, location, climate, and level of development are further assumptions that weaken this study’s estimates. The strict screening criteria also resulted in an evidence base of only six studies that still allowed for variations in measurements; study comparability was assumed when combining and extrapolating from these different datasets.
Analysis methods of primary and secondary data
Analysis methods used across each data collection method can derive AP indicators and contribute to supply and demand estimation. Many studies in our findings use regression techniques to extrapolate data, test associations, and identify sociodemographic factors that can predict AP indicators. Datasets can be combined and previously unpublished data can also be used in regression analyses (Flaxman et al., Citation2017). It is important to better understand how analysis methods can be utilized to provide population-level estimates for AP supply and demand.
Regression techniques
Identifying sociodemographic factors associated with AP indicators through regression can predict AP needs for a population and help to plan supply chains. Logistic regression tests the association of AP indicators with personal and sociodemographic factors (SFs) recorded in a study, like anthropometrics, education, unemployment, residence, gender, or age. Linear regression can also be used in some instances to extrapolate data where it is missing (e.g., among unsurveyed age groups or populations) (Delcourt et al., Citation2018). To further examine resulting associations as reliable predictors of AP estimates, a path analysis could also be conducted. This form of multiple regression evaluates causal models and requires substantial, highly detailed data. These techniques may therefore be most reliable when measuring vision and hearing AP indicators, where more population-level studies have been done. There is potential to conduct these analyses and extrapolate results to similar populations in data-poor settings, provided appropriately representative research has been done elsewhere, though results from this process would be weakened by many assumptions.
Case study: In 2018, United States researchers used data from the first round of the National Health and Aging Trends Study (NHATS, 2011) to identify SFs predicting AP use among Medicare beneficiaries aged 65 or older (Frochen & Mehdizadeh, Citation2018). Based on self-reported responses to AP use questions, researchers created a scale measure of AP use from 0 (never use) to 6 (always use) averaged across multiple APs and tested the correlation of high use with numerous SFs. A path analysis was then conducted amongst those factors demonstrating significant correlation: age, sex, living arrangement, and income. This method allowed researchers to determine whether these SFs could predict device use, while controlling for the effect of the individual’s disability score. Income was shown to have no effect, but females and those living alone were more likely to use devices. Statistical testing showed the resulting model fit well, and representativeness was established by comparing the demographics of the NHATS participants included in this analysis with recent American Community Survey data. This methodology could be used to approximate demand for APs in a population, based on how SFs influence successful device adoption and use. These results can be projected for aging populations to plan appropriate supply chain infrastructure, provided sociodemographic data are available. A secondary analysis is only as good as its data source, and in this case, limitations of self-report, including respondents using only one type of insurance, and reducing functioning to a numeric scale from 0 to 6 lower the generalizability and reliability of the outcome.
Gaps in research
Our findings have characterized the contexts (geographies, age groups, functional domains, and publication dates) and identified the components (approaches and methods) of population-based AP research, allowing us to describe their most effective use scenarios. In this process, the following practical and conceptual gaps in this body of evidence have emerged.
As identified in , wheelchairs, prosthetics, and accessible software (limited in this review to personal digital assistants and smartphones) are underrepresented in the literature; 76% of the studies identified in this review focused exclusively on vision and hearing. A range of conditions and pathologies can be associated with the use of mobility and accessible software devices; often these are under-researched and rarely provide related AP estimates in population-based studies compared to vision and hearing impairment prevalence studies. Specifically, mobility impairment assessment is complex with less standardized AP assessments compared to hearing and vision (Boggs et al., Citation2019). Additionally, the prevalence of need for wheelchairs and prosthetics is low according to estimates in limited studies. For example, wheelchair prevalence estimates from Canada and the United States were between 0.6% and 0.8%, while estimates from Cameroon and India were 0.1% (Berardi et al., Citation2020; Boggs et al., Citation2019). This lower prevalence may have led researchers to use more individual-level clinic-based study designs rather than large-scale population surveys given the large sample size required.
Further, our findings suggest that accessible software historically has not been a type of AP that is prioritized in population-based studies. This could be due to more recent advances in and affordability and accessibility of technology over the past twenty years making personal digital assistants a “newer” AP; however, the lack of population-based research limits the conclusions we can draw. Measuring PDAs and other digital APs is complex given inconsistencies in the umbrella term that is used, how it is defined, and given digital APs cross multiple functional domains. For example, mobile device applications, such as digital magnifiers, gesture to voice and memory aid apps, can improve functioning across vision, hearing, communication, and cognition, respectively. Digital APs are also relevant for individuals without functional difficulties, which complicates researching APs by adding difficulty to defining what is and is not an AP; depending on the individual and the context, the same products can be both. There are also barriers to awareness, access and use of accessible software that must be acknowledged, especially in resource-limited settings. Addressing these challenges when seeking population-level AP estimates for wheelchairs, prosthetics and accessible software deserves further attention.
Essential AP services, such as rehabilitation and prosthetic and orthotic services, are not measured in all studies with AP estimates; in the articles we reviewed, 31% (n = 154) mentioned any type of services in their abstracts. Services referred to in the articles include physical and occupational therapy sessions, AP fittings, impairment screenings, checkups, and AP replacement provision. Services are essential for both supply-related provision with distribution, support and human resources, and demand-related provision including initial assessment, training and education and then follow-up over time with ongoing reassessment, retraining, reeducation, and maintenance of APs. Therefore, determining the “annual demand” for essential AP services requires both the assessment of population-based need, which could be determined in many population-level studies alongside AP need, as well as follow-up and close monitoring of service providers which is not typically within the remit of most population-based studies. As a result of this highlighted gap, we have written our working definitions for supply and demand to include a measure of essential services. Measurements of APs and services (together referred to as Assistive Technology) should be considered by all future population-based studies, wherever possible, because an estimate of AP supply or demand is misleading without it.
In our findings, only 2% (n = 9) of the studies included a measure of supply. There is significantly more information on demand measurement and evaluation than supply. This discrepancy is reflected in relevant data collection, and subsequently, data are more available to construct a demand estimate based on other AP indicators. Supply data is lacking, especially considering there is not a consensus on which supply-side operations data should be used to measure supply chains. One record details the AT-Info-Map, an app created to map AP and service providers in multiple African countries (Visagie et al., Citation2019). While this software has proven informative to AP users and networking market-shapers, supply-side data and AP indicators are not recorded. Further, a comprehensive view of all AP sources is not provided, as many users do not get their APs from suppliers (Visagie et al., Citation2019). A few pilot studies identified in our body of literature do consider the “distribution” or “provision” for specific APs as an outcome measure, but analyses are limited to the number of APs given to or prescribed from a clinic, or provided under a specific policy/financing scheme (Gupta et al., Citation2019; Hlayisi & Ramma, Citation2019). Alternatively, data on AP tariffs and trade flows can illustrate market concentration and high-level determinants of AP quality, affordability and availability, yet do not capture the user experience (Ramos & Battistella, Citation2019). With only one type of these data, the whole supply chain cannot be evaluated and bottlenecks limiting AP access cannot be identified. One study examines the ICF as a guide for coding important data in the process of AP provision; however, this strategy only provides standard data collection methods for the advisory and selection stages and does not cover AP delivery and use (Heerkens et al., Citation2011). There is a need for a standard protocol/guide to identify which study design methods and approaches are the most suitable for a wide variety of contextual and research needs, as well as agreed-upon indicators and definitions, to generate comparable AP supply data. Market-shaping initiatives supported by WHO GATE, AT2030, and ATscale are underway to improve both demand and supply data. The collaborative Product Narratives, for example, have been developed to categorize APs and services so there are common definitions for the data collected and indicators estimated (ATscale & AT2030, Citation2020).
Learning from related sectors
Additionally, as the AP sector progresses, there may be important lessons to learn from the supply chain strategies for pharmaceuticals and essential medical devices (EMDs). For example, the collection of standardized pharmaceutical and EMD supply data is facilitated by a common understanding through reaching agreement on definitions for key terms and processes, as described below (MacDonald, Citation2010).
Measuring supply: Supply is evaluated as the proportion of health care centers and other distributors that had stock-outs for specific products, and where users reported fees constrained access. It is recommended that, for high-demand/previously unsupplied areas, a minimum required service level must be defined and maintained to prevent shortages (Roshan et al., Citation2019).
Generating data: These evaluations necessitate recording stock and inventory levels at manufacturers and distribution centers; shipment quantities; establishment, transport, and inventory costs; and the maximum permissible unmet demand in a population (Zahiri et al., Citation2018).
Design: Designing products for challenging environments may lead to an increased demand among an underserved population, which can mean increased attention from donors (Jonathan & Stoltenberg, Citation2012).
Manufacturing: When the production process is flexible and integrated into supply chains, manufacturers can meet unique needs more effectively (Roshan et al., Citation2019).
Measuring progress: The UN Commission on Life-Saving Commodities recommends several strategies to accelerate the Millennium Development Goals. These include global and delivery market shaping; regulatory efficiency; supply and awareness; and demand and awareness. Situational analyses are conducted to measure progress in these areas. These analyses review national strategic plans, essential medicine/device lists, and training materials. They maximize the use of existing datasets like compiled aggregated measurements from nationally representative health facility assessments, health and logistics management information systems, and population-based survey data. They can identify National-level and facility-level bottlenecks that hinder product delivery (Jonathan & Stoltenberg, Citation2012).
Limitations
Traditionally, scoping review searches are less comprehensive and may miss relevant resources, as they aim to capture the most relevant records, as opposed to all that are available. Due to their reliance on authors’ preexisting knowledge, they can be considered more subjective than systematic reviews (Munn et al., Citation2018). While this scoping review is unique in that it benefitted from a broad systematic search and abstract review process, it was limited by the large number of results which prevented the timely review and quality assessment of all full texts. Though the full texts are reviewed in the separately published systematic review, with all data including AP indicators extracted, only high-level information from abstracts was extracted for this scoping review. As such, there may be studies in our body of literature that might not meet our full inclusion/exclusion criteria. Approximately, thirty full texts were reviewed for the case studies.
Information from the AP market-shaper stakeholders who were contacted also contributed to our findings, but our reach is limited; our 109 inquiries received 42 total responses for a response rate of less than 50%. The majority of respondents are NGO employees and smaller-scale AP producers, who provided expert understanding of the AP marketplace, however, high-volume manufacturers and purchasers are underrepresented among all of those who responded to our inquiry.
Our research is also limited overall by how infrequently the specific terms “supply” and “demand” appear in population-based studies. It is difficult to draw conclusions and report associations when the sample of papers specifically mentioning supply or demand is so small, and our understanding is based on the assumptions made when using proxy AP indicators that inform supply and demand estimates, rather than existing supply and demand estimates themselves.
Finally, we limited the scope of this review to ATScale’s five priority APs to keep our search manageable with the aim to capture the most commonly represented priority APs in population-level studies. However, given this narrow focus, we acknowledge that there are limits to the generalizability of our findings to characterize the overall AT market and relevant research; this body of research is extremely diverse and consists of hundreds of APs with unique supply chain infrastructures and market demands.
Research recommendations
Future research using AP indicators to inform supply and demand must be comparable to provide comprehensive estimates for AP marketplaces. Consistent AP indicator definitions and a thorough understanding of AP assessment approaches and study methods will improve supply and demand data, which could ultimately inform investments and innovations for AP market-shapers. The following recommendations from our findings should be used in future research, wherever possible:
Standardized definitions for AP indicators should be used to enable the comparison of results across settings. Some measurements are only appropriate for data-poor settings, like potential need. When possible, the most relevant and comprehensive measurements should be reported.
For AP assessment approaches, agreed methods for measuring common indicators should be used when possible, to collect more systematic and comparable data on impairment, functioning, and AP indicators across the six functional domains. Specifically, rapid assessment tools should be reviewed to ensure AP indicators are well-integrated as viable timely options for improving AP data collection.
Use AP study design and analysis methods in contexts where they will be most effective and be aware of study design limitations when interpreting research.
An indicator of essential AP services should also be included in research generating AP indicators, as the absence of these services will impact AP use, demand, and ultimately influence supply decisions. AP indicators will be more comprehensive where the need and coverage of their associated services are also evaluated.
Data generated in the AP supply process should be well-defined and collected at each stage to standardize supply chain evaluation and facilitate the identification of bottlenecks that limit AP accessibility on the supply-side.
Acknowledgements
We sincerely thank all AP market-shapers who responded to our research inquiry and provided information on their strategies for measuring supply and demand, which helped us identify the most relevant case studies in our body of literature.
References
- Albala, S., Holloway, C., MacLachlan, M., Banes, D., Bandukda, R., Walker, J., Austin, V., Kattel, R., & Mazzucato, M. (2019). Capturing and creating value in the assistive technologies landscape through a mission-oriented approach: A new research and policy agenda. AT2030 Working Paper Series (1). https://at2030.org/static/at2030_core/outputs/AT2030_Working_Paper_01_Albala_Value_STYLE-2_hvrWuzJ.pdf
- Al-Tayar, R., Humbert, T., Pietro, L. D., Guo, A., Zhang, W., Tebbutt, E., & Mishra, S. (2019). A rapid assessment on access to assistive technology in the World Health Organization’s European region. In N. A. Layton & J. Borg (Eds.), Global perspectives on assistive technology: Proceedings of the GReAT consultation (pp. 5–23). World Health Organization.
- ATscale, & AT2030. (2020). Product narratives. https://atscale2030.org/product-narratives
- Berardi, A., Smith, E. M., & Miller, W. C. (2020). Assistive technology use and unmet need in Canada. Disability and Rehabilitation: Assistive Technology. https://doi.org/https://doi.org/10.1080/17483107.2020.1741703
- Boggs, D., Kuper, H., Mactaggart, I., Murphy, G., Oye, J., & Polack, S. (2019). Estimating assistive technology need through population-based surveys: An analysis of data from Cameroon and India. In N. Layton & J. Borg (Eds.), Global perspectives on assistive technology: Proceedings of the GReAT consultation (pp. 52–78). World Health Organization.
- Cornman, J. C., & Freedman, V. A. (2008). Racial and ethnic disparities in mobility device use in late life. Journals of Gerontology. Series B, Psychological Sciences and Social Sciences, 63(1), S34–S41. https://doi.org/https://doi.org/10.1093/geronb/63.1.S34
- de Witte, L., Steel, E., Gupta, S., Ramos, V. D., Roentgen, U., Delgado Ramos, V., & Roentgen, U. (2018). Assistive technology provision: Towards an international framework for assuring availability and accessibility of affordable high-quality assistive technology. Disability and Rehabilitation: Assistive Technology, 13(5), 467–472. https://doi.org/https://doi.org/10.1080/17483107.2018.1470264
- Delcourt, C., Le Goff, M., von Hanno, T., Mirshahi, A., Khawaja, A. P., Verhoeven, V. J. M., Hogg, R. E., Anastosopoulos, E., Cachulo, M. L., Höhn, R., Wolfram, C., Bron, A., Miotto, S., Carrière, I., Colijn, J. M., Buitendijk, G. H. S., Evans, J., Nitsch, D., Founti, P., & Zerbib, J. (2018). The decreasing prevalence of nonrefractive visual impairment in older europeans: A meta-analysis of published and unpublished data. Ophthalmology, 125(8), 1149–1159. https://doi.org/https://doi.org/10.1016/j.ophtha.2018.02.005
- Duke, R., Otong, E., Iso, M., Okorie, U., Ekwe, A., Courtright, P., & Lewallen, S. (2013). Using key informants to estimate prevalence of severe visual impairment and blindness in children in Cross River State, Nigeria. Journal of American Association for Pediatric Ophthalmology and Strabismus, 17(4), 381–384. https://doi.org/https://doi.org/10.1016/j.jaapos.2013.05.004
- Emamian, M. H., Hashemi, H., Khabazkhoob, M., Malihi, S., & Fotouhi, A. (2018). Cohort profile: Shahroud schoolchildren Eye Cohort Study (SSCECS). International Journal of Epidemiology, 48(1), 27–27F. https://doi.org/https://doi.org/10.1093/ije/dyy250
- Flaxman, S. R., Bourne, R. R. A., Resnikoff, S., Ackland, P., Braithwaite, T., Cicinelli, M. V., Das, A., Jonas, J. B., Keeffe, J., Kempen, J. H., Leasher, J., Limburg, H., Naidoo, K., Pesudovs, K., Silvester, A., Stevens, G. A., Tahhan, N., Wong, T. Y., Zheng, Y., Bourne, R., & Zheng, Y. (2017). Global causes of blindness and distance vision impairment 1990-2020: A systematic review and meta-analysis. The Lancet Global Health, 5(12), e1221–e1234. https://doi.org/http://dx.doi.org/10.1016/S2214-109X%2817%2930393-5
- Frochen, S., & Mehdizadeh, S. (2018). Functional status and adaptation: Measuring activities of daily living and device use in the national health and aging trends study. Journal of Aging and Health, 30(7), 1136–1155. https://doi.org/https://doi.org/10.1177/0898264317707299
- Frost, A., Wilkinson, M., Boyle, P., Patel, P., & Sullivan, R. An assessment of the barriers to accessing the Basic Package of Health Services (BPHS) in Afghanistan: Was the BPHS a success? (2016). Globalization and Health, 12(1), 1–11. BioMed Central Ltd. https://doi.org/https://doi.org/10.1186/s12992-016-0212-6
- Gupta, V., Saxena, R., Vashist, P., Bhardwaj, A., Pandey, R. M., Tandon, R., & Menon, V. (2019). Spectacle coverage among urban schoolchildren with refractive error provided subsidized spectacles in North India. Optometry and Vision Science, 96(4), 301–308. https://doi.org/https://doi.org/10.1097/OPX.0000000000001356
- Harkins, C. S., McGarry, A., & Buis, A. (2013). Provision of prosthetic and orthotic services in low-income countries: A review of the literature. Prosthetics and Orthotics International, 37(5), 353–361. https://doi.org/https://doi.org/10.1177/0309364612470963
- Heerkens, Y., Bougie, T., & Claus, E. (2011). The use of the ICF in the process of supplying assistive products: Discussion paper based on the experience using a general Dutch prescription guideline. Prosthetics and Orthotics International, 35(3), 310–317. http://ovidsp.ovid.com/ovidweb.cgi?T=JS&PAGE=reference&D=emed12&NEWS=N&AN=363114616
- Hlayisi, V. G., & Ramma, L. (2019). Rehabilitation for disabling hearing loss: Evaluating the need relative to provision of hearing aids in the public health care system. Disability and Rehabilitation, 41(22), 2704–2707. https://doi.org/https://doi.org/10.1080/09638288.2018.1473507
- Holden, B. A., Fricke, T. R., Ho, S. M., Wong, R., Schlenther, G., Cronjé, S., Burnett, A., Papas, E., Naidoo, K. S., & Frick, K. D. (2008). Global vision impairment due to uncorrected presbyopia. Archives of Ophthalmology, 126(12), 1731–1739. https://doi.org/https://doi.org/10.1001/archopht.126.12.1731
- Jonathan, G. E., & Stoltenberg, J. (2012). UN commission on life-saving commodities for women and children: Commissioners’ Report 2012. http://www.everywomaneverychild.org/images/UN_Commission_Report_September_2012_Final.pdf
- Layton, N., & Borg, J. (2019). Global perspectives on assistive technology. In N. Layton & J. Borg (Eds.), Proceedings of the GReAT Consultation 2019 (pp. 1–531). World Health Organization. https://apps.who.int/iris/handle/10665/330372
- MacDonald, R. (2010). Medical devices: Managing the mismatch an outcome of the priority medical devices project. (R. MacDonald & D. Wickware (eds.)). World Health Organization.
- Matter, R., Harniss, M., Oderud, T., Borg, J., & Eide, A. H. (2017). Assistive technology in resource-limited environments: A scoping review. Disability and Rehabilitation: Assistive Technology, 12(2), 105–114. https://doi.org/https://doi.org/10.1080/17483107.2016.1188170
- Moher, D., Shamseer, L., Clarke, M., Ghersi, D., Liberati, A., Petticrew, M., Shekelle, P., Stewart, L. A., Estarli, M., Barrera, E. S. A., Martínez-Rodríguez, R., Baladia, E., Agüero, S. D., Camacho, S., Buhring, K., Herrero-López, A., Gil-González, D. M., Altman, D. G., Booth, A., & Whitlock, E. (2016). Preferred reporting items for systematic review and meta-analysis protocols (PRISMA-P) 2015 statement. Revista Espanola de Nutricion Humana y Dietetica, 20(2), 148–160. https://doi.org/https://doi.org/10.1186/2046-4053-4-1
- Munn, Z., Peters, M. D. J., Stern, C., Tufanaru, C., McArthur, A., & Aromataris, E. (2018). Systematic review or scoping review? Guidance for authors when choosing between a systematic or scoping review approach. BMC Medical Research Methodology, 18(1), 143. https://doi.org/https://doi.org/10.1186/s12874-018-0611-x
- Pryor, W., Nguyen, L., Islam, Q. N., Jalal, F. A., & Marella, M. (2018). Unmet needs and use of assistive products in two districts of Bangladesh: Findings from a household survey. International Journal of Environmental Research and Public Health, 15(12), 1–13. https://doi.org/https://doi.org/10.3390/ijerph15122901
- Ramos, V. D., & Battistella, L. R. (2019). Assistive products’ international trade and tariffs. In N. Layton & J. Bort (Eds.), Global perspectives on assistive technology proceedings of the GReAT consultation 2019 (pp. 449–461). WHO. https://apps.who.int/iris/bitstream/handle/10665/330371/9789241516853-eng.pdf#page=458
- Roshan, M., Tavakkoli-Moghaddam, R., & Rahimi, Y. (2019). A two-stage approach to agile pharmaceutical supply chain management with product substitutability in crises. Computers and Chemical Engineering, 127, 200–217. https://doi.org/https://doi.org/10.1016/j.compchemeng.2019.05.014
- Smith, E. M., Battistella, L. R., Contepomi, S., Gowran, R., Kankipati, P., Layton, N., MacDonald, R., Nleya, C., Delgado Ramos, V., Rios Rincon, A., & Toro-Hernandez, M. L. (2019). Measuring met and unmet assistive technology needs at the national level: Comparing national database collection tools across eight case countries. In N. Layton & J. Borg (Eds.), Global perspectives on assistive technology: Proceedings of the GReAT Consultation (pp. 24–35). World Health Organization.
- Tataryn, M., Polack, S., Chokotho, L., Mulwafu, W., Kayange, P., Banks, L. M., Noe, C., Lavy, C., & Kuper, H. (2017). Childhood disability in Malawi: A population based assessment using the key informant method. BMC Pediatrics, 17(1), 198. https://doi.org/http://dx.doi.org/10.1186/s12887-017-0948-z
- Visagie, S., Matter, R., Kayange, G., Chiwaula, M., Harniss, M., & Kahonde, C. (2019). Perspectives on a mobile application that maps assistive technology resources in Africa. African Journal of Disability, 8(5), 1–9. https://doi.org/https://doi.org/10.4102/ajod.v8i0.567
- Vuorialho, A., Sorri, M., & Nuojua, I. (2004). Costs of hearing aid rehabilitation in two finnish hearing centres. Audiological Medicine, 2(4), 236–240. https://doi.org/https://doi.org/10.1080/16513860410000393
- Washington Group on Disability Statistics. (2016). The Washington group short set of questions on disability. http://www.washingtongroup-disability.com/wp-content/uploads/2016/01/The-Washington-Group-Short-Set-of-Questions-on-Disability.pdf
- WHO. (2011). Health systems strengthening glossary. World Health Organization. https://www.who.int/healthsystems/Glossary_January2011.pdf
- WHO. (2016). Priority assistive products list (APL). https://www.who.int/phi/implementation/assistive_technology/global_survey-apl/en/%0Ahttps://www.who.int/news-room/feature-stories/detail/priority-assistive-products-list-(apl)
- WHO. (2017). WHO regional groupings. World Health Statistics. https://www.who.int/about/who-we-are/regional-offices
- Zahiri, B., Jula, P., & Tavakkoli-Moghaddam, R. (2018). Design of a pharmaceutical supply chain network under uncertainty considering perishability and substitutability of products. Information Sciences, 423, 257–283. https://doi.org/https://doi.org/10.1016/J.INS.2017.09.046