
 ?Mathematical formulae have been encoded as MathML and are displayed in this HTML version using MathJax in order to improve their display. Uncheck the box to turn MathJax off. This feature requires Javascript. Click on a formula to zoom.
Abstract
The initial running-in cycles alter the surface integrity characteristics and influence gear performance. This article shows how the surface characteristics of honed spur gears evolved due to the combined effect of running-in load (0.9 or 1.7 GPa) and speed (0.5 or 8.3 m/s) in Forschungsstelle fur Zahnräder und Getriebebau tests. Running-in affected the surface layers to a depth of 5 µm. High running-in load promoted plastic deformation of asperities, created microstructural changes associated with surface cracks, and relaxed residual stresses. It also enhanced the amount of phosphorous from extreme pressure (EP) additives at the surface. The surface contact fatigue failure—that is, micropitting—was promoted by running-in speed rather than load.
Introduction
The demand for gear drive performance is high in terms of durability, efficiency, and load-carrying capacity. The surface integrity characteristics such as topography, residual stresses, and material structure generated by hard finishing determine the performance of transmission gears. For example, Tönshoff and Marzenel (Citation1) produced three set of gears with different roughness and residual stress states by varying gear honing parameters. Pitting tests on these gears showed different lifetimes. In addition to manufacturing, the operating conditions during initial cycles—that is, running-in—further govern the performance of gears by altering the initial surface characteristics.
In general, the torque is initially carried by a small fraction of asperities. This leads to stress concentrations over a narrow region and, depending on the operating conditions used, numerous micropits can initiate at the asperity level. Investigations by Ariura, et al. (Citation2) revealed that micropitting, or grey staining, causes profile degradation. Therefore, further smoothening of asperities is required for better conformability but preferably in a way that avoids the formation of micropits. The real contact area of gears manufactured by different methods such as green shaving, grinding, and honing increases with running-in (Sjöberg, et al. (Citation3)). Andersson (Citation4) observed that running-in decreased the roughness of both hobbed and shaved gears. However, the decrease was higher for hobbed gears due to their rougher initial surface.
Running-in changes the surface topography of virgin surfaces by plastic deformation and wear (Ismail, et al. (Citation5)). The surface modification created by running-in attains a steady-state condition between contact pressure, surface roughness, and interface layer and also helps to establish an effective lubricating film at the interface (Hsu, et al. (Citation6)). Kragelsky, et al. (Citation7) reported that the effectiveness of running-in in deforming the asperities is influenced by factors such as load, speed, physical properties of the material, and lubrication medium. Sjöberg, et al. (Citation8) found that the efficiency of ground gears was enhanced by high running-in load, but these gears also had more micropits and subsurface cracks, as shown by Mallipeddi, et al. (Citation9).
The importance of the running-in process is clearly emphasized in the literature. However, most studies focus on specific phenomena; for example, roughness, residual stresses, or friction. Though these factors are affected as a consequence of deformation mechanisms, changes in material structure, and surface chemistry, no study of the combined changes induced by different running-in parameters was found. As a forward step, this research work focuses on the effect of running-in load and speed combinations on the surface integrity characteristics of honed gears. Different techniques were used to examine topography, residual stresses, microstructure development, and evolution of surface chemistry. This article will show how some changes are promoted primarily by load and others by speed.
Material and experiment procedure
Materials, manufacturing, and gears
The tested spur gears of alloy 16MnCr5 were case hardened, tempered, and hard finished first by generating grinding and then by a honing process. The case depth was about 1 mm with a surface hardness of about 750 HV. The gear geometry was similar to that of standard Forschungsstelle fur Zahnräder und Getriebebau (FZG) C-Pt gears (Höhn, et al. (Citation10)) with a few modifications; the tip reliefs Ca1 and Ca2 were both 20 µm and the helix angle modifications Hβ1 and Hβ2 were about 6 µm (equal to a helix angle of 0.0327°). The nominal geometrical parameters of the tested gears are presented in .
Table 1. Geometrical parameters of tested gears.
Test rig and running-in testing
The running-in tests were performed using an FZG back-to-back test rig (Sjöberg, et al. (Citation8)). It is important to note that a new pair of gears was used in each test and all analyses were performed on the driven gear wheel.
The running-in cycles were 20,880 revolutions of the wheel, which is standard for an Forschungs Vereinigung Antriebstechnik efficiency test procedure (Group F-R (Citation11)). The testing combined two different torques (94 and 302 Nm corresponding to Hertzian pressures at pitches of 0.9 and 1.7 GPa, respectively) and at low speed (LS) and high speed (HS; 0.5 and 8.3 m/s corresponding to 87 and 1,444 rpm). The torques are referred as load stage 5 (LS5) and load stage 9 (LS9) in FZG testing. The gears were fully dipped in a synthetic poly-alpha olefin lubricant with a density of 837 kg/m3 and nominal viscosity of 11.8 cSt at 100 °C. The lubricant temperature during testing was maintained at 90 °C. A detailed test matrix with the designation of individual tests is presented in , where, for example, RI5-LS designates running-in at load stage 5 at low speed.
Table 2. Detailed test matrix with designations.
Characterization methods
Gear teeth for all analyses were mechanically cut from the wheel using an abrasive disc for metallographic sample preparation.
The surface roughness was characterized by a Form Talysurf PGI 800 (Taylor Hobson) profilometer using 0.15-µm styli tip. Starting from the center of the face width of a gear tooth, three profiles were taken 0.1 mm apart. Two randomly selected teeth were measured for every condition. A measurement length of 6 mm was used for each profile measurement. To separate the form from waviness and roughness, a polynomial of order six was used. Thereafter, a Gaussian filter with a cutoff length of 0.8 mm was employed to separate the waviness from roughness.
The measured roughness was used to calculate the specific film thickness (λ), which is the ratio between the minimum film thickness and the composite roughness as defined by Gohar (Citation12):
[1]
[1]
where Rq1 and Rq2 are the root mean square roughness parameters of the pinion and gear and hmin is the minimum film thickness as detailed in Andersson, et al. (Citation13).
The surface topography and microstructure of the gear teeth were characterized using a scanning electron microscope operated at 5 kV. Secondary electrons were used for imaging both surface topography and microstructure.
Residual stresses were measured by means of X-ray diffraction using a Cr-Kα source. The lattice deformation for the {211} α-Fe peak was measured and stress values were determined using a standard sin2 (ψ) technique (Fitzpatrick, et al. (Citation14)) with five equi-sin2 (ψ) tilts from −45/+45°. Stepwise etching electrochemically using 3 M NaCl was used for depth profiling. For retained austenite measurements, the diffraction planes {200}ϒ, {220}ϒ and {200}α, {211}α were analyzed. The X-rays were irradiated through a circular 3-mm collimator and exposed for about 40 s with an inclination of +45° and scanning ±85° with 15 steps.
The tribolayers were analyzed by X-ray photoelectron spectroscopy (XPS) with a monochromatic Al Kα (1,486.6 eV) source on an analysis area ∼0.8 mm in diameter. For depth profiles, Ar+ etching was used with rates as calibrated on Ta2O5. The gear teeth were cleaned in an ultrasonic bath for 5 min each with xylene and ethanol.
Results and discussion
Surface roughness and topography
The surface roughness parameters of an as-honed gear and after different running-in conditions are presented in . The roughness changes were characterized based on the amplitude parameters Ra, Rz, and Abbott-Firestone parameter Rpk. Rq is used to calculate the specific film thickness. Overall, slightly smoother surfaces were measured after running-in.
Table 3. Surface parameters for different conditions.
However, the differences in surface deformation between running-in conditions observed by scanning electron microscopy were not clearly reflected in the roughness parameters. This can be attributed to the inherent limitation of profilometry to only measure roughness normal to the contact between the stylus and the surface on a single profile. Hence, detailed topographic examination by scanning electron microscopy is vital to understand the deformation and evolution of gear surfaces. In addition, an added advantage is the possibility of mapping the gear surface along the axial direction.
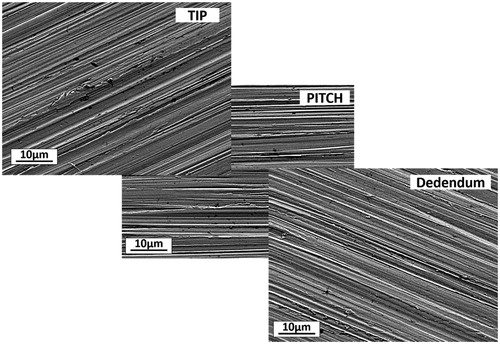
The surface topography of as-honed gears is shown in . The surface lay orientation is different between regions of the gear flank. At pitch, the lay is perpendicular to the profile direction, like that of a ground gear. At both the tip and dedendum, the lay is oriented at an angle with respect to the pitch surface but with orientations in opposite directions. This is because the honing tool motion is cross-axed to the gear surface. Irrespective of orientation, the surface lay consists of adjacent peaks and valleys with irregular asperities. These surface microfeatures determine the contact area during the initial cycles.
Figure 1. Surface topography of as-honed gear.
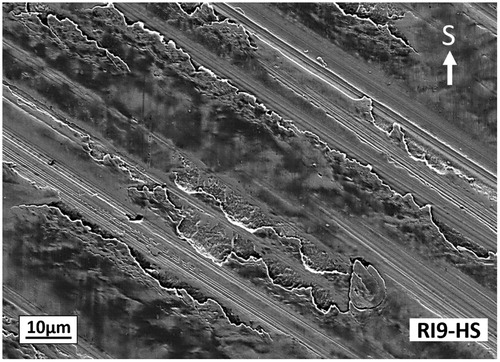
The topography for different running-in conditions at the dedendum close to the end of the active profile is shown in . The micrographs reveal that surface asperities are plastically deformed for all test conditions. The deformation was influenced more by load than speed so that a higher load resulted in greater deformation. Moreover, micropits occurred after running-in for all test conditions. Thus, micropitting initiates in less than 20,880 cycles. Similar results were reported by Locateli, et al. (Citation15). The most extensive micropitting occurred for RI9-HS, followed by RI5-HS, RI9-LS, and RI5-LS. This indicates that micropitting was influenced more by speed than load. Where the lay is oriented at an angle to the sliding, micropits formed along the lay and in a direction opposite to the sliding, in accordance with Errichello (Citation16)). The morphology of micropitting is clearly illustrated at high magnification in .
Figure 2. Surface topography of dedendum surfaces (close to the end of the active profile) after testing at different running-in conditions. “S” in the micrographs indicates the sliding direction.
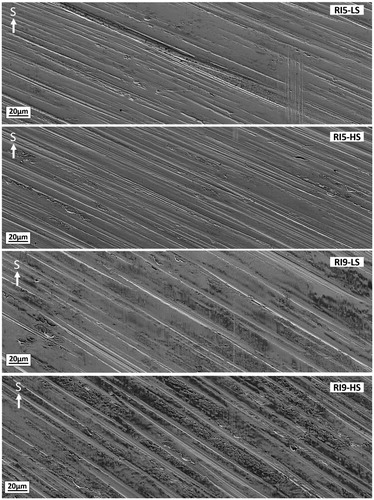
Figure 3. Morphology of micropitting. “S” in the micrographs indicates the sliding direction.
Irrespective of load, the calculated λ values were higher for high speed conditions RI5-HS and RI9-HS compared to those at low speed conditions RI5-LS and RI9-LS; see . This indicates a better separation between mating gear pairs when run at high speed. Still, a smoother surface was obtained for high load and low speed (RI9-LS), whereas a large number of micropits was observed for high load and high speed (RI9-HS). Li and Kahraman (Citation17) also reported that running-in with high contact pressure and lower rolling velocity reduced the number of micropits for case-hardened ground twin disks. Potential reasons for this behavior were gradual surface polishing and the formation of a tribofilm with lower boundary friction that reduces the surface shear. It is reasonable that a smoother surface provides lower friction. However, analyses of the tribofilm did not indicate a major difference in tribofilm formation with load between RI9-LS and RI9-HS or RI5-LS and RI5-HS in this study.
Table 4. Specific film thickness values for different running-in conditions.Table Footnotea
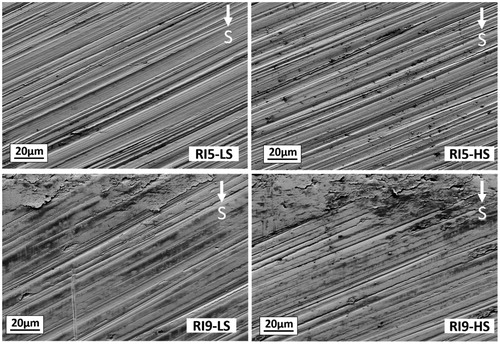
The topography of the tip surfaces is shown in . It is evident from the micrographs that the deformation pattern is different from that of dedendum surfaces. For low load conditions, irrespective of speed, the deformation of asperities is limited, and the topography resembles that of the as-honed condition. On the other hand, asperities were deformed plastically and micropits appeared for high load conditions. Though it is hard to quantify, more micropits were present in combination with high speed.
Figure 4. Surface topography close to the tooth tips after testing at different running-in conditions. “S” in the micrographs indicates the sliding direction.
Speed promoted micropit formation at the dedendum where there is negative sliding (sliding and rolling moves in the opposite direction), and load influenced micropitting at the tip surface where sliding is positive (sliding and rolling moves in the same direction).
Residual stresses
Residual stresses are an important factor in surface integrity that highly influences the fatigue life of gears. Hence, stress levels obtained after hard finishing and their evolution during initial cycles were closely monitored. summarizes the residual stresses on the dedendum surface for all tests with average values from three different teeth, differing at most by ±20 MPa. For as-honed gears, the stresses were compressive in both directions and slightly higher in profile direction. After running-in, the stresses tend to decrease in both directions, more so in the profile direction. Tönshoff, et al. (Citation18) explained that maximum load stresses act in the profile direction due to high frictional forces created by combined rolling and sliding. Consequently, severe local plastic deformation in the profile direction results in higher stress variations. For ground gears, Mallipeddi, et al. (Citation9, Citation19) observed increasing compressive residual stresses in both directions after running-in, which relaxed during further testing, at least in the profile direction. It is important to note that grinding induced much lower stresses than honing. This shows that the evolution of stresses is also dependent on the initial stress state and its response to material yielding.
Figure 5. Residual stresses at the dedendum surface for three positions in the axial direction for different conditions.
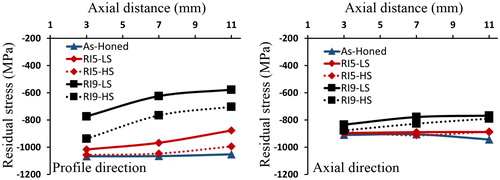
The lowest compressive stresses were observed for RI9-LS. Overall, load had a great influence on stress relaxation, and for both loads the combination with low speed resulted in greater stress relaxation. Running-in also resulted in a stress gradient between axial positions. This is attributed to the helix angle modification that resulted in a nonuniform pressure distribution along the width of the flank.
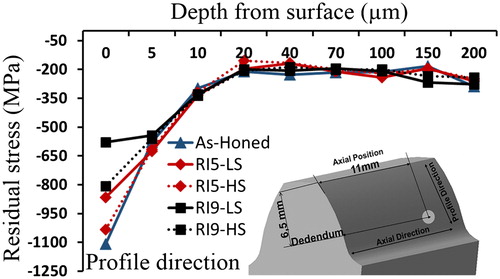
Residual stress depth profiles are shown in . The case stress was around 200 MPa, equal in both directions. Honing increased the stresses in the outermost ∼10 µm, whereas the relaxation induced by running-in was limited to a depth of ∼5 µm. Similar results were reported by Tönshoff, et al. (Citation18). In that study, honed gears made of the same material were tested for pitting life. Running-in was performed with a torque of 132 Nm, intermediate between the torques used in this study. In addition to the nominal shear stress arising from the nominal geometry, mating asperities generated shear stresses close to the surface. Sosa (Citation20) simulated the running-in process of ground gear surfaces and the predicted results depicted higher shear stresses confined to the outermost layers of ∼7 µm. Previously, the authors (Mallipeddi, et al. (Citation21)) characterized the surface integrity of efficiency-tested ground, honed, and superfinished gears. The results showed that the testing relaxed compressive residual stresses only for ground and honed gears, whereas for smoother superfinished gears the residual stresses remained unaltered. Moreover, the relaxation for ground and honed gears was limited to a depth of ∼5 µm. This implies that the evolution of residual stresses is related to the variation in pressure distribution of mating asperities and their consequent deformation.
Figure 6. Residual stress profiles for different conditions.
Microstructure
For as-honed gears, the microstructure of the case-hardened layer consists of plate martensite. The surface-retained austenite content was about 9% as determined by X-ray diffraction. After running-in, a distinct structural feature was observed near the tooth surface (to a depth of ∼5 µm) along the profile but mostly at the dedendum. An example is shown in . The morphology consists of thin parallel bands oriented in different directions and sometimes intersecting.
Figure 7. Micrograph of RI9-HS with distinct features.
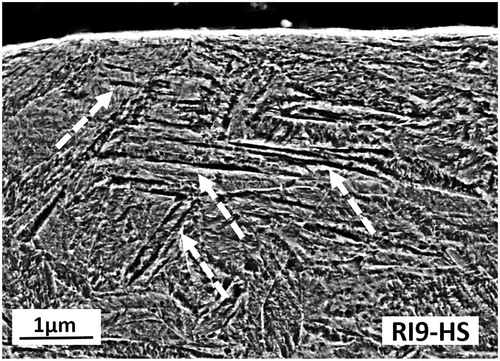
Though it is hard to quantify, more bands were seen for RI9 tests and in particular for RI9-LS. In a previous study (Mallipeddi, et al. (Citation9)), the authors observed these features in ground gears that were run-in under the same test conditions. The morphology of these bands appears similar to that of deformation-induced martensite in stainless steel (Das, et al. (Citation22)). However, this is not likely to be the case in this study because the retained austenite content remains within 8–9% from as-honed to running-in test conditions.
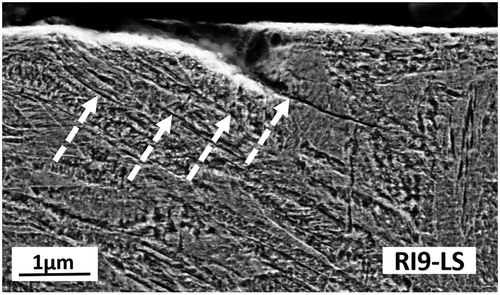
Detailed cross section analyses also revealed the association of these features with surface cracks (), known to be connected to asperities/the surface lay (Mallipeddi, et al. (Citation9)). This indicates that these features could be deformation bands formed due to cyclic plastic deformation of asperities, from which surface fatigue cracks initiated. Nevertheless, detailed transmission electron microscopy analyses would be required to identify the structure and determine its influence on the performance of gears.
Figure 8. Distinct features associated with surface cracks.
Surface chemistry
The major role of a lubricant is to protect and minimize friction between gear pairs by avoiding metal-to-metal contact via establishing a tribofilm. Depending on the operating conditions and topographical changes, direct metal contact can be prevented by the formation of a reaction layer with extreme pressure (EP) additives in the lubricant.
The results of surface chemical analysis are presented as XPS depth profiles. The analysis area was about 0.8 mm in diameter and there was some roughness on the surface of the samples. Ion etching is influenced by the roughness and the profiles represent the average composition integrated over layers and particles with different compositions and thicknesses. The profiles (not presented) of as-honed gears showed the presence of an Fe oxide limited to a few nanometers, the alloying elements, and some C contamination. Characteristic elements that might originate from the cutting fluid were N (∼3 at%), Si (∼5 at% at the surface), and traces of Ca. Nitrogen was mostly present at the surface, whereas Si was present down to 5 nm. No P or S was found on the as-honed gear.
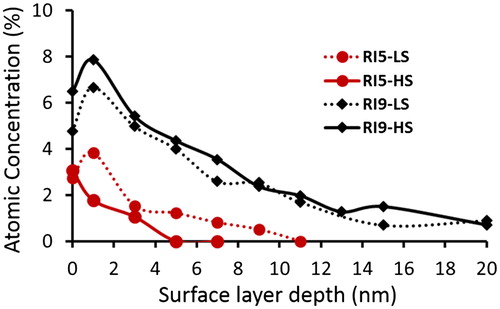
A tribofilm develops depending on the testing, and the most interesting elements to follow are P and S from EP additives. Phosphorous was observed after running-in as shown in . Higher concentrations (∼7 at%) and thicker layers (∼11 nm) were recorded for high running-in load, independent of speed. This is in conjunction with the evolution of surface topography where severe deformation was seen for higher running-in load. At low load, significantly less P was recorded in similar concentrations for both speeds. The other main EP additive constituent, S, was not found in any test condition. Overall, the load clearly influenced the tribofilm formation, whereas it appears unaffected by speed.
Figure 9. Phosphorous depth profiles obtained by XPS for different running-in conditions.
Conclusions
Running-in certainly affected the surface characteristics in a layer limited to <5 µm. The surface asperities were deformed through plastic deformation and the severity increased with increasing load. In addition, the formation of thin parallel bands in the microstructure, as well as relaxation of the residual stresses, were also promoted by the load. Surface cracks were observed to be associated with structural changes. A higher amount of P from EP additives was observed for higher running-in load conditions.
Higher running-in load significantly improved the smoothness of the surface. However, it simultaneously affected the surface integrity by inducing microstructural changes that have a detrimental effect on the life of gears. On the contrary, micropitting readily occurring during running-in was enhanced more by speed than load. Hence, the micropitting mechanism was speed dependent. Overall, this study shows how a running-in process alters the hard finishing surface characteristics and presents the conditions that determine the performance of gears.
Acknowledgements
This work was done in cooperation with AB Volvo and Scania CV AB. The authors thank Professor U. Olofsson at the Royal Institute of Technology for valuable discussions and support. We also thank Edwin Bergstedt for helping us with the roughness measurements.
Additional information
Funding
References
- Tönshoff, H. K. and Marzenel, C. (2000), “Effect of Gear Honing on Flank Characteristics and Pitting Life,” Production Engineering, 7(1), pp 5–8.
- Ariura, Y., Ueno, T., and Nakanishi, T. (1983), “An Investigation of Surface Failure of Surface-Hardened Gears by Scanning Electron Microscopy Observations,” Wear, 87(3), pp 305–316.
- Sjöberg, S., Bjorklund, S., and Olofsson, U. (2011), “The Influence of Manufacturing Method on the Running-In of Gears,” Proceedings of the Institution of Mechanical Engineers - Part J: Journal of Engineering Tribology, 225(10), pp 999–1012.
- Andersson, S. (1977), “Initial Wear of Gears,” Tribology International, 10(4), pp 206–210.
- Ismail, R., Tauviqirrahman, M., Jamari, and Schipper, D. J. (2011), “Topographical Change of Engineering Surface Due to Running-In of Rolling Contacts,” New Tribology Ways, pp 131–152. doi:10.5772/15408.
- Hsu, S. M., Munro, R., and Shen, M. C. (2002), “Wear in Boundary Lubrication,” Proceedings of the Institution of Mechanical Engineers - Part J: Journal of Engineering Tribology, 216(6), pp 427–441.
- Kragelsky, I. V., Dobychin, M. N., and Kombalov, V. S, eds. (1982), Running-In and Equilibrium Roughness. Chap. 9 in Friction and Wear, 297–316. Pergamon.
- Sjöberg, S., Sosa, M., Andersson, M., and Olofsson, U. (2016), “Analysis of Efficiency of Spur Ground Gears and the Influence of Running-In,” Tribology International, 93, pp 172–181.
- Mallipeddi, D., Norell, M., Sosa, M., and Nyborg, L. (2017), “Influence of Running-In On Surface Characteristics of Efficiency Tested Ground Gears,” Tribology International, 115, pp 45–58.
- Höhn, B., Oster, P., Tobie, T., and Michaelis, K. (2008), “Test Methods for Gear Lubricants,” Goriva I Maz, 47, pp 129–152.
- Group F-R. (2002), Research Project No. 345 Efficiency Test, FVA: Frankfurt, Germany.
- Gohar, R. (2001), Elastohydrodynamics, Imperial College Press: London.
- Andersson, M., Sosa, M., and Olofsson, U. (2016), “The Effect of Running-In on the Efficiency of Superfinished Gears,” Tribology International, 93, pp 71–77.
- Fitzpatrick, M. E., Fry, A. T., Holdway, P., Kandil, F. A., Shackleton, J., and Suominen, L. (2005), Determination of Residual Stresses by X-ray Diffraction—Issue 2, National Physical Laboratary: Teddington, UK.
- Locateli, C., Martins, R., and Seabra, J. (2011), “Evolution of Tooth Flank Roughness during Gear Micropitting Tests,” Industrial Lubrication Tribology, 63(1), pp 34–45.
- Errichello, R. (2012), “Morphology of Micropitting,” Gear Technology, pp 74–81.
- Li, S. and Kahraman, A. (2013), “Micro-Pitting Fatigue Lives of Lubricated Point Contacts: Experiments and Model Validation,” International Journal of Fatigue, 48, pp 9–18.
- Tönshoff, H. K., Friemuth, T., and Marzenell, C. (2000), “Properties of Honed Gears during Lifetime,” CIRP Annals, 49(1), pp 431–434.
- Mallipeddi, D., Norell, M., Sosa, M., and Nyborg, L. (2015), “Stress Distribution over Gear Teeth after Grinding, Running-In and Efficiency Testing,” International Conference on Gears, pp 973–984, VDI-Berichte: Munich, Germany.
- Sosa, M. (2017), Running-In of Gear—Surface and Efficiency Transfrmation, Doctoral Thesis, Royal Institute of Technology, School of Industrial Engineering and Mangement, Stockholm, Sweden.
- Mallipeddi, D., Norell, M., Sosa, M., and Nyborg, L. (2019), “The Effect of Manufacturing Method and Running-In Load on the Surface Integrity of Efficiency Tested Ground, Honed and Superfinished Gears,” Tribology International, 131, pp 227–287.
- Das, A., Sivaprasad, S., Chakraborti, P. C., and Tarafder, S. (2011), “Morphologies and Characteristics of Deformation Induced Martensite during Low Cycle Fatigue Behaviour of Austenitic Stainless Steel,” Materials Science and Engineering A, 528(27), pp 7909–7914.