
 ?Mathematical formulae have been encoded as MathML and are displayed in this HTML version using MathJax in order to improve their display. Uncheck the box to turn MathJax off. This feature requires Javascript. Click on a formula to zoom.
Abstract
This article describes how a wheel–rail wear detection parameter based on noise was developed by running a rapid transit train instrumented with microphones in a depot with a small curve radius. This full-scale test made use of previous knowledge gained from lab-scale tests. The lab- and full-scale tests showed that noise could be used as an indicator of wear transition, when normal wear turns into severe or catastrophic wear. This transition was accompanied by a significant increase in sound pressure and a broader sound pressure amplitude spectrum; that is, a narrow initial amplitude distribution in the normal wear regime and a broader distribution in the severe wear regime. The measured noise from the inner/low and outer/high rails was analyzed in conjunction with the wear from the outer wheel and comparisons were made between cleaned (exposed to severe wear) and lubricated (no wear) rail. Based on those analyses, a wear detection parameter criterion was developed for this specific train. This wear parameter has been implemented in a real-time condition monitoring system so that warnings of the risk for severe wear could be sent to the maintenance department. Validation of the wear parameter and challenges linked to open system conditions are discussed in this article.
Introduction
Action plans to manage noise from roads, aviation, industry, and railways require noise mapping, such as the European Directive 2002/49/EC (Council of the European Parliament (Citation1)). There are national standards for predicting railway noise, such as the “Calculation of Railway Noise 1995” from the UK (Citation2). However, like all models trying to simulate reality, these standards have shortcomings. For example, as discussed by Hardy, et al. (Citation3), the “Calculation of Railway Noise 1995” method does not allow for variability in rail head roughness. Nor does it include wheel squeal or rail gauge–wheel flange contact noise. A rough track can lead to a significant increase in rolling noise. However, roughness is just one of many parameters that influence noise. Others include speed, the number of wheelset passages, and the vertical stiffness of the ballast. In The Netherlands, rail grinding (or acoustical grinding) has been used to decrease rolling noise from the rail head. Methods for grinding the rails to reduce sound have also been developed in Germany (von Diest and Puschel (Citation4)) and Kuijpers (Citation5) has discussed the development of monitoring methods to assess the noise reduction due to rail grinding. Furthermore, Jiang, et al. (Citation6) presented a framework for integration of different models to enable noise growth predictions based on the growth mechanics of rail roughness.
This study, on the other hand, tries to use changes in noise to detect wear transitions (Dwight and Jiang (Citation7)). Few studies have investigated this approach to using noise measurements. According to Hardy, et al. (Citation3), corrugations (periodic wear patterns with a wavelength typically ranging from 30 to 80 mm) on the rail head can lead to an increase of 20 dB or more in A-weighted rolling noise. Laboratory-scale tests (Lyu, et al. (Citation8)), linked to the Quiet-Track Project, which this study is a part of, show a similar increase in noise when transitioning from mild wear to severe wear. Bolton and Clanton (Citation9) classified the transitions in the wheel–rail wear rate into three wear regimes: type I—mild wear, type II—severe wear, and type III—catastrophic wear. These regimes are based on classification of the wear rate in comparison with the worn surface appearance and size of the wear particles. Using field and laboratory data, Lewis and Olofsson (Citation10) drew a wear map of wheel–rail contact showing the location of the three wear regimes in a velocity/contact pressure space. Because the wheel–rail contact is an open system, the weather conditions also must be taken into consideration to fully understand the wear transitions (Lyu, et al. (Citation11)).
The main purpose of this study was to scale up the previous laboratory results (Lyu, et al. (Citation8)) to a full-scale test in a depot to study the wear transitions using a train instrumented with microphones on a dedicated test track. Based on these tests, a wear detection parameter was estimated to predict the risk of severe wear. The final set in this study was to validate and tune the wear detection parameter in real traffic conditions.
Experimental procedure
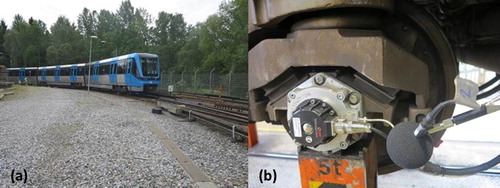
The full-scale tests were carried out with a rapid transit train, type C20 (eight axles), equipped with microphones that continuously measured the sound pressure near the wheel–rail contact (). In addition to the onboard monitoring microphones mounted under the vehicle (located at both the inner and outer rails), eight additional microphones were used to measure the noise close to each wheel on the outer rail. A stationary microphone was also utilized in this test setup. To provoke severe or catastrophic wear, the test train was run back and forth in a curve with a 200-m radius. The full-scale test was performed in sets from I to VI and can be described as follows:
Figure 1. (a) The instrumented C20 rapid transit train running on the test curve and (b) the microphone instrumentation mounted near the wheel.
Initial tests after no train passages.
After 12 passages of the train.
After another 12 train passages, 24 in total.
After another 12 train passages, 36 in total.
Manual application of oil to rail by brush (no additional trains were run).
Track oil lubricator used and another six passages of the train, or 42 in total.
All sets include taking photographs; making cast replicas, form measurements, slip resistance measurements; and collecting particles, except test set V, where only slip resistance was measured after lubricating the rail. Rails and wheels were carefully cleaned before starting the full-scale test but not between each set.
The wheels were photographed and cast replicas of the wheel surfaces were made using blue laser coursing molds (Technovit Blue LED) before starting and after finishing all test sets. The rail surface was also photographed and surface replicas were made at three track locations: the entrance to the curve, the middle part of the curve, and the end of the curve. Form measurements of the rail and wheel profiles were performed using a Greenwood Engineering Miniprof system. Form measurements of the rail profile were made at the middle part of the curve. Particles were collected with Scotch tape at the end of the curve. A Wessex pendulum slip resistance tester was used to measure the rail gauge corner friction at the middle part of the curve. The corresponding coefficient of friction was calculated using the following equation (Lewis and Olofsson (Citation10)):
[1]
[1]
where μ is the coefficient of friction and SRV is the measured slip resistance value. The coefficient of friction is used as an indication of the lubrication efficacy.
Results
The following results are based on a full-scale test on a 200-m-radius curve at Högdalen depot and validation of the condition monitoring tool by operating the instrumented train in normal metro traffic. Note that this article does not cover all of the data collected.
Friction and wear measured at the test depot
presents the results of the slip resistance measurements. In total, six slip resistance measurements were conducted for each test set. The average value was used to calculate the corresponding coefficient of friction. also shows the metrological conditions for the test day. As expected, the coefficient of friction shows a stable value during the test period and a decreased value when the rail was lubricated again. shows the worn rail gauge corner after 36 passages, indicating severe wear with the severely worn surface on the gauge corner and wear particles on the rail foot. shows a wear particle collected at the end of curve, which shows evidence of severe adhesive wear. The wear particle consists mainly of Fe, Cu, Ni, Zn, and their oxides (Abbasi, et al. (Citation12)).
Figure 2. Photograph of particles at the rail foot due to severe wear at the rail gauge–wheel flange contact after 36 train passages.
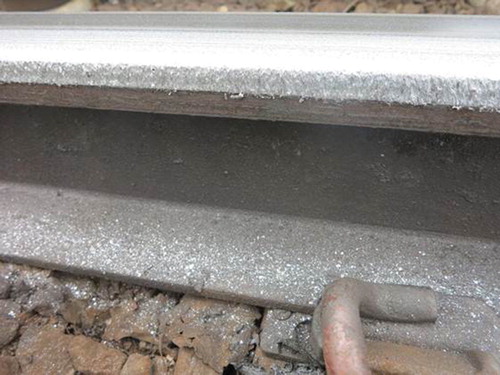
Figure 3. Photograph of a wear particle collected at the end of the curve after 36 train passages.
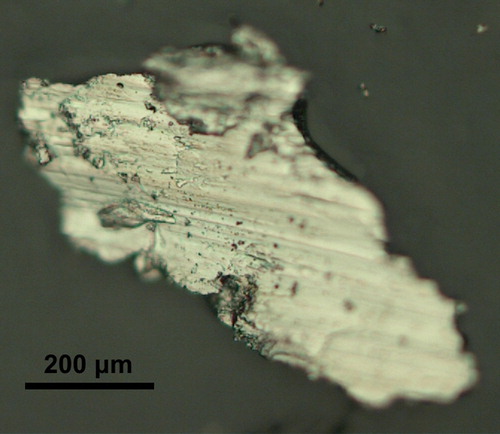
Table 1. Results from slip resistance measurements with meteorological data.
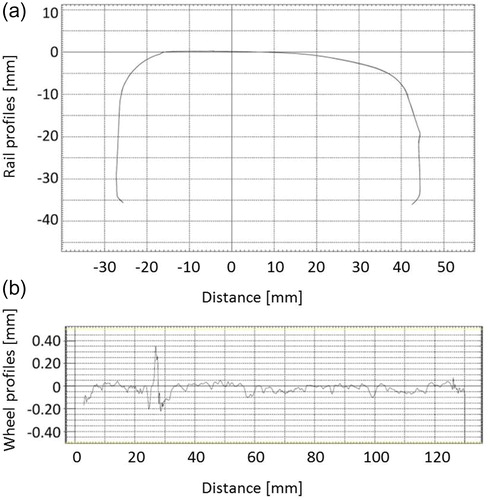
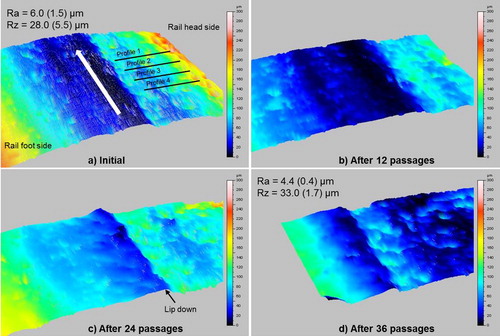
presents profile measurements, showing that the accumulated wear during the entire test on both the outer rail in the curve and the wheels was rather small. Negligible (or not measurable) wear was found on the rail. At the wheel flange closest to the microphone mounted on the outer side of the curve, 0.4 mm was measured as the maximum wear perpendicular to the rail surface (). The negative values in are due to plastic deformation (material transfer) and to measuring uncertainties. The wear of the inner wheel (not shown) was somewhat lower (approximately 0.1 mm).
Figure 4. (a) Measured profiles of the outer rail at the test site before and after testing—no visual difference and (b) calculated perpendicular outer wheel wear accumulated during the test.
presents the results of surface topography measurements of the replicas of the rail using a Taylor Hobson Form Talysurf PGI 800 with a stylus tip radius of 2 µm. For the rail gauge, an edge (i.e., lip down indicated in ) becomes slightly sharper with the number of passages. The average roughness parameter Ra and the 10-point high (ISO) roughness parameter Rz for the gauge face toward the rail head side are shown in (initial) and (after 36 passages). The standard deviation changes more than the mean values. For the wheel flange (not shown), surface roughness increased with the number of passages.
Figure 5. (a)–(d) Surface topography measurements of 5 x 8 mm2 rail replicas, scaling from 0 to 300 µm. The arrow in (a) indicates the direction of travel and the four lines refer to the profile measurements. Mean surface roughness is presented in (a) and (d) with standard deviations in brackets.
Sound measured at the test depot
The wear detection parameter can be regarded as an advanced parameter from which the probability of severe wear can be estimated and should be above 40% to detect severe wear. The wear detection parameter compares the noise (narrow band) coming from the outer and inner wheel–rail contacts and estimates the probability of severe wear based on the amplitude difference between them. The wear detection parameter criteria are a lower limit of sound pressure levels to be included Lp,limit and a lower limit sound pressure difference between Lp,outer and Lp,inner; when 40% of the frequencies meet these two criteria the probability of severe wear is high (). Simply put, one could think of the wear parameter as a percentage of the frequencies that meet the criterion. Note that the frequencies representing the wheel resonances are ignored. The criteria must be defined individually for each vehicle based on the noise emitted under the specific vehicle.
Table 2. Evaluation parameters used for severe wear.
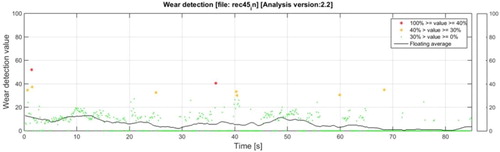
Comparing the floating average (solid line) in of the wear detection parameter reveals the effect of lubrication. represents a measurement at test set IV with many occurrences where the parameter is above the wear detection trigger value of 40%. The parameter shows lower levels in , which represents a measurement after lubrication (test set VI) of the gauge face of the outer rail.
Figure 6. Wear detection parameter of the outer rail passage under dry conditions.
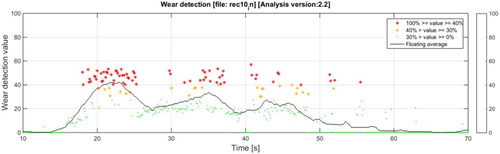
Figure 7. Wear detection parameter after lubricating the gauge faces of the outer rail passage.
Results from tests in traffic
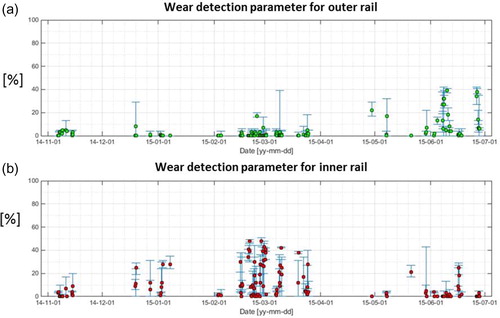
The wear detection parameter was implemented in a real-time analysis system that continuously predicted the wear parameter when the train was in traffic. The same vehicle and monitoring system used for the test performed in the depot is used in real traffic. During tests in traffic, the severe wear detection parameter was tested under different weather conditions and for different speeds, traffic situations, and curve radii. The condition monitoring log and weather data were compared to verify the measurement results. The measured data allowed the wear parameter to be studied over time at one position or at critical positions in the track system on specific days. In the wear detection parameter is plotted from November 2014, when the monitoring system started to record data, to July 2015. shows how the parameter is increased in March 2015. In June 2015 the daily average value reached high levels, in the same range as those during the test at the test depot. shows the wear detection parameter for the inner rail, whose high values are due to squeal noise rather than severe wear. The same trend can be seen across the network.
Figure 8. Monitoring of severe wear of the (a) outer rail and (b) inner rail in Alvik.
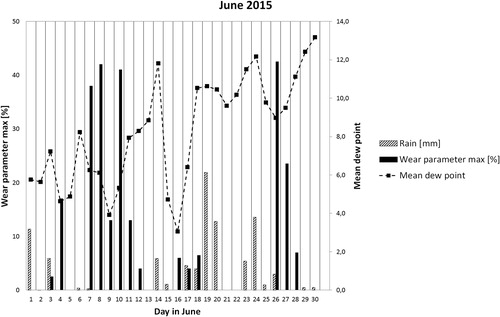
It was noted that the wear detection values in long tunnels are lower for a longer time during the spring compared to positions outside tunnels. shows a situation in a tunnel at T-Centralen (the central station of Stockholm metro network). Note the stable values for the outer rail () between November 2014 and April 2015. presents the maximum value of the wear detection parameter measured within 24 h, together with the dew point and rain for the same days in June 2015 in Stockholm (Ängbyplan and Moraberg), close to Alvik. The dew point is a measure of how much moisture is in the air. The wear detection measurements in June at Alvik (14 in total) show slight tendencies such that the wear parameter increases when the dew point decreases (see days 6–9, 14–16, and 24–26 in ) and that the wear parameter decreases with increasing dew point (see days 10–12 and 26–28 in ). High values might also indicate wear in the switch. On June 9, rail surface replicas were made in Alvik, which indicated normal wear and visual inspection close to the rail showed no severe wear particles as found at the test depot ().
Figure 9. Wear detection parameter of the (a) outer rail and (b) inner rail at T-Centralen in a tunnel (November 2014 to June 2015).
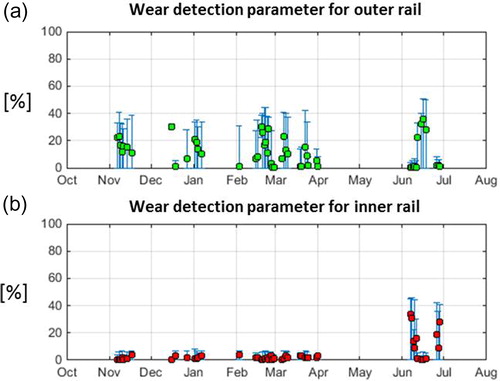
Figure 10. Wear detection parameter at Alvik in June plotted with rain and dew point collected at Ängbyplan and Moraberg (close to the Stockholm metro in Alvik).
Discussion
The full-scale test at the Högdalen test depot shows results similar to the previously presented laboratory test results: the transition from mild to severe wear is followed by an increase in the sound pressure and a broader sound pressure amplitude spectrum (Lyu, et al. (Citation8)). By comparing noise from the inner wheel–rail contact to noise from the outer wheel–rail contact, a wear detection parameter for the outer wheel–rail contact was proposed. The third and final set in this project was to implement this wear parameter in a monitoring system so that warnings could be sent to the maintenance department when the system detected a probability of severe wear at a specific position along the track network. This warning would trigger an automatic lubrication system that could be mounted on the same vehicle. In evaluation of the noise signals, high frequencies (>5 kHz) are important.
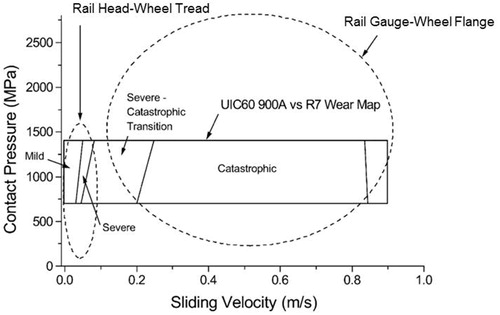
The results thus far indicate that the proposed wear detection methodology may be a useful tool. However, further work in terms of track inspections in parallel with track operation is necessary. The wear detection parameter measured in traffic reaches levels similar to those in the tests performed at the Högdalen depot, where severe wear was forced to occur. The high value of the wear detection parameter indicates that ≥40% of the frequencies are dominated by noise from the outer wheel–rail contact and signals the likelihood that the contact is dry and that there is a probability of severe wear. The wear mechanism that causes this noise is a transient event. Based on the contact type—that is, contact between the wheel tread and rail head and contact between the wheel flange and rail gauge—the contact conditions vary significantly, which results in very different wear regimes. As shown in (Lewis and Olofsson (Citation10)), the wheel tread–rail head contact has relatively low pressure and low sliding speed, falling in the mild to severe wear regime. The wheel flange–rail gauge contact has much higher pressure and sliding speed, leading to severe to catastrophic wear regimes. This corresponds to the test conditions for the full-scale test at the Högdalen depot. Due to the open nature, weather precipitation (e.g. rain and snow) and various contaminants (e.g. leaves and sand) can be present between the railway wheel and rail, forming third-body layers (Lewis et al. (Citation13)), which affect the wear (Lyu and Olofsson (Citation14)). This highlights the need for in situ detection of the transfer from mild wear to severe wear.
Figure 11. A rail steel wear map plotted over wheel–rail contact conditions from Lewis and Oloffson (Citation10).
The result shows that the wear parameter can vary from day to day and is in some way correlated with weather (). When the dew point decreases, the wear parameter appears to increase. This finding agrees with the results from a previous study (Nilsson (Citation15)). In laboratory tests, Lyu, et al. (Citation16) also found that a decrease in relative humidity can significantly increase the amount of wear for wheel–rail contact conditions. In long tunnels it was noted that the wear detection parameters are lower for a longer time compared to positions outside tunnels. This is probably because the humidity in tunnels is more stable compared to the humidity variations outside the tunnels. The installation of lubrication boxes and maintenance actions such as regular lubrication of the inner flange of the rail head along the track will also affect the wear detection parameter. Severe wear on the rail gauge flange can heal quickly with just a small amount of lubricant; compare . For example, no severe wear was found in Alvik on June 9, although the wear detection parameter indicated a high risk of severe wear the day before and the day after.
Conclusion
The tests performed on the 200-m-radius curve in Högdalen, Sweden, show that the monitoring system can potentially detect severe or catastrophic wear from railway traffic by analyzing the noise emitted from the contact between the wheel and the rail. However, the evaluation may need to be adjusted to accommodate variables such as vehicle speed and track curve radius.
The wear detection parameter was implemented in the monitoring system installed on one vehicle running on the green line in Stockholm metro. The results indicate that this system has high potential to detect severe wear in real time. The evaluated data show results over the year that seem credible when compared to weather data. The monitoring of severe wear showed that the entrance of a curve gives the highest wear detection values and that in tunnels the wear is less affected by short variations in weather conditions.
Further monitoring is needed to finally define when severe wear occurs. The system will continue to monitor severe wear for the rest of this project. It is hoped that the monitoring of severe wear will be extended to cover the remaining lines in the Stockholm metro.
Acknowledgements
We thank the EU-funded FP7 research project named “Quiet Track – Quiet Tracks for Sustainable Railway Infrastructures” for the opportunity to carry out this work. The authors also thank Rida Zeki (MTR), Sören Stark (Strukton Rail AB), and Anders Brolin (TBT) for valuable assistance in the planning and running of the full-scale test.
References
- Council of the European Parliament. (2002), “Directive 2002/49/EC of the European Parliament and of the Council of 25 June 2002 Relating to the Assessment and Management of Environmental Noise,” Official Journal of the European Communities, L 189, pp 12–25.
- Great Britain. (1996), Calculation of Railway Noise 1995, Stationery Office: London.
- Hardy, A., Jones, R., and Turner, S. (2006), “The Influence of Real-World Rail Head Roughness on Railway Noise Prediction,” Journal of Sound and Vibration, 293, pp 965–974.
- von Diest, K. and Puschel, A. (2013), “High Speed Grinding-Railway Noise Reduction through Regular Rail Grinding without Traffic Interruptions,” INTER-NOISE and NOISE-CON Congress and Conference Proceedings, Innsbruck, Austria, September 15–18.
- Kuijpers, A. H. W. M. (2008), “Rail Roughness Monitoring in The Netherlands,” Noise and Vibration Mitigation for Rail Transportation Systems. Notes on Numerical Fluid Mechanics and Multidisciplinary Design, Schulte-Werning, B. et al. (Eds.), Vol 99. Springer: Berlin, Heidelberg.
- Jiang, S., Meehan, P., and Bellette, P. (2014), “Validation of a Prediction Model for Tangent Rail Roughness and Noise Growth,” Wear, 314, pp 261–272.
- Dwight, R. and Jiang, J. (2006), “Determining Wheel–Rail Wear Conditions Using Wheel–Rail Noise,” 7th International Conference on Contact Mechanics and Wear of Rail/Wheel System, Brisbane, Australia, September 24–26.
- Lyu, Y., Bergseth, E., and Olofsson, U. (2015), “On the Relationships among Wheel–Rail Surface Topography, Interface Noise and Tribological Transitions,” Wear, 338, pp 36–46.
- Bolton, P. and Clayton, P. (1984), “Rolling–Sliding Wear Damage in Rail and Tyre Steels,” Wear, 93, pp 145–165.
- Lewis, R. and Olofsson, U. (2004), “Mapping Rail Wear Regimes and Transitions,” Wear, 257, pp 721–729.
- Lyu, Y., Bergseth, E., and Olofsson, U. (2016), “Open System Tribology and Influence of Weather Condition,” Scientific Reports, 6, pp 1–11.
- Abbasi, S., Olander, L., Larsson, C., Olofsson, U., Jansson, A., and Sellgren, U. (2012), “A Field Test Study of Airborne Wear Particles from a Running Regional Train,” Proceedings of the Institution of Mechanical Engineers - Part F: Journal of Rail and Rapid Transit, 226(1), pp 95–109.
- Lewis, R., Dwyer-Joyce, R. S., Lewis, S. R., Hardwick, C., and Gallardo-Hernández, E. A. (2012), “Tribology of the Wheel–Rail Contact: The Effect of Third Body Materials,” International Journal of Railway Technology, 1, pp 167–194.
- Lyu, Y., and Olofsson, U. (2017), “Open System Tribology in the Wheel–Rail Contact—A Literature Review,” Applied Mechanics Reviews, 69(6), pp 1–10.
- Nilsson, R. (2005), On Wear in Rolling/Sliding Contacts, Doctoral Thesis, KTH Royal Institute of Technology, Department of Machine Design, Stockholm, Sweden.
- Lyu, Y., Zhu, Y., and Olofsson, U. (2015), “Wear between Wheel and Rail: A Pin-on-Disc Study of Environmental Conditions and Iron Oxides,” Wear, 328, pp 277–285.