
 ?Mathematical formulae have been encoded as MathML and are displayed in this HTML version using MathJax in order to improve their display. Uncheck the box to turn MathJax off. This feature requires Javascript. Click on a formula to zoom.
Abstract
Five common ball bearing greases were studied using a grease-on-paper test configuration, where the bleeding of greases is described by the dynamics of a driving capillary pressure provided by the paper and its opposing counterpart in the grease matrix. The Washburn-like model for extracting the retaining capillary pressure, determined by the affinity of the oil for the grease matrix, has proven to be applicable for greases made of various type of thickeners and base oils, and can potentially contribute to modelling the bleeding of stationary grease as well as to monitoring the change in bleeding properties of greases in a bearing.
Introduction
Grease is the most widely used bearing lubricant, consisting of 60-95% base oil, 3-25% thickener and up to 10% additives (Citation1). The thickener forms a self-assembled network, also referred to as grease matrix, with a microstructure that depends on the chemical composition of the grease (Citation2–5). For example, a mixture of calcium sulfonate and calcium carbonate usually leads to a grease matrix made up of agglomerated particles (Citation6, Citation7), while lithium or calcium di-12-hydroxystearate usually form a fibrous microstructure (Citation2, Citation8–10). Grease serves as an oil reservoir in a bearing. The base oil is slowly released from the grease matrix and delivered into the bearing contacts. This process of oil separation from the grease matrix, also known as bleeding, has a large impact on the grease life and hence the re-lubrication intervals of a rolling bearing.
In practice, grease life is usually modelled using accelerated tests, where the grease is subjected to severe conditions which ensure failures at an acceptable timescale, typically 1000 hours (Citation11). The empirical models for such tests require a large test population and are only accurate within the domain in which the tests were executed. This domain is given by a range of operating conditions with various speeds, loads, temperatures, bearing types and sizes, etc., which is again limited owing to practical reasons, such as the test capacity and the type of test rig. It is therefore important to develop mechanistic models based on the physics and chemistry of grease lubrication in rolling bearings which allow better prediction of the grease life under the actual operating conditions of the bearing.
The lifetime of a grease can end due to several reasons; an important one is related to bleeding. The end of the grease life is usually given by the point in time where the rate of bleeding is insufficient to compensate for the rate of oil loss in the bearing contacts (Citation12, Citation13). Excess bleeding will lead to exhaustion of grease and can be used as an indicator for predicting grease failure (Citation14). While lots of attention has been given to these oil loss mechanisms, such as the side flow in the starved elasto-hydrodynamic lubrication (EHL) contacts (Citation15–17), much less has been learnt about grease bleeding - the main feeding mechanism. Bleeding of grease is usually measured using the conical sieve bleeding methods (e.g. DIN 51817, ASTM D6184) and modelled based on Darcy’s law, which nicely explains the scaling relation between the grease bleeding rate and the inverse of oil viscosity (Citation18). Darcy-based models consider the grease matrix as a porous material through which the oil creeps out. Here the rate of bleeding is determined, among others, by the pressure gradient, the viscosity of the oil and the permeability of the grease matrix. Based on this concept, Baart et al. (Citation19) proposed that the permeability of the grease matrix decreases during bleeding, due to the fact that the grease matrix collapses due to centrifugal forces caused by rotation of the bearing. Their model is promising for describing bleeding of grease subjected to enormous centrifugal forces, such as the grease located on the cage. However, the grease contact repels during the churning phase (Citation13) and the grease tends to settle at the outer ring shoulder and on the seal (Citation10, Citation20). Free from the massive body forces due to rotation, this grease volume can be considered stationary.
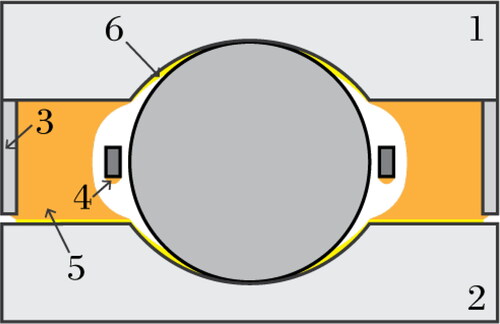
This stationary grease can have a major contribution to long-term bearing performance (Citation21). Hibino and coworkers demonstrated that the grease life can be extended almost linearly by enlarging the cavities in the bearing in which the stationary grease settles (region 5 in ) (Citation22, Citation23). The bleeding rate from this stationary grease is very low and can therefore persist for a long time. Owing to the low volume fraction of grease thickener, Saatchi et al. (Citation24) noted that the permeability of the grease matrix would be too high to maintain a small bleeding rate without another mechanism that slows down bleeding. They introduced a so-called “effective volume” around the grease thickener particles/fibers, within which oil is considered immobile, thereby decreasing the porosity and permeability of the grease matrix. Their model successfully explained the elevated bleeding rate of calcium carbonate grease after a certain degree of dilution.
Fig. 1. Schematic representation (not to scale) of static grease bleeding in a ball bearing (cross-sectional view), assuming inner ring rotation. 1: Outer ring; 2: inner ring; 3:seal; 4: grease under the cage; 5: static grease reservoir and 6: oil film
Another explanation ascribes the controlled bleeding of stationary grease to a low pressure in the grease matrix due to capillarity (Citation18, Citation25–30). Based on this idea, we developed a grease-on-paper test configuration for characterizing the capillary pressure inside the grease matrix that slows down bleeding. The affinity of bled oil for the grease matrix, which determines this retaining capillary pressure, is estimated using a Washburn-like model based on Darcy’s law, which has been discussed in details in our previous work (Citation31). Here, five commonly used ball bearing greases are studied, confirming the applicability of this model for greases made of a wide variety of thickeners and base oils. The results demonstrate the potential of this model for describing and predicting bleeding of stationary greases in a bearing and as a building block of the grease life model for monitoring the mechanical aging of greases in a bearing.
Modelling static grease bleeding
From a real bearing to a test configuration
In a bearing, the stationary grease reservoirs are typically formed between the outer ring of the bearing and the seal, as illustrated in . The reservoir gradually releases oil into the oil film in the vicinity of the EHL contact. Due to capillary forces at the steel surface (Citation32) and/or centrifugal forces caused by rotating balls (Citation33, Citation34), this oil film is gradually pulled towards the center of the track to the EHL contact. In our previous investigation we explained the bleeding dynamics of stationary grease from the perspective of the balance between an external driving pressure and an opposing capillary pressure in the grease matrix (Citation31). In this bleeding model, the grease matrix is described as a porous matrix from which the oil bleeds, base on the Darcy’s approach. The rate of bleeding is not only determined by the aforementioned pressure difference, but also by the viscosity of the base oil and the pore fraction and permeability of the matrix.
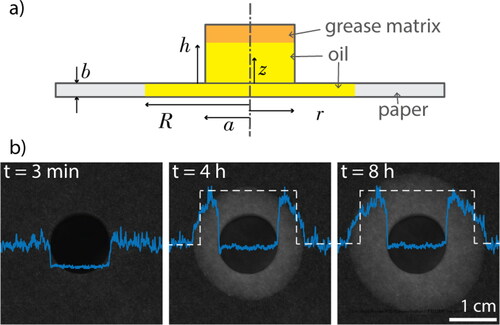
The model was verified using a test configuration inspired by two bleeding tests (Citation35, Citation36), where the complex geometry of the grease reservoir in a bearing is simplified by a cylindrical grease volume and absorbing paper is used in replacement of steel surface so as to facilitate the grease bleeding process. By tracing the transmitted light intensity of the oil stain, we quantify the rate of bleeding and the determined capillary pressure in the grease. The details of the model are described in the next section.
Flow equations for the test configuration
The oil flow in the grease matrix and blotting paper can be described by Darcy’s law:
[1]
[1]
where
is the pressure gradient,
the gravitational acceleration, ρ the density, η the dynamic viscosity of the oil, k the permeability of the grease matrix and
is the flow velocity averaged over the surface perpendicular to the flow. Since the stationary grease matrix is considered to be static during bleeding, its permeability kg is considered to be constant. Therefore, the above equation is reduced to
while for the paper, it becomes
By expressing vz and vr in the volumetric flow rate Q according
in the grease and
in the paper, we obtain by integration the pressure field p(z) in the grease and p(r) in the paper:
[2]
[2]
[3]
[3]
where pa is the pressure in the paper at r = a and pb is the average pressure in the grease at z = 0;
EquationEquation 2[2]
[2] holds for
where z = h is at the oil-air interface in the grease, and EquationEquation 3
[3]
[3] for
where r = R is at the oil-air interface in the paper. Note that in practice the oil front is not as sharp as illustrated in , because the pores in the paper are partially saturated. The transmitted light intensity profiles indicate a diffusive oil front. To address this problem, we define
as the radius of an effective oil stain of the same volume V but with a sharp oil front, as indicated in white dashed lines in . (Citation31)
Fig. 2. a) A schematic representation of the test configuration (not to scale). b) Top-view snapshots of CaS/MS grease during bleeding. Dark circle in the center: the grease patch; solid blue lines: intensity contrast () profile of the oil stain; dashed blue lines: the effective intensity contrast profile
With the above two equations, we can calculate the pressure difference where
is the pressure drop across the oil-air interface in the paper and
the pressure drop across the oil-air interface in the grease matrix:
[4]
[4]
Anticipating that we neglect the term ρgh on the left hand side of EquationEquation 4
[4]
[4] . Moreover, if
the last term on the right hand side can be neglected, too. In the discussion section, we will verify that these assumption indeed hold. Therefore, EquationEquation 4
[4]
[4] reduces to:
[5]
[5]
The volumetric flow rate can be expressed in the speed of the front of the stain at radius R,
Substituting this expression in EquationEquation 5
[5]
[5] we obtain a differential equation for the time evolution of the stain radius:
[6]
[6]
where tb is the characteristic bleeding time:
[7]
[7]
Solving the differential equation, with the initial condition leads to:
[8]
[8]
where R grows from a at t = 0 to eventually
where
is determined by the total amount of the oil initially available in the grease patch, i.e.
so
In the range of interest,
we can approximate this expression with an error less than 1% by:
[9]
[9]
Grease microstructure and the oil-matrix affinity
As discussed in section 4.1 the bleed rate is the result of a competition between the driving capillary pressure in the paper and the opposing capillary pressure due to the affinity of the oil for the grease matrix (Citation31). The capillary pressure can be calculated by balancing the surface energy, of the wet fibers in a control volume δV with the virtual work
done by the pressure drop over the control volume:
[10]
[10]
where
is the specific wetting area per unit volume of oil in the grease matrix, while
is the change in interfacial tension after the grease matrix is wetted by the oil, representing the wetting affinity of the oil for the surface of the grease matrix. For a fibrous matrix the specific wetting area
can be determined from the fiber distribution
i.e. the number density of fibers with a radius between s and s + ds, as:
[11]
[11]
where β = 2. For greases with an aggregated particle matrix the same expression can be used, where s is the radius of the particle, but now with β = 3. Assuming a monodisperse fiber or particle matrix with radius s, the above equation simplifies to:
[12]
[12]
Materials and methods
Grease types
Five common commercial ball bearing greases were used. Bled oils were extracted for control measurements from the greases via centrifugal filtration at 1000 at 20
C through a polyvinylidene fluoride (PVDF) membrane of pore size 0.45 μm. The viscosity of the bled oils were measured using a rheometer with a couette geometry. The surface tension of the bled oils was determined via pendant drop method using an optical contact angle measuring and contour analysis system. The specifications of the greases and their base oils are summarized in .
Table 1. Properties of the commercial greases and their bled oils; and the values of the fit-parameters obtained from the grease bleeding tests, the oil drop spreading tests and the initial-stage capillary rise tests.
Experimental setup
For the grease bleeding experiment, the five greases are deposited at the center of the paper in a cylindrical shape using a glass model and a spatula. The base radius of the grease patch is 5 mm and the height is 1.1 mm. As control measurements, the bled oil extracted from the same grease is placed onto the paper. All measurements were performed in triplicates. During the experiment, chromatography paper of porosity (39.8 ± 0.2)%, of thickness 167 μm and with pore sizes ranging from 1-30 μm, is clamped between two plastic rings so as to minimize the contact between the paper and the solid surface. As the oil is absorbed by the paper, a translucent oil stain appears and grows in radial direction. The paper is illuminated from below using a LED pad. The transmitted intensity map of the oil stain is recorded from the top view using a CCD camera. shows typical snapshots of the oil stain during grease bleeding.
The transmitted intensity contrast is converted into the mass of oil using a modified Lambert-Beer’s model that we previously described (Citation31):
[13]
[13]
except the region cover by the grease patch is assumed to be instantaneously saturated by the oil:
[14]
[14]
Here, I(i, j) and m(i, j) are the transmitted intensity and the mass of oil in the pixel at position (i, j); Ibg is the average background intensity; Apx is the area of a single pixel; c1 and c2 are constants determined by calibration. The details of the calibration procedure can be found in (Citation31). The values of the calibration constants for the bled oils are given in . The effective radius of the oil stain, R, is therefore determined by:
[15]
[15]
Capillary rise
To characterise the capillary pressure and the permeability of the paper, capillary rise experiments were performed. Chromatography paper stripes of 10 mm by 200 mm are dipped vertically in oil baths of the five bled oils. The rising front of the oil was recorded during the first 1000 s in side view using a CCD camera and backlight provided by the LED pad. For the bled oil of PU/e grease, an extended 5-day experiment has been performed. The oil front was identified using the inbuilt MatLab” edge” function and the” Canny” algorithm.
Results
Grease bleeding behaviour
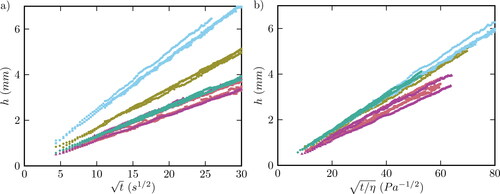
The effective radii R of the oil stains resulting from bleeding of the five greases have been plotted versus the square-root of time in . Although performed at a different temperature, the bleeding dynamics of the five greases shows a consistent trend with the final bleed rates of DIN 51817 oil separation tests given in . Using the initial radius a and bleeding time tb as fit-parameters, the model calculations fits nicely to the experimental data. In we show the scaled radius R/a versus and, in the inset,
Three regimes can be identified in these bleeding curves. At the initial stage of bleeding (typically for
all bleeding curves starts with an effective radius slightly larger than 5 mm, the base radius of the grease patch, however, the effective radii barely grow in this regime. This is an artefact introduced by our assumption during image analysis due to the difficulty in quantifying the oil amount with a translucent grease patch above the paper. Since the paper is very thin as compared to the base radius of the paper, we considered this area to be spontaneously wetted. However, the timescale for penetration of the oil in the vertical direction turns out not negligible, possibly due to the larger pore sizes in the depth direction and consequently smaller driving force for the liquid transport. Therefore, the effective radius of the stain during the initial stage of bleeding is overestimated and is not taken into account forfitting.
Fig. 3. a) Effective radius of the oil stain R versus square-root of time resulting from bleeding of greases; b) normalized effective radius R/a of the oil stain as a function of normalised time
or the square-root of normalized time
(inset) collapsed onto a single master curve. The colored symbols represent the experimental data (from left to right, cyan: Li/SS; teal: Li/M; olive: PU/e; pink: LiC/PAO; and purple: CaS/M). Dashed lines represent the best fitting model curves
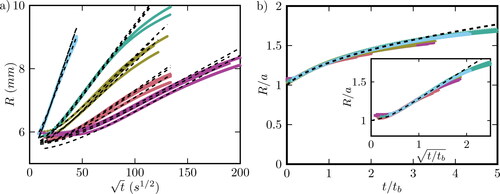
In the second regime, the bleeding curves show a Washburn-like behaviour, that is, the effective radius R depends linearly on the square-root of time as in EquationEquation 9
[9]
[9] . In this regime, our model successfully describes the bleeding of all the five greases. After scaling all the bleeding curves collapse onto the expected master curve given by EquationEquation 8
[8]
[8] , as shown convincingly in . The values of a and tb extracted from the best fits, together with
are given in .
Depending on the type of grease, the Washburn-like regime typically ends at after which the rate of bleeding (which is proportional to
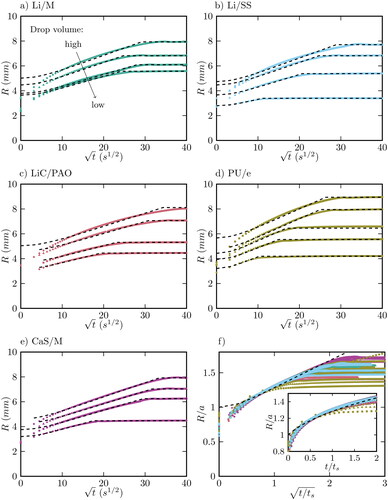
) decreases, more strongly than the model prediction. This onset of the third regime corresponds to a release of approximately 20% of the oil that is initially available in the grease (except for LiC/PAO grease, of which the bleeding curves levels off at a release of about 15%). A possible explanation for the decreased bleeding rate is the partial collapse of the grease matrix after a considerable amount of oil is extracted during the bleeding process. Our earlier work showed that greases with a partially collapsed microstructure bleed significantly slower (Citation31). Similarly, diluting greases with their own base oil, a reverse process of grease bleeding, is also proven to enhance the rate of bleeding (Citation24). Furthermore, the onset of the third regime in the bleeding curves (see ) differs per grease type, which suggest that other intrinsic grease properties may have an influence on the partial collapse of the grease matrix. To our knowledge, this onset does not correspond to any mechanical properties of the grease, such as the yield stress measured by oscillatory rheology or by cone penetration depth (Citation37). To further validate this hypothesis, other physical parameters like the stiffness of the grease matrix need to be investigated. Another explanation for the levelling off of the bleeding curves concerns the redistribution of oil in the blotting paper (Citation38), a process that drives the oil from the larger pores in the center of the oil stain towards the finer pores near the edge of the stain. The snapshots of an oil stain in reveal that the transmitted light intensity contrast at the edge of the stain is always lower than that near the grease patch. A similar phenomenon is also observed during the spreading of a drop of bled oil, see , where bleeding also slows down before the oil drop is fully absorbed by the paper. These observations indicate that redistribution of oil takes place all the time during grease bleeding. This redistribution results in a decrease of the effective paper permeability, which slows down the bleeding.
Fig. 4 a-e) Effective radius of the oil stain R versus square-root of time resulting from spreading of bled oil drops of various volume; f) normalized effective radius R/a of the oil stain versus normalised the square-root of time
or normalized time (inset) collapsed onto a single master curve. The colored symbols represent the experimental data (cyan: Li/SS; teal: Li/M; olive: PU/e; pink: LiC/PAO; and purple: CaS/M). Dashed lines represent the best fitting model curves
Characterizing the paper properties
Given in EquationEquation 7[7]
[7] , the grease bleeding dynamics is governed by the different between the driving pressure in the paper,
and its opposing counterpart in the grease matrix,
In order to compare the oil-grease affinity of the five grease which are made of different base oil with non-identical wetting properties, the driving capillary pressure for each type of bled oil needs to be characterized.
In our previous investigation, we determined for the bleeding of a polyurea grease from a capillary rise experiment (Citation31). However, this experiment requires long-term experimental data close to equilibrium so as to improve the reliability for the best fit-parameters, which is time consuming. Furthermore, side effects such as paper swelling or oil evaporation during the experiments are inevitable especially over long time. Therefore, in order to avoid long-term experiments, seven-day capillary rise experiments were only done using PU/e bled oil. Instead, we performed the oil spreading tests for about 30 minutes and the capillary rise experiments for 1000 seconds for all five bled oils.
Spreading of the bled oil drops
The spreading radius R of the oil stains resulting from bare drops of base oil of the five different greases have been plotted as a function of time in e. Similar to the grease bleeding curves, the oil spreading curves also show three regimes, among which the central one shows the Washburn-like behavior. In the initial regime, the effective radius of the oil stain grows rapidly, which is an artefact due to the spreading of the oil drop on top of the paper until the contact line pins (Citation39, Citation40). As the oil stain spreads further in the paper, following the Washburn-like behavior in region two, the oil drop on top of the paper is gradually depleted until all oil is absorbed by the paper, marking the onset of the third regime in which the spreading curves reach a plateau.
We like to fit our model to the Washburn-like regimes of the spreading curves, however, there is no clear distinction between the three regimes in a spreading curve. In this case, we arbitrarily selected with
being the onset of the plateau, to be the range for fitting. In this range, the model fits better to spreading curves for small drops (5-10 μL) as compared to the larger ones, because the latter may still be spreading slowly on top of the paper in this regime. Nevertheless, the spreading curves of the oil drops, regardless of what type of oil it is made of, collapses nicely onto the master curve for
when plotting the scaled radius R/a against the square-root of the scaled time
as presented in . The deviation between the master curve and the data at
caused by the spreading of the drop on top of the paper, was not taken into account in our modeling. Based on EquationEquation 7
[7]
[7] , with now
the product
of the paper permeability kp and the driving pressure
has been calculated from the values of the best-fit-parameters, i.e. the drop radius a and the spreading time ts, as given in :
[16]
[16]
The values of estimated from the spreading test are presented in .
Capillary rise of bled oils
Due to the limited applicability of our model and the arbitrarily chosen range for fitting, we also performed capillary rise experiments to get another independent value for In this test, we monitored the height of the rising oil front as a function of time. As shown in , the linear dependence of the rising height h on the square-root of time
confirms that the observation time is short when compared to characteristic rise time. Therefore,
can be calculated from the initial slope
[17]
[17]
Fig. 5 a) Height of the rising front of bled oils h versus square-root of time the linear dependence confirms that the data are collected in a time range shorter than the characteristic rise time. b) h versus
Excluding the influence of bled oil viscosity η, bled oils Li/SS, Li/M and PU/e rise faster than LiC/PAO and CaS/M. Cyan: Li/SS; teal: Li/M; olive: PU/e; pink: LiC/PAO; and purple: CaS/M
The values of for the bled oils determined by the capillary rise follow the same trend as compared to those obtained from the oil spreading tests, as shown in . The small difference between the values obtained from the two methods is mainly because we track the height of the oil front during the capillary rise rather than the effective rising height.
Discussion
Capillary pressure in the grease matrix
The characteristic oil drop spreading time, ts, and the characteristic grease bleeding time, tb, based on EquationEquations 16[16]
[16] and Equation7
[7]
[7] , are governed by the capillary pressure in the paper and the different between the capillary pressure in the paper,
and in the the grease,
respectively. Therefore, the capillary pressure in the grease can be determined by subtracting these two values:
[18]
[18]
where parameters
and
are obtained from the best fits of the oil drop spreading and grease bleeding tests (see ). Since the same type of paper is used as in our previous studies (Citation31), taking the paper permeability previously determined,
, these retaining pressures in the five grease matrices turn out to be around 400-600 pascal. These values have not only high uncertainty (about 40%) but also an underestimated order of magnitude. During our 5-day capillary rise test for PU/e bled oil (see ), the height of the oil has reached 0.12 m, corresponding to a hydrostatic pressure of about 1 kPa, while the rising height was still far from equilibrium. Therefore, Δpg >> 1 kPa.
Fig. 6. a) Values of determined by the initial-stage capillary rise test (red) and by the oil spreading tests (blue); b) values of
(red), which is proportional to the absolute values of
estimated using kp = 0.16 μm2 (blue)
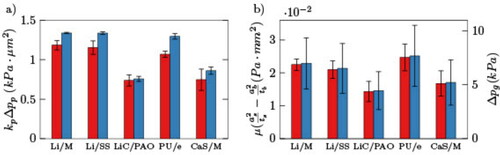
Fig. 7. Capillary rise of the bled oil of PU/e grease (blue) and that of the polyurea grease taken from (Citation31). Height of the rising front is plotted versus a) time and b)square-root of time. Scatters indicate experimental data and dashed lines are the best fits at various local minima. The fit-parameters ( and tr) and the corresponding paper properties (
and kp of the fits are given in c)
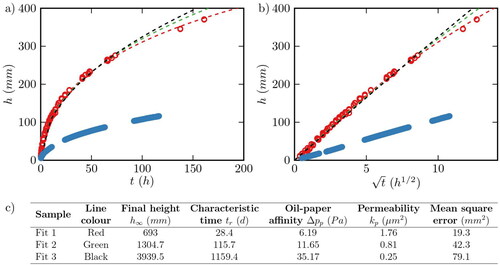
The underestimation of the capillary pressures is probably due to an overestimation of the paper permeability in our previous work. Based on the 5-day capillary rise dynamics of PU/e bled oil, the height of oil at equilibrium should be at least about 0.8m, which corresponds to Besides,
is determined to be about 1.1
according to the initial slope of the first 900 seconds capillary rise. In this case, the paper permeability is at most 0.16
which is only about 1/10 of the paper permeability determined in our previous work. The overestimation of paper permeability is possible, as the fit-parameters for capillary rise tests are correlated (Citation31) and it is thus very likely to fall into local minima during fitting. A few fits corresponding to a paper permeability ranging from 0.25- 1.76
within the experimental error, for the capillary rise data in our previous work are given in . Furthermore, the redistribution of oil which also takes place during capillary rise may also contribute to the overestimation of the paper permeability.
Oil-matrix affinity
As discussed earlier in section 4.3, both the driving and retaining pressure, and
can be regarded from the perspectives of wetting affinities determined by two aspects: the specific wetting area per unit liquid volume, depending on the microstructure of the paper or the grease; and the difference in interfacial tensions at wet and dry surface of paper or grease fibres,
We can also use this tool to evaluate and estimate the order of magnitude of the oil-matrix affinities.
The geometric factor of the paper was determined to be about 0.8
based on the pore size distribution measured using mercury porosimetry (Citation31). Using the paper permeability of 0.16
is determined to be around 9 mN/m, which is also of the same order of magnitude of the surface tension of the bled oil (about 30 mN/m), indicating that the estimated paper permeability is in a reasonable range. The corresponding oil-grease matrix affinity,
will then be about 6-7 kPa. Since the bled oil has a high affinity for the grease matrix,
should be approximately the same as the surface tension of the bled oil, around 30 mN/m. This requires a wetting-area-to-liquid-volume ratio,
of 0.3
and correspondingly the grease fibers of an average diameter of up to 3 μm. However, SEM and AFM images have revealed that the grease fibers of the same type of greases are typically not thicker than 0.2 μm (Citation41). Therefore, it is likely that the oil-grease matrix affinity is slightly underestimated.
With this large inaccuracy, the oil-grease matrix affinities of the five types of greases cannot be compared directly. Nevertheless, the retaining pressure in the grease matrix, is proportional to
according to EquationEquation 18
[18]
[18] . Comparing these relative values in , the oil-matrix affinity of the five greases from low to high are: LiC/PAO, CaS/M < Li/M, Li/SS and PU/e.
Since the timescale of oil drop spreading is much shorter than that of grease bleeding (), as shown in , the values of
in follow the same trend as
in (
). Therefore, the capillary rise test can be used as a rapid method for comparing the oil-matrix affinity of different greases. As shown in , after excluding the influence of bled oil viscosity η, the capillary rise rate of the bled oil from slow to fast are: CaS/M, LiC/PAO < Li/M, Li/SS and PU/e, which is consistent with the sequence of oil-grease matrix affinity according to . Similar experiments such as comparing the spreading dynamics of an oil drop of the same volume can also be use as a fast method for comparing oil-grease matrix affinities.
Applications and outlook
Our model is essentially a modification of Darcy’s law, which is generally used for describing grease bleeding, with a physical parameter, i.e. capillary pressure in the grease matrix that slows down bleeding, incorporated. The bleeding of grease is actuated by the capillary action of paper while the grease bleeding dynamics is described as a balance between the driving capillary pressure in the paper and an opposing capillary pressure in the grease matrix due to the affinity of base oil to the grease matrix. The same principle applies also for grease bleeding in a bearing. Since the grease matrix is considered intact during bleeding, this model can be used for describing the bleeding of stationary greases in a bearing, which is located in places such as the seal that are free from the massive centrifugal forces. Prediction of grease bleeding in a bearing will require not only well-characterized oil-grease affinity but also the affinity of bled oil for the bearing surface that drives the bleeding. Additionally, determination of grease matrix permeability, kg may also be necessary, using e.g. Fan’s method (Citation42).
Another application of the model is to characterize the bleeding properties of grease in a bearing ex situ by testing grease sampled from the bearing during maintenance. In fact, the inspiration of our test configuration (Citation35) was developed for this purpose. Since the bled oil presumably undergoes few changes during operation, the driving pressures for the bleeding of these greases are identical. Therefore, the change in oil-grease matrix affinity, which suggests a change in grease’s microstructure and consequently a change in bleeding tendency, as compared to the fresh grease can be characterized.
On the other hand, our model has some limitations. First of all, the grease matrix in our model is considered to be non-deformed during the whole bleeding process, which may not occur in practice. The grease matrix may undergo partial collapses over long term bleeding as the oil is continuously depleted. Studying the relation between the oil content and oil-matrix affinity of the grease might be essential for improving the prediction of grease bleeding over long term. Furthermore, the grease reservoir in a bearing does not necessarily remain stationary all the time. Zhou’s AFM images of greases taken from the shields of 6209 bearings after 100 hour’s operation shows various extents of mechanical degradation (Citation43). Therefore, it may also be of interest to study the influence of mechanical degradation on grease’s bleeding properties.
Conclusion
Bleeding of five commercial ball bearing greases are studied using a grease-on-paper test configuration. The oil-grease matrix affinity, which holds up the oil in the grease matrix due to capillary pressure, is determined using a Washburn-like model modified based on Darcy’s law. This oil-grease matrix affinity is influenced by both the microstructure of the grease and by the difference between the surface tension of a wet and dry grease fibre surface. Unfortunately, since the paper properties, i.e. the paper permeability, kp, and the oil-paper affinity
cannot be accurately characterized, it is not possible to precisely determine the absolute value of the oil-grease matrix affinity,
Based on the available results, the order of magnitude of
most likely 1-10 kPa, suggesting that there has to be a driving pressure of at least the same order of magnitude for grease bleeding to take place in a bearing at room temperature. The minimum driving force may vary at operation temperature, which is usually much higher than the room temperature, as wetting affinities change as a function of time.
Although the application of this test configuration is limited as characterization of oil-grease matrix affinity remains challenging, this method can be used to probe the difference in the bleeding properties of greases made of the same base oil. This applies to problems where the evolution of grease microstructure is important, for example, during maintenance, where grease samples are regularly taken from bearings to identify if the grease would still show enough bleed.
Next to the intrinsic bleeding properties of the greases, the external driving pressure/affinity, also plays an important role on the grease bleeding dynamics. Since the different in oil-paper and oil-grease matrix affinity,
which governs the grease bleeding dynamics, is typically very small as compared to the oil-paper affinity, the oil drop spreading dynamics can be used as a tool to quickly compare the oil-matrix affinities of greases made of different base oil, although with slightly less accuracy.
The model developed for this test configuration can also serve as a building block of the grease life model for predicting the evolution of grease bleeding in a bearing. Here, the properties of the grease change in time mainly due to “shear aging”, and the model can be used to calculate the corresponding changes in grease’s bleeding property. Moreover, the model gives us the order of magnitude of the pressures required to provide sufficient grease bleed in a bearing. The next step is to identify the source of these pressures in a bearing. This helps us in our quest to identify the exact lubrication mechanisms in grease lubricated rolling bearings.
| Nomenclature | ||
| Latin | = | |
| Apx | = | Pixel area, |
| a | = | Base radius of the grease patch, mm |
| b | = | Thickness of the paper, mm |
| = | constants, – | |
| cg | = | Specific wetting area per mm3 grease volume, |
| = | ||
| g | = | Gravitational acceleration, |
| h | = | Height of oil front in the grease matrix during grease bleeding, or in the paper during capillary rise, mm |
| h0 | = | height of the grease patch, mm |
| I | = | Intensity, – |
| i, j | = | Coordinates for a image, – |
| kg, kp | = | Permeability of grease matrix/paper, |
| m | = | Mass of oil, mg |
| = | Number density of thickener fibres of radius between s and s + ds; | |
| p | = | Pressure, Pa |
| pa | = | Pressure in the paper at r = a, Pa |
| pb | = | Average pressure in the grease at z = 0, Pa |
| V | = | Volume, mm3 |
| v | = | Velocity, mm/s |
| Q | = | Flux, |
| R | = | Effective radius, mm |
| R fr | = | Front radius, mm |
| Rmax | = | Maximum effective radius, mm |
| r, z | = | Coordinate systems, – |
| S | = | Integrated intensity, – |
| = | Integrated saturated intensity, – | |
| s | = | Thickener fibre radius, mm |
| t | = | Time, s |
| = | Characteristic spreading/grease bleeding/capillary rising time, s | |
| tmax | = | The time at which the oil drop is fully absorbed by paper, s |
| w | = | Constant, initial slope of height versus square-root of time, |
| Greek | = | |
| β | = | Constant, – |
| γ | = | Interfacial tension, N/m |
| = | Capillary pressure in grease matrix/paper, Pa, kPa | |
| = |
| |
| η | = | Viscosity, |
| ξ | = |
|
| = | Porosity/volume fraction of grease matrix/paper, – | |
| ρ | = | Density of oil, |
| τ | = | Dimensionless time |
| Subscript | = | |
| bg | = | Background |
| g | = | Grease |
| l | = | Liquid |
| p | = | Paper |
| r, z | = | radial and vertical directions/capillary rise |
| = | Infinity/ambient | |
Acknowledgements
This research was carried out under project number S21.1.15582 in the framework of the Partnership Program of the Materials innovation institute M2i (www.m2i.nl) and the Technology Foundation STW (www.stw.nl), which is part of the Netherlands Organization for Scientific Research (www.nwo.nl). Part of the funding was provided by SKF Research and Technology Development.
References
- Stempfel, E. M. and Schmid, L. A. (1991), “Biodegradable lubricating greases,” NLGI Spokesman, 55(8), pp 25–33.
- Evans, D., Hutton, J. F., and Matthews, J. B. (1952), “The influence of soap-phase structure on some physical properties of lithium greases,” Journal of Applied Chemistry, 2(5), pp 252–262. doi:https://doi.org/10.1002/jctb.5010020507
- Montmitonnet, P., Monasse, B., Haudin, J., and Delamare, F. (1983), “Etude des transitions de phases du stearate de lithium: influence de l’histoire thermique,” Journal of Thermal Analysis and Calorimetry, 26(1), pp 117–130. doi:https://doi.org/10.1007/BF01914096
- Terech, P. and Weiss, R. G. (1997), “Low molecular mass gelators of organic liquids and the properties of their gels,” Chemical reviews, 97(8), pp 3133–3160. doi:https://doi.org/10.1021/cr9700282
- Kobylyanskii, E. V., Kravchuk, G. G., Makedonskii, O. A., and Ishchuk, Y. L. (2002), “Structure of ultrabasic sulfonate greases,” Chemistry and technology of fuels and oils, 38(2), pp 110–114. doi:https://doi.org/10.1023/A:1015614207994
- Authier, D. and Herman, A. (2013), “Calcium sulfonate carbonate greases: a solution to water resistance,” Eurogrease (3), pp 19–35.
- Bosman, R. and Lugt, P. M. (2018), “The microstructure of calcium sulfonate complex lubricating grease and its change in the presence of water,” Tribology transactions, 61(5), pp 842–849. doi:https://doi.org/10.1080/10402004.2018.1431752
- Shuff, P. J. and Clarke, L. J. (1991), “The structure of grease via electron microscopy and image analysis,” Lubrication Science, 4(1), pp 35–50. doi:https://doi.org/10.1002/ls.3010040105
- Magnin, A. and Piau, J. M. (1989), “Application of freeze-fracture technique for analyzing the structure of lubricant greases,” Journal of Materials Research, 4(4), pp 990–995. doi:https://doi.org/10.1557/JMR.1989.0990
- Harris, J. H. (1972), The lubrication of rolling bearing. Shell International Pertoluem Company Limited.
- Lugt, P. M., van den Kommer, A., Lindgren, H., and Roth, C. (2013), “The R0F + methodology for grease life testing,” NLGI Spokesman, 77, pp 31–40.
- Wilcock, D. and Anderson, M. (1949), “Grease - an oil storehouse for bearings,” in Symposium on Functional Tests for Ball Bearing Greases, ASTM International.
- Lugt, P. M. (2012), Grease lubrication in rolling bearings. John Wiley & Sons.
- Osawa, H. and Okaniwa, T. (1999), “Lubrication of Japanese bullet train traction motor,” NLGI Spokesman, 62(10), pp 22–27.
- Lugt, P. M. and Morales-Espejel, G. E. (2011), “A review of elasto-hydrodynamic lubrication theory,” Tribology Transactions, 54(3), pp 470–496. doi:https://doi.org/10.1080/10402004.2010.551804
- Chevalier, F., Lubrecht, A. A., Cann, P. M. E., Colin, F., and Dalmaz, G. (1998), “Film thickness in starved EHL point contacts,” J. Tribol.
- Damiens, B., Venner, C. H., Cann, P. M. E., and Lubrecht, A. A. (2004), “Starved lubrication of elliptical ehd contacts,” J. Trib., 126(1), pp 105–111. doi:https://doi.org/10.1115/1.1631020
- Calhoun, S. F. (1958), “The ordnance corps looks into grease bleeding,” NLCI Spokesman, 22(2), pp 69–84.
- Baart, P., van der Vorst, B., Lugt, P. M., and van Ostayen, R. A. J. (2010), “Oil-bleeding model for lubricating grease based on viscous flow through a porous microstructure,” Tribology Transactions, 53(3), pp 340–348. doi:https://doi.org/10.1080/10402000903283326
- Horth, A. C., Norton, J. H., and Pattende., W. C. (1971), “Temperature rise characteristics of greases in rolling element bearings,” Lubrication Engineering, 27(11), p 380.
- Baker, A. E. (1958), “Grease bleeding—a factor in ball bearing performance,” NLGI spokesman, 22(9), pp 271–277.
- Hibino, S. (2001), “Lubricating of motion of grease in the bearing of induction motor,” in Proc. Int. Trib. Conf.
- Hibino, S., Hosoya, T., Nakamura, K., Matsuoka, K., Nagayama, T., Kitamura, M., and Sunohara, T. (2008), “A new grease-pocket shape to extend the service life of grease,” Tribology Online, 3(2), pp 54–58. doi:https://doi.org/10.2474/trol.3.54
- Saatchi, A., Shiller, P. J., Eghtesadi, S. A., Liu, T., and Doll, G. L. (2017), “A fundamental study of oil release mechanism in soap and non-soap thickened greases,” Tribology International, 110, pp 333–340. doi:https://doi.org/10.1016/j.triboint.2017.02.004
- Peterson, W. H. and Bondi, A. (1953), “A study of soap aerogels from lubricating greases,” The Journal of Physical Chemistry, 57(1), pp 30–35. doi:https://doi.org/10.1021/j150502a007
- Bauer, W. H., Finkelstein, A. P., and Wiberley, S. E. (1960), “Flow properties of lithium stearate-oil model greases as functions of soap concentration and temperature,” ASLE Transactions, 3(2), pp 215–224. doi:https://doi.org/10.1080/05698196008972406
- Hermansson, M., Johansson, E., and Jansson, M. (1996), “Self-diffusion of oil in lubricating greases by NMR,” Journal of Synthetic Lubrication, 13(3), pp 279–288. doi:https://doi.org/10.1002/jsl.3000130304
- Ishchuk, Y. L. (2006), Lubricating grease manufacturing technology. New Age International.
- Donahue, C. J. (2006), “Lubricating grease: a chemical primer,” Journal of chemical education, 83(6), p 862. doi:https://doi.org/10.1021/ed083p862
- Liu, L. and Sun, H. (2010), “Impact of polyurea structure on grease properties,” Lubrication Science, 22(9), pp 405–413. doi:https://doi.org/10.1002/ls.140
- Zhang, Q., Mugele, F., Lugt, P., and van den Ende, D. (2020), “Characterizing the fluid-matrix affinity in an organogel from the growth dynamics of oil stains on blotting paper,” Soft Matter, 16, pp 4200–4209. doi:https://doi.org/10.1039/c9sm01965k
- Bremond, F., Cayer-Barrioz, J., and Mazuyer, D. (2011), “Imbibition d’un contact statique texturé,” in Congrès français de mécanique, AFM, Maison de la Mécanique, 39/41 rue Louis Blanc, 92400 Courbevoie, France.
- van Zoelen, M. T., Venner, C. H., and Lugt, P. M. (2008), “Free surface thin layer flow on bearing raceways,” Journal of tribology, 130(2), p 021802.
- van Zoelen, M. T., Venner, C. H., and Lugt, P. M. (2010), “Free surface thin layer flow in bearings induced by centrifugal effects,” Tribology transactions, 53(3), pp 297–307. doi:https://doi.org/10.1080/10402000903283284
- Noordover, A., David, S., Fiddelaers, F., and van den Kommer, A. (2016), “Grease test kit and methods of testing grease,” 16, pp 4200–4209. US Patent 9,341,611.
- Klemgard, E. N. (1937), Lubricating greases: their manufacture and use. Reinhold publishing corporation.
- Cyriac, F. (2016), On rheology, film-build-up and water in grease lubricated bearings. PhD thesis, University of Twente.
- Danino, D. and Marmur, A. (1994), “Radial capillary penetration into paper: limited and unlimited liquid reservoirs,” Journal of colloid and interface science, 166(1), pp 245–250. doi:https://doi.org/10.1006/jcis.1994.1290
- Wemp, C. K. and Carey, V. P. (2017), “Water wicking and droplet spreading on randomly structured thin nanoporous layers,” Langmuir, 33(50), pp 14513–14525.
- Poudel, S., Zou, A., and Maroo, S. C. (2019), “Wicking in cross-connected buried nanochannels,” The Journal of Physical Chemistry C, 123(38), pp 23529–23534.
- Cyriac, F., Lugt, P. M., Bosman, R., Padberg, C. J., and Venner, C. H. (2016), “Effect of thickener particle geometry and concentration on the grease ehl film thickness at medium speeds,” Tribology letters, 61(2), p 18. doi:https://doi.org/10.1007/s11249-015-0633-z
- Fan, C.-S. (1968), “Permeability and additive sorption and extraction in lubricating greases,” Master’s thesis, University of Missouri at Rolla.
- Zhou, Y. and Lugt, P. M. (2020), “On the application of the mechanical aging master curve for lubricating greases to rolling bearings,” Tribology International, 141, p 105918.