
 ?Mathematical formulae have been encoded as MathML and are displayed in this HTML version using MathJax in order to improve their display. Uncheck the box to turn MathJax off. This feature requires Javascript. Click on a formula to zoom.
Abstract
Research into sensory utilization of the impedance measurement of rolling bearings has been intensifying for several years. However, publications in this area are mainly limited to theoretical models and experiments under laboratory conditions. In this contribution, the concept of measuring the impedance of rolling bearings for sensory utilization is implemented within a machine tool spindle. Machine tools can be found in almost all manufacturing companies for the production of components, complete products or prototypes and are therefore one of the most important and relevant production systems. The most common cause of failure is component failure, especially the rolling bearings of the spindle. Failure of the rolling bearings is often the result of incorrect operation and/or overloading. A preventative approach is the sensory monitoring of operating variables. In this work, the spindle design is modified to implement the impedance measurement of rolling bearings and then tests are carried out at free-running and under load. The impedance measurement is analyzed in time and frequency domain. Ultimately, an initial suggestion is made for features in the impedance signal that can be related to various operating parameters.
Introduction
Machine tools can be found in almost all manufacturing companies for the production of components, complete products, or prototypes and, therefore, are one of the most important and relevant production systems. Machine tools are known for their ability to perform high-precision tasks for the production of workpieces. Possible fields of application include turning, milling, drilling, and engraving.
Despite their great popularity, machine tools also have disadvantages. One of these is the high complexity of the machine and the fact that a failure of a single component can often lead to a loss of functionality of the entire machine. The rolling bearings of the rotating spindle of the machine tools are particularly susceptible to failure. These can be caused by operating errors or tool wear, which can lead to short-term or long-term overloading of the bearings and ultimately to failure. If the spindle bearings fail unexpectedly during operation, this can lead to damage to the rest of the machine tool and therefore to longer downtimes as well as risks to the operator’s safety. Knowledge of the operating conditions can help to prevent these scenarios. The introduction of sensors, for example through retrofitting, can help to gain knowledge of the operating conditions and lay the foundation for digitalization. (Citation1)
For this purpose, the sensory capabilities of the rolling bearings can be utilized through impedance measurement to detect bearing damages, (Citation2) lubrication condition, (Citation3) monitor run-in processes, (Citation4) or detect bearing loads as in this work. This takes advantage of the fact that the inner ring, outer ring and rolling element components are separated by the lubricating film during operation and form a capacitance network. During operation, the parameters of this capacitor network change, which is reflected in a measurable change in impedance. This sensory usability of the rolling bearing impedance has been proven in numerous preliminary studies through tests under laboratory conditions, simulations, and theoretical explanatory approaches. (Citation3,Citation5,Citation6) A practical implementation of the sensory utilization of the impedance measurement of rolling bearings in a larger, real system cannot be found in the literature. In this contribution, this is to be addressed through the practically implementation of impedance measurement on the bearings of a machine tool. The following research questions (RQ) are addressed:
Research Question 1 (RQ1): How does the impedance change under different real operating conditions of the spindle?
Research Question 2 (RQ2): How do the interactions with the rest of the spindle system influence the measurement signal?
Research Question 3 (RQ3): To what extent can the impedance measurement be used as a sensor in practice?
Materials and methods
In the following, the fundamentals necessary for this contribution are presented. This includes the basics of tool machines and their spindles, as well as the theoretical principles of impedance measurement in rolling bearings.
Machine tools and spindles
Machine tools are of great economic importance and are the second largest industrial sector in Germany. The designation of the respective machine tool is based on the manufacturing process and the degree of automation. The basic requirements for machine tools are rigidity, geometric, and kinematic accuracy, environmental behavior, safety, and automation. (Citation7) A key component of machine tools is the spindle. The main tasks of a machine tool spindle are (Citation8,Citation9):
rotation of the tool (drilling, milling, and grinding) and/or the workpiece (turning) at the interface with sufficient kinematic accuracy
absorption of external forces, such as workpiece or tool weight and cutting force with low static, dynamic, and thermal displacements
transmission of required energy to the cutting zone for chipping
A spindle can be classified according to the type of drive or the target application. A distinction can be made between turning, milling, and grinding spindles or between externally and directly driven spindles. The most important distinguishing features are the load to be picked up, the achievable speed, and the dynamics required of the spindle in terms of movement through the installation space. The static, dynamic, and thermal behavior of a spindle bearing system depends directly on the accuracy and surface quality of the machined workpieces as well as the cutting performance of a machine tool. Therefore, the design of the spindle assembly is of central importance, with a focus on the selection of a suitable bearing arrangement or bearing position. Bearings of main spindles are divided into rigidly adjusted, elastically adjusted, and fixed/loose bearings. These three principles differ particularly in the achievable stiffness and speed characteristics. (Citation9)
As critical components in machine tools, motor spindle bearings are exposed to considerable mechanical loads and vibrations during operation. The main cause of spindle failures is damaged bearings. (Citation10) To prevent premature failures, minimize downtimes and optimize maintenance strategies, monitoring the bearing load is highly relevant. (Citation11) Angular contact ball bearings are mostly used in motor spindles. The lubrication of ball bearings depends on the specific speed factor, which is the product of the limit speed in rpm and the pitch diameter, which in return is the mean of inner and outer diameter of the bearing. The speed factor with grease is up to 1,800,000 mm/min and with oil/air even faster. At high speeds, the balls are made of ceramic to reduce the centrifugal forces on the balls by 60%. The radial rigidity is dependent on the speed, primarily due to the changing contact angles. (Citation8)
Impedance measurement in rolling bearings
The electrical impedance describes the relation between an alternating voltage and current of a two-terminal circuit element (e.g., a simplified bearing). Its characteristic can be approximated by a parallel connection of a capacitance and a resistance
thus the complex impedance
yields EquationEq. [1]
[1]
[1]
[1]
[1]
with the imaginary unit
and the angular frequency of the alternating voltage
(Citation3,Citation12) In reverse, the equivalent parallel capacitance and resistance of a measured complex impedance can be calculated.
A rolling bearing in an electric circuit is connected to the shaft via the inner ring and to the housing—if not insulated—via the outer ring (). Both rings are separated by rolling elements, which are typically made out of steel as well as the rings. Therefore, the rolling element-raceway contacts contribute most significantly to the electrical behavior of the bearing. (Citation13) Each contact can be electrically simplified to a parallel connection of a resistor and a capacitor. (Citation14) Their respective values depend on load, geometry, lubrication, temperature, and rotational speed. Especially the friction condition has a high influence. In this publication, the focus is on elastohydrodynamic lubrication (EHL) where for typical lubricants the resistance becomes rather large due to the separated contact surfaces and the high specific resistance of the lubricant. Therefore, at frequencies in the kHz or MHz regime, the resistance has a minor influence. (Citation15)
Figure 1. Schematic representation of the main contributors to a rolling bearing’s impedance: (a) Equivalent circuit of a rolling bearing consisting of contact capacitances. (b) Equivalent circuit of a contact capacitance consisting of the Hertzian and the outside area.
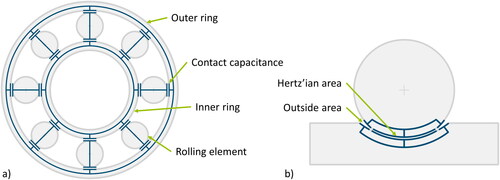
The capacitance of each contact can be estimated starting from the so-called Hertzian area According to Hertz’ theory, (Citation16) the load causes the rolling element and the raceway to deform (). With the central lubricant film thickness
and the permittivity of the lubricant
the electrical capacitance of this area can be calculated as EquationEq. [2]
[2]
[2]
[2]
[2]
A higher load causes a larger Hertzian area, a slightly smaller lubrication film thickness, and, therefore, an increase in capacitance and a decrease in impedance. Furthermore, the area outside the Hertzian area contributes significantly to the total capacitance and should therefore be considered. Former works used constant factors, (Citation17,Citation18) then calculations for the correction factor where introduced. (Citation19,Citation20) Other approaches supersede the need for correction factors by considering the outside area and unloaded rolling elements quantitatively. This can be achieved by numeric or semi-analytic calculation of the respective capacitance contribution. (Citation21–26) The cage of the bearing used in this publication is made of plastic, therefore, the electrical influence of the cage is neglected.
Design of the sensor spindle
As part of this project, the principle of impedance measurement is applied to a machine tool spindle. Technical details such as bearing manufacturer, lubricant type, lubricant manufacturer, and preload force are deliberately not specified here in order to protect the corporate interests of our industrial partners. This spindle has a total of three bearing positions in an O-arrangement. The front bearings B1 and B2 are single spindle bearings, while the rear bearing position consists of two tandem-mounted bearings and is referred to as B34. In order to be able to implement the measuring principle at each of the bearing positions, minor adaptations had to be made to the spindle. As the tool spindle, manufactured by Christ Feinmechanik, is a product that is already used in DATRON machine tools, the extent of the modification should be kept to a minimum.
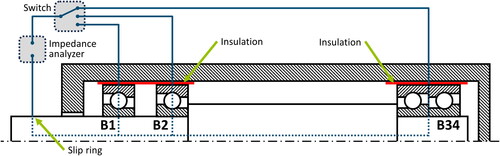
Ideally, the impedance measurement of the bearing is carried out between the inner and outer ring. In practice, however, it is not possible to contact the rotating inner ring within the tool spindle. Instead, the spindle shaft in contact with the inner rings was contacted via a slip ring. This enables current or voltage to be transmitted to the inner rings. The stationary outer rings can each be contacted with a contact pin due to a modification of the housing. In order to minimize interference from the rest of the spindle to the bearings, the bearings have to be insulated from the rest of the system. For this purpose, the bearing seats were provided with an insulating ceramic coating. This means that commercially available rolling bearings can still be used. As the bearings must be suitable for transmitting current or voltage, spindle bearings with 100Cr6 steel rolling elements, specifically, spindle ball bearings of type 7005, are used. The bearings are lubricated with grease and are in the range of full lubrication. The properties and interactions of the lubricating film, such as the exact lubrication film height in the individual load cases, the electrical properties of the lubricating grease and potential tribochemical phenomena and mechanisms undeniably have an influence on the measured impedance. However, the investigation of these is a complex endeavor and should be part of further fundamental research. Due to the practical focus of this article, which is intended to describe a proof of concept of practical applicability, this is not considered in detail.
As previously described, the impedance is highly dependent on the temperature inside the bearing. Temperature sensors were integrated into the outer rings in order to measure the temperature. This allows temperature influences on the impedance, which add to the desired load influences, to be identified and compensated for. However, during the experiments conducted for this article, no significant temperature fluctuations were observed, which also makes compensation obsolete.
Small adjustments were also necessary to accommodate the cables and connectors. shows the layout schematically. The path of the current/voltage is shown in green. The red separations between the bearings and the housing represent the insulation layers.
Figure 2. Schematic of the spindle with the three bearing points B1, B2, and B34 and the current/voltage flow for the impedance measurement.
Experiments
The following section describes the setup and how the measurements were carried out on the spindle. During the tests, the spindle was not installed in the overall system of the machine tool, instead, the spindle was mounted on a test desk. The aim was to be able to assign observations directly to the spindle without having to consider interactions with the machine tool. As the spindle was in a horizontal position during the tests, a radial force is applied by the dead weight of 5,6 kg of the shaft. The spindle bearings are preloaded by an axial spring force. All tests were carried out in a warmed-up condition, were short and separated by breaks. There was no significant change in temperature during or between the tests. For this reason, the influence of temperature on the impedance is not discussed in detail in the following sections.
The impedance measurement was carried out with an MFIA impedance analyzer from Zurich Instruments. (Citation27) An oscillator frequency of 100 kHz and a sampling rate of 107 kS/s were used. As the MFIA impedance analyzer is only able to measure one bearing at a time, three separate measurements were carried out for each operating parameter investigated (see the following section): One for each of the three bearing positions B1, B2, and B34.
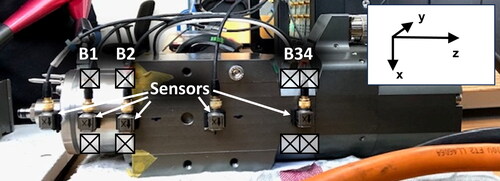
In addition to the impedance measurement, a vibration measurement was carried out to record the structural-dynamic spindle properties. A Brüel & Kjær vibration measurement system with Type 3660-C LAN-XI Frame for 5 Modules is used. There are five triaxial Type 4524-B triaxial piezoelectric CCLD acceleration sensors with a single resolution of 10 mV/g installed in the test setup for this purpose. Three sensors were mounted at the three bearings, another sensor in the middle of the spindle and the last one at the foremost point of the spindle. This enables comprehensive recording of vibrations across the entire spindle (cf. ). The signal frequency is set to 25.6 kHz and the sampling frequency is at 65.536 kHz. The measurement evaluation is done with the BK-Connect Software by Brüel & Kjær.
Figure 3. Test setup on the spindle with bearing points B1, B2, and B34 and the sensors.
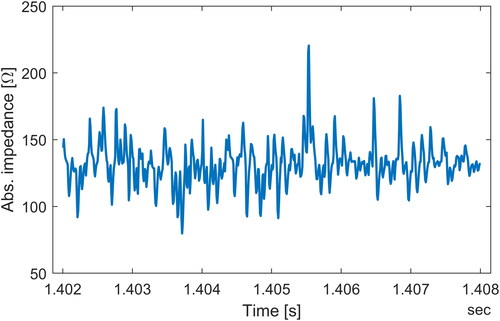
shows an exemplary plot of the measured impedance in the time domain over one revolution. A superposition of a large number of influence factors and frequencies can be recognized.
Figure 4. Time signal of the absolute impedance of bearing B2 during a free-running test at 10,000 rpm for one shaft rotation (6 ms).
The experiments of the spindle can be divided into two aspects; free-running tests and tests under load. The tests on bearings B1 and B2 led to similar results. For this reason, the results of the free-running tests are described using the example of B1 and the results of the tests under load using B2.
Free-running tests
During the free-running tests, defined speeds between 5,000 and 30,000 rpm were approached and held. After a run-in phase at the corresponding speed, measurements were carried out for 20 s in each case. These tests were carried out in increments of 5,000 rpm. In addition, ramp-up and ramp-down runs were carried out in which the spindle was continuously accelerated from 0 to 30,000 rpm over a period of 30 s with constant acceleration, or decelerated from 30,000 rpm to standstill over the same time period. During this time, a continuous measurement was carried out over the entire period.
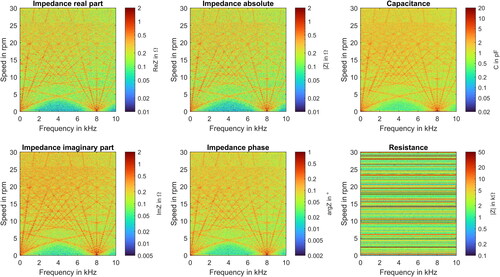
In the following, the results of the spindle ramp-ups and ramp-downs are presented using bearing B1. To evaluate the ramp-ups and ramp-downs, waterfall diagrams are used. For this purpose, the data from the 30-second measurement is first divided into 300 data packets, each with a length of 0.1 s. A fast Fourier transformation (FFT) is then carried out for each data packet in order to convert the data into the frequency domain. The FFTs of the individual data packets are then displayed graphically in a waterfall diagram. Each line of the Y-axis represents a data packet respectively the speed present at that time, while the frequencies of the FFTs are plotted on the X-axis. The amplitudes of the FFTs are represented by the colors within the waterfall diagram.
shows the waterfall diagrams during the ramp-up for the imaginary and real parts as well as the absolute value of the impedance. Waterfall diagrams of the phase angle and the capacitive and resistive behavior are also shown. All diagrams are similar, with the exception of the resistive behavior. During the operation, the rolling element, inner ring and outer ring are completely separated by the lubricant. The resistive behavior therefore results primarily from the electrical resistance of the lubricant. With changing parameters such as lubricant thickness or the Hertzian area caused by a rolling element passing through the load zone, the resistive behavior is expected to change in a similar way to the other parameters. One explanation is that this change in behavior is small and the measurement uncertainty in this region rather high. Stochastic contacts of roughness peaks or electric discharges change the resistive behavior significantly for a short interval, which strongly superimposes the expected behavior. This is reflected in the diagrams in . In the following only the diagrams of the absolute value of the impedance are used. However, it should be noted that for all results shown in this article, the diagrams of real and imaginary impedance as well as the phase angle and the capacitive behavior are similar.
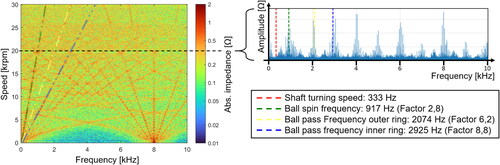
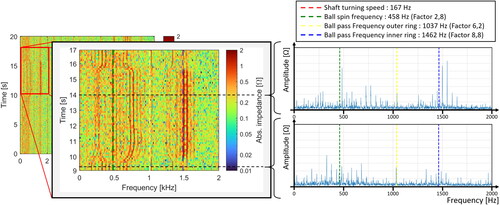
on the left shows the waterfall diagram of the absolute value of the impedance of bearing B1 during the ramp-up in detail. The amplitude peaks of the individual FFTs describe several straight lines which intersect in two straight line clusters. On the right-hand side, shows a graphical representation of the FFT at 20,000 rpm, which was derived from one of the dedicated measurements at 20,000 rpm. It can be seen that the amplitude peaks, which describe the lines in the waterfall diagram, do not consist of one peak, but a sum of peaks. The highest main peak of each line lies approximately in the middle and has almost equidistant sidebands on both sides, which decrease with increasing distance from the main peak. The respective centers of the first three groups of peaks are located at the calculated frequencies of the ball spin frequency (BSF), the ball pass frequency outer ring (BPFO) and the ball pass frequency inner ring (BPFI). To determine these natural frequencies of the bearing, the corresponding factors were used, which were calculated using the equations provided by the bearing manufacturer for the unloaded bearing. The resulting natural frequencies can be determined by multiplying the shaft turning speed (STS) by the corresponding factors.
Figure 5. Comparison of different results of the impedance measurement at bearing B1 during a free-running ramp-up from 0 to 30,000 rpm.
According to literature, there are two causes for excitations of fundamental bearing frequency vibrations: First, the variable elastic compliance and, second, all inevitable geometry imperfections. (Citation28) Vibrations in return affect the lubrication film and Hertzian area slightly, causing a change in the frequency domain of the impedance. Furthermore, like the variable elastic compliance, the finite number of rolling elements also causes a change in total capacitance due to the non-linear behavior. (Citation15)
The left-hand straight-line cluster has its intersection point/origin at a speed of 0 rpm and a frequency of 0 Hz. Each line of this cluster describes a linear behavior between speed and frequency, each with a different factor/coefficient. The first three coefficients correspond exactly to the factors for BSF, BPFO, and BPFI. These factors and the resulting frequencies are highlighted in . Green stands for the ball spin frequency (), yellow for the ball pass frequency outer ring (
), and blue for the ball pass frequency inner ring (
). The lines that lie above the BPFI cannot be directly assigned to the bearing frequencies. Possible explanations could be modulation and superposition of signals or multiples of the natural frequencies of the bearing. Another possible explanation is natural oscillations in the system, which have an influence on the bearing load and/or lubricant thickness. It is noticeable that the actual speed frequency, which is still below the rolling element’s rollover frequency, cannot be observed in the waterfall diagram. One possible explanation for this is the good balancing quality of the spindle.
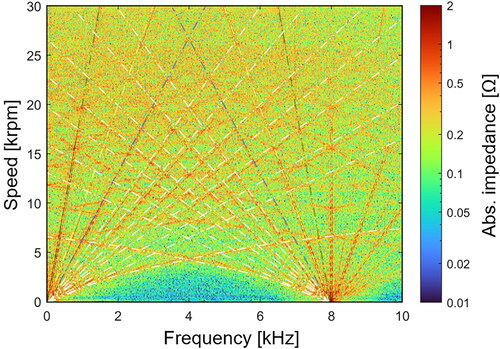
The right-hand cluster of lines has its intersection point/origin at a speed of 0 rpm and a frequency of 8 kHz. An explanation for this is the influence of the converter, whose converter frequency is 8 kHz. The cluster of straight lines is mirror-symmetrical to the inverter frequency of 8 kHz, so that it can be interpreted as sidebands of the inverter frequency. emphasizes this result. The lines of the left cluster were highlighted and shifted to the right cluster and mirrored. The gradients were not changed. They are all straight lines, except for the lowest line with the lowest gradient, which describes curves that are nevertheless identical. The outgoing straight lines have the same (or mirrored) inclines and thus the same factors as the cluster of straight lines discussed above, which starts at the origin. This applies to all visible straight lines and therefore also to the natural frequencies of the bearing. This means that this cluster of straight lines is a modulation of the natural frequencies of the bearing with the inverter frequency. The sidebands can therefore be described with EquationEq [3][3]
[3] :
[3]
[3]
Figure 6. Waterfall diagram of bearing B1’s absolute impedance during a free-running ramp-up from 0 to 30,000 rpm.
Using the example of the BPFO at a speed of 20,000 rpm, EquationEq. [4] is as follows:
[4]
[4]
It is noticeable that some natural frequencies are more clearly recognizable in their modulation with the inverter frequency than in their original straight-line cluster. This applies in particular to the ball pass frequency outer ring.
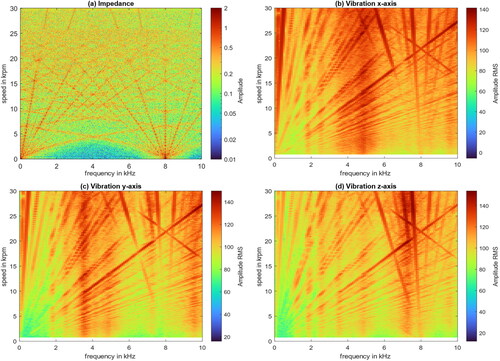
Parallel to the impedance measurements, the vibration of the system was also monitored in all three spatial directions as previously described. Of particular interest here is the comparison during ramp-up. For this purpose, the results for the three spatial directions of a sensor are also converted into waterfall diagrams. For better comparability, the data of the sensor at the already considered bearing position B1 is used for this purpose. shows the comparison of the waterfall diagrams of the impedance and vibration measurement for bearing B1 during ramp-up.
Figure 7. Highlighting of the modulation of the two line clusters in the waterfall diagram of impedance measurement at bearing B1 during ramp-up.
The results in all three spatial directions are almost identical. Similar to the results of the impedance measurement, two straight line clusters can be observed in the vibration measurement. One starts at 0 kHz and shows a linear relationship between speed and frequency. The second cluster of straight lines is approximately but not perfectly mirror-symmetrical to the inverter frequency at 8 kHz.
The left cluster has a much higher density of straight lines for vibration than for impedance. The straight lines of the natural frequencies of the bearing BSF, BPFO, and BPFI can therefore not be clearly identified. The vibration also shows both straight lines that are steeper (smaller factor) and straight lines that are flatter (larger factor) than in the impedance measurement. One possible explanation for this is that the vibration measurement is not carried out in-situ directly on the bearing like the impedance measurement, but ex-situ on the spindle housing. This makes it more sensitive to interactions with the rest of the system. This means that the vibrations of a large number of components installed in the spindle are measured. This makes it more difficult to identify and monitor the bearing behavior.
The right-hand straight-line cluster of the vibration measurement is not as dense as the left-hand cluster and only straight lines with a comparatively steep gradient can be seen. Furthermore, the right cluster is only approximately but not perfectly mirror-symmetrical. Some lines have a mirrored counterpart, while others do not. As with the impedance measurements, a possible explanation for the existence of the right cluster is that it is a modulation of the inverter frequency with the left cluster. In contrast to the impedance, however, this is more difficult to evaluate in the case of vibration. On the one hand, it can be assumed that not everything is recorded due to the imperfect symmetry and, on the other hand, the higher density of the left cluster makes it difficult to assign straight lines. Furthermore, the vibration waterfall diagrams show vertical lines, corresponding to resonance frequencies of both, the system and the transfer path to the sensor. Those have a minor influence on the impedance as any possible resonance frequencies of the electrical transfer path to the contact are outside the relevant bearing frequencies. Thus, no vertical lines can be seen in the waterfall diagram.
Tests under load
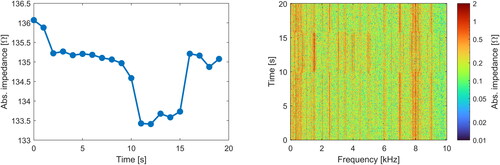
Following the free-running tests, further tests were carried out under load. The measurement period for each test was 20 s. At the start of each test, the spindle was running idle. After about 10 s of free-running, either a constant axial or radial force is applied qualitatively to the spindle tip. After about 5 s of loading, the force was removed again. Tests were carried out at 5,000, 10,000 and 15,000 rpm, respectively. The force was applied with a hand-operated tool and can therefore only be described qualitatively. If an axial force is applied to the spindle, the axial bearing load in the bearings B1 and B2 also increases. This is expected to increase the Hertzian area, which increases the capacitance and reduces the impedance. This change in the impedance signal can be observed in the time domain. If the axial load is removed again, the impedance returns to the original value. This can be seen in on the left. In addition to the time domain, the behavior under load was also observed in the frequency domain. Diagrams based on the concept of waterfall diagrams were used for this purpose. Analogous to the waterfall diagrams of the ramp-up, the 20-second measurement was divided into data packets of 0.1 s each and FFTs were applied to them. The frequency was plotted on the x-axis, but in contrast to the ramp-up, the Y-axis was plotted with the time and not the speed. From the moment the load intervenes, a shift in the frequencies of various peaks can be observed (see , right side).
Figure 8. Comparison of the waterfall diagrams of the absolute impedance (a) and vibration measurement in x-axis (b), y-axis (c) and z-axis (d) for bearing B1 during ramp-up.
The changes in the waterfall diagram as soon as a load is applied affect the peaks of both straight-line clusters. However, as the changing bearing behavior is of particular interest in this contribution, the changes in the area of the BSF and on the BPFO and BPFI are discussed in more detail and are highlighted in . The applied force has different effects on the BSF and on the BPFO and BPFI. As previously described, the calculated frequencies are represented not by one, but by a sum of peaks in the FFT. These have the character of sidebands. Under load, the frequencies of the peaks that are smaller than the BSF become smaller, while the frequencies of the peaks that are larger than the BSF become larger. As a result, the sidebands move away from the calculated BSF in both directions. This behavior can also be observed with the BPFI, although it is much less pronounced. Additionally, the peaks closest to the calculated BPFI increase in magnitude. This can also be seen from the stronger coloration in the waterfall diagram. For the BPFO, no significant change was observed when the force was applied.
Figure 9. Change in the impedance of bearing B2 under axial load in the time domain (left) and frequency domain (right). The load was applied at second 10.
When a radial force is applied instead of an axial force, a change in behavior under load can be seen in the time range, but a direct correlation is not apparent. This more difficult interpretability in the time domain is in line with expectations based on the literature. (Citation6) In the frequency range, however, comparable changes can be recognized as with applied axial force. Differences in the magnitude of the changes can be assumed, but cannot be confirmed due to the qualitative nature of the tests. shows the changes in the signal under radial load.
Figure 10. Detailed view of the free displacement of the impedance of bearing B2 under axial load.
At this point in time, it is not possible to definitively determine the root cause of this behavior. Therefore, further systematic investigations are necessary.
Discussion
In this article, the measurement concept of impedance measurement for monitoring rolling bearings was applied to a real application in form of a spindle for a tool machine. This is one of the first practical applications in a larger project, which can also be made publicly accessible due to its public funding. In the past, impedance as a measurement concept was mainly analyzed and published under controlled laboratory conditions. Interactions with the surrounding environment were deliberately minimized in order to better isolate the impedance mechanisms. Such extensive isolation is not possible in practice, like in the project on which this contribution is based. The prevention of interactions with the surrounding system was not possible, and therefore must be acknowledged and consequently handled. In the process, many conclusions/recognitions could be made with regard to the utilization of impedance measurement in practice. These are discussed and interpreted in the following sections.
The measured impedance signal shows a dependency on the spindle speed. The various natural frequencies (BSF, BPFI, BPFO) of the bearings are clearly visible in the measured impedance signal, particularly in the frequency range. These frequencies are directly dependent on the rotational speed of the spindle with constant factors. This makes it possible to determine the current speed of the spindle from the impedance signal. The fact that the first three significant peaks or groups of peaks of frequencies in the FFT of the impedance signal correspond exactly to the BSF, BPFI, and BPFO, can be utilized for this purpose. From this, corresponding features can be derived, which suggests a possible utilization of the impedance measurement for speed measurement.
Furthermore, a dependency of the measured impedance signal on the force applied to the spindle can be observed. In the time domain, the observation corresponds to observations made in the literature under laboratory conditions. With an increasing axial force on the spindle and thus some of the bearings, a decrease in the absolute value of the measured impedance can be observed. This is consistent with the descriptions of Puchtler et al., (Citation6) Furtmann et al., (Citation19) and Schneider et al. (Citation29) With the absolute value of the impedance in the time domain, a clear feature is given for the useful bending for axial force measurement. If the spindle is radially loaded, the bearings are loaded in radial direction as well. Either no significant or only inconsistent changes in behavior can be observed in the impedance signal in the time range. This makes it impossible to relate the impedance signal to the radial force. This observation is also consistent with the literature, where the change in capacitance caused by the radial load is negligible, if the radial load smaller than the axial load (Citation6) as observed in this work. In addition to the time domain, the change in the impedance signal under load was also investigated in the frequency domain. A change in the behavior of the frequencies of the groups of peaks around the calculated BSF and BPFO can be observed. The frequencies of the sidebands move apart from each other, with the frequencies above the calculated frequencies increasing and the frequencies below decreasing. The BPFI shows no change in behavior. This change in behavior can be observed to a comparable extent under radial or axial load. The results suggest that the shifting of the frequency bands around the natural frequencies of the bearings could provide a further feature for identifying the axial force and the radial force. Since this possible feature appears to affect axial and radial forces in a similar way, it is assumed that knowledge of one of these forces is necessary in order to be able to determine the other force accurately. Further quantitative tests are necessary to be able to evaluate this. The interaction with the rotational speed should also be investigated.
In the signal of the impedance measurement, interactions with the surrounding system of the spindle can also be recognized. These interactions are expressed in particular in a superposition of the measurement signal with interference from the inverter. These result from the frequency of the inverter at 8 kHz and a modulation of the natural frequencies of the bearing with this inverter frequency. Due to this clearly assignable pattern of interference influences, these can be identified in the overall signal and can be eliminated if necessary, so that a corrected measurement signal remains. These observations relate exclusively to the present result in the practical implementation in a tool spindle. When used in other systems, more extensive or other interactions can occur.

Conclusions
This contribution deals with the practical realization of the impedance measurement of rolling bearings in the spindle of a machine tool. For this purpose, the spindle was modified constructively in order to enable impedance measurement of the bearings. Tests were then carried out on the modified spindle, which can be divided into the categories free-running and under load. The resulting impedance signal from the measurements was analyzed both in the time domain and transformed into the frequency domain using FFT and analyzed there.
In order to evaluate the results of this contribution, especially with regard to the features suggested by the interpretation of the measurement results, further tests are necessary. This includes in particular factorized, quantified tests under various defined load conditions. Furthermore, the interactions of the frequency change under load at different speeds must be investigated. If quantifiable, features can be derived from this, they can be used to transfer them into automated evaluation models.
As part of the project on which this contribution is based, the tests successfully verified the measuring principle of impedance measurement in sensor spindles. The modified spindle will therefore be installed in the machine tool. Based on the technical results obtained, the project will develop gradual service offerings and evaluate the associated business model scenarios in terms of their commercial feasibility in the context of machine tool spindles. If it turns out that only the axial load, but not the radial load, can be monitored, this must be taken into account in the application and the business model. This could be done, for example, by focusing on systems or processes with particularly critical axial loading processes. shows a schematic process chain from the operation of the spindle in a machine tool and impedance measurement, the observation of features and their evaluation to operating parameters. Depending on the processing and use of the acquired information, innovative offerings can be created for use in suitable service-oriented business models. These enable providers as well as customers and machine users to generate different added values. For example, information can be used to alert the user to unfavorable load or lubrication conditions and subsequently extend the service life of components ().
Figure 11. Change in the impedance of bearing B2 under radial load in the time domain (left) and frequency domain (right). The load was applied at second 10.
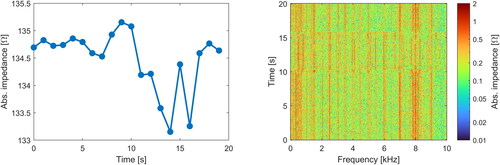
Figure 12. Concept of data processing and utilization.

Disclosure statement
The results presented in this article are part of a project that is being carried out with three German companies, namely optiMEAS Measurement and Automation Systems GmbH, CHRIST-Feinmechanik GmbH & Co. KG, and DATRON AG. These companies each pursue economic interests in their respective industries.
Additional information
Funding
References
- Vorwerk-Handing, G., Martin, G., Kirchner, E. (2018), Integration of Measurement Functions in Existing Systems—Retrofitting as Basis for Digitalization,” Proceedings of NordDesign 2018, Linköping, Sweden.
- Martin, G., Becker, F. M., and Kirchner, E. (2022), “A Novel Method for Diagnosing Rolling Bearing Surface Damage by Electric Impedance Analysis,” Tribology International, 170, 107503. doi:10.1016/j.triboint.2022.107503
- Maruyama, T., Maeda, M., and Nakano, K. (2019), “Lubrication Condition Monitoring of Practical Ball Bearings by Electrical Impedance Method,” Tribology Online, 14, pp 327–338. doi:10.2474/trol.14.327
- Schnabel, S., Marklund, P., Minami, I., and Larsson, R. (2016), “Monitoring of Running-in of an EHL Contact Using Contact Impedance,” Tribology Letters, 63, 35. doi:10.1007/s11249-016-0727-2
- Heemskerk, R. S., Vermeiren, K. N., and Dolfsma, H. (1982), “Measurement of Lubrication Condition in Rolling Element Bearings,” ASLE Transactions, 25, pp 519–527. doi:10.1080/05698198208983121
- Puchtler, S., van der Kuip, J., and Kirchner, E. (2023), “Towards White-Box Modeling of Sensory-Utilized Rolling Bearings,” 10th ECCOMAS Thematic Conference on Smart Structures and Materials, pp 1635–1645. Department of Mechanical Engineering & Aeronautics University of Patras: Patras. doi:10.7712/150123.9935.444456
- Brecher, C. and Weck, M. (2019), Werkzeugmaschinen Fertigungssysteme 1, Springer: Berlin.
- Abele, E., Altintas, Y., and Brecher, C. (2010), “Machine Tool Spindle Units,” CIRP Annals, 59, pp 781–802. doi:10.1016/j.cirp.2010.05.002
- Brecher, C. and Weck, M. (2017), Werkzeugmaschinen Fertigungssysteme, Springer: Berlin.
- Neugebauer, R., Fischer, J., and Praedicow, M. (2011), “Condition-Based Preventive Maintenance of Main Spindles,” Production Engineering, 5, pp 95–102. doi:10.1007/s11740-010-0272-z
- Schuh, G., Kampker, A., Franzkoch, B., and Wemhöner, N. (2010), Intelligent Maintenance. Potenziale zustandsorientierter Instandhaltung. Laboratory for Machine Tools and Production Engineering (WZL) of RWTH Aachen University and Fraunhofer Institute for Production Technology (IPT): Aachen, Germany.
- Klingebiel, J., Graf, S., Schröder, M., Hausner, S., Koch, O., and Sauer, B. (2022), “Influence of Surface Mutation and Parasitic Current Flow on the Impedance Measurement,” Bearing World Journal, 7, pp 23–31.
- Prashad, H. (1988), “Theoretical Evaluation of Impedance, Capacitance and Charge Accumulation on Roller Bearings Operated under Electrical Fields,” Wear, 125, pp 223–239. doi:10.1016/0043-1648(88)90115-9
- Schneider, V., Behrendt, C., Höltje, P., Cornel, D., Becker-Dombrowsky, F. M., Puchtler, S., Gutiérrez Guzmán, F., Ponick, B., Jacobs, G., and Kirchner, E. (2022), “Electrical Bearing Damage, A Problem in the Nano- and Macro-Range,” Lubricants, 10, 194. doi:10.3390/lubricants10080194
- Puchtler, S., van der Kuip, J., and Kirchner, E. (2023), “Analyzing Ball Bearing Capacitance Using Single Steel Ball Bearings,” Tribology Letters, 71. doi:10.1007/s11249-023-01706-7
- Hertz, H. (1881), “Über die Berührung fester elastischer Körper,” Journal für die reine und angewandte Mathematik, 92, pp 156–171.
- Barz, M. (1996), Die Schmierfilmbildung in fettgeschmierten schnellaufenden Spindellagern, Dissertation, Universität Hannover, Hannover.
- Wittek, E., Kriese, M., Tischmacher, H., Gattermann, S., Ponick, B., and Poll, G. (2010), “Capacitances and Lubricant Film Thicknesses of Motor Bearings under Different Operating Conditions,” The XIX International Conference on Electrical Machines—ICEM 2010, pp 1–6, IEEE: Washington, DC. doi:10.1109/ICELMACH.2010.5608142
- Furtmann, A., Bader, N., Poll, G., and Tischmacher, H. (2017), “Capacitances and Lubricant Film Thicknesses of Oil Lubricated Bearings,” Bearing World Journal, 2, pp 43–47.
- Schneider, V., Bader, N., Liu, H., and Poll, G. (2022), “Method for In Situ Film Thickness Measurement of Ball Bearings under Combined Loading using Capacitance Measurements,” Tribology International, 171, 107524. doi:10.1016/j.triboint.2022.107524
- Gonda, A., Paulus, S., Graf, S., Koch, O., Götz, S., and Sauer, B. (2024), “Basic Experimental and Numerical Investigations to Improve the Modeling of the Electrical Capacitance of Rolling Bearings,” Tribology International, 193, 109354. doi:10.1016/j.triboint.2024.109354
- Han, P., Heins, G., Patterson, D., Thiele, M., and Ionel, D. M. (2020), “Combined Numerical and Experimental Determination of Ball Bearing Capacitances for Bearing Current Prediction,” 2020 IEEE Energy Conversion Congress and Exposition (ECCE), pp 5590–5594, IEEE: Washington, DC. doi:10.1109/ECCE44975.2020.9235700
- Jablonka, K., Glovnea, R., and Bongaerts, J. (2012), “Evaluation of EHD Films by Electrical Capacitance,” Journal of Physics D: Applied Physics, 45, 385301. doi:10.1088/0022-3727/45/38/385301
- Leenders, P., and Houpert, L. (1987), “Paper XXI(i) Study of the Lubricant Film in Rolling Bearings; Effects of Roughness,” Fluid Film Lubrication—Osborne Reynolds Centenary, Proceedings of the 13th Leeds–Lyon Symposium on Tribology, held in Bodington Hall, The University of Leeds. Tribology Series, ed. D. Dowson, C. M. Taylor, M. Godet, and D. Berthe, pp 629–638. Elsevier: Amsterdam, Oxford, New York and Tokyo. doi:10.1016/S0167-8922(08)70996-9
- Puchtler, S., Schirra, T., Kirchner, E., Späck-Leigsnering, Y., and de Gersem, H. (2022), “Capacitance Calculation of Unloaded Rolling Elements—Comparison of Analytical and Numerical Methods,” Tribology International, 176, 107882. doi:10.1016/j.triboint.2022.107882
- Shetty, P., Meijer, R. J., Osara, J. A., and Lugt, P. M. (2022), “Measuring Film Thickness in Starved Grease-Lubricated Ball Bearings: An Improved Electrical Capacitance Method,” Tribology Transactions, 65, pp 869–879. doi:10.1080/10402004.2022.2091067
- Zurich Instruments. "MFIA: 500 kHz/5 MHz Impedance Analyzer," https://www.zhinst.com/europe/en/products/mfia-impedance-analyzer (accessed January 16, 2024).
- Harris, T. A. and Kotzalas, M. N. (2007), Essential Concepts of Bearing Technology. Rolling Bearing Analysis, CRC Press: Boca Raton.
- Schneider, V., Liu, H.-C., Bader, N., Furtmann, A., and Poll, G. (2021), “Empirical Formulae for the Influence of Real Film Thickness Distribution on the Capacitance of an EHL Point Contact and Application to Rolling Bearings,” Tribology International, 154, 106714. doi:10.1016/j.triboint.2020.106714