Abstract
This study applied Moderate-Resolution Imaging Spectroradiometer (MODIS) images from 2000 to 2010 to obtain and analyze the spatiotemporal variation of suspended sediment concentration (SSC) and discussed factors affecting it in Poyang Lake, China. Results showed that (1) the mean SSC was lower in the south, higher in the north, and moderate in the central lake region; (2) the mean SSC in the south was lower than or close to 20 mg/L, with no clear annual trend; (3) the mean SSC in the north was slightly higher than 20 mg/L in 2000 and increased from 2001, with the highest value >60 mg/L in 2006; (4) the mean SSC in the central lake region, except for 2009, ranged from 20 to 40 mg/L and had an annual pattern similar to that in the southern lake region; (5) for the entire lake, the mean SSC declined from January to March, increased from September to December, and fluctuated from April to August; and (6) several higher SSC values were found in the central or southern lake regions. The spatiotemporal variation of SSC was controlled by natural and human factors, in which dredging was dominant. Limiting the area of dredging and reducing dredging intensity would decrease SSC and maintain sustainable development of Poyang Lake. Remote sensing can obtain the spatiotemporal information of some water quality parameters, which will help managers understand the lake dynamics and mechanisms to make better decisions for lake management.
Lakes provide various benefits to society through commerce, aesthetics, tourism, recreation, and biodiversity conservation (Jorgensen et al. Citation2005), and these provisions are greatly influenced by water quality. Suspended sediment is a primary indicator describing water quality (Zhang et al. Citation2003, Hu et al. Citation2004, Pozdnyakov et al. Citation2005) because of its important influences on water bodies, such as transporting nutrients and contaminants, including heavy metals and microorganisms (Davies-Colley and Smith Citation2001, Cigizoglu and Kisi Citation2006), as well as reducing light transmission through the water column (Blom et al. Citation1994, Kirk Citation1994), which can influence entire aquatic ecosystems (Rorslett Citation1996). Thus, the measurement of suspended sediment concentration (SSC) is useful for the study of aquatic ecosystems. Space and time (spatiotemporal) SSC variation can be driven by both natural and human factors within a lake, including aquatic vegetation cover, water level, wind speed, rainfall, and shipping (Bailey and Hamilton Citation1997, Wu et al. Citation2007, Citation2009). Variation may also be affected by soil erosion within a lake's contributing watersheds through surface water inputs (Bilge et al. Citation2003). Lake managers can use spatiotemporal measurements of SSC to understand driving factors and determine artificially controllable ones (such as water level or shipping) to improve the health of a lake.
Remote sensing techniques have been widely applied to estimate SSC and analyze its spatiotemporal variation. Landsat images are frequently used data sources for estimating SSC due to their relatively high spatial resolution, good quality, and long historical archive. They have been applied in many regions, such as the Tuttle Creek Reservoir (Nellis et al. Citation1998) and Delaware Bay (Keiner and Yan Citation1998) in the United States, Lake Balaton in central Europe (Tyler et al. Citation2006), the Yangtze River in China (Wang et al. Citation2009), and the Venice lagoon in Italy (Volpe et al. Citation2011). Landsat images, however, have limitations in operational uses for regular monitoring because SSC is highly dynamic and may not be tracked effectively by a satellite with a 16-day repeating cycle. Moreover, frequent cloud cover decreases the availability of suitable imagery in many regions, reducing the usefulness of Landsat images for regular monitoring of SSC (Kloiber et al. Citation2002). Several studies have explored the potential of low-spatial resolution images with more frequent coverage for estimating SSC. For example, Islam et al. (Citation2001) and Ruhl et al. (Citation2001) employed the advanced very high resolution radiometer (AVHRR) images with 1.1 km spatial resolution to estimate SSC in the Ganges and Brahmaputra rivers of Bangladesh and San Francisco Bay of the United States, respectively. The low spatial resolution limits its applications to large water bodies, however.
Moderate-Resolution Imaging Spectroradiometer (MODIS) imaging, with its advantages of medium spatial resolution, daily coverage, high sensitivity, and cost-free distribution (Li and Li Citation2004, Miller and Mckee Citation2004), has potential for regularly monitoring SSC. Such potential was explored in many studies (e.g., Hu et al. Citation2004, Miller and Mckee Citation2004, Liu et al. Citation2006, Sipelgas et al. Citation2006, Kutser et al. Citation2007, Liu and Rossiter Citation2008, Wu and Cui Citation2008, Chen et al. Citation2009, Jiang et al. Citation2009, Tarrant et al. Citation2010, Wang et al. Citation2010a, Citation2010b, Wang and Lu Citation2010, Zhang et al. Citation2010, Chen et al. Citation2011a, Citation2011b, Jiang and Liu Citation2011, Zhao et al. Citation2011, Binding et al. Citation2012, Feng et al. Citation2012, Ondrusek et al. Citation2012), and many MODIS-based SSC retrieval models were developed. For example, Hu et al. (Citation2004) created an exponential model between SSC and reflectance difference of 250 m MODIS red and infrared bands in Tampa Bay in the United States; Martinez et al. (Citation2009) as well as Kilham and Roberts (Citation2011) employed a linear model and spectral mixture analysis of 250 m MODIS image to estimate SSC in the Amazon River and its tributaries; Wu and Cui (Citation2008) developed a cubic model of 250 m red band and Feng et al. (Citation2012) employed an exponential model of the difference of 250 m red and 500 m mid-infrared bands for estimating SSC in Poyang Lake, China. Most models were based on the red or infrared band of MODIS image, but their forms are different due to the different optical properties of various water bodies or different seasons, which meant that a model developed for a particular water body generally should be calibrated or validated when applied to different water bodies or different seasons. Thus, developing suitable MODIS-based models for a specific water body is still necessary.
This study aimed to (1) develop MODIS-based SSC retrieval models, (2) apply the developed models to retrieve SSC from MODIS images, (3) analyze the spatiotemporal variation of SSC, and (4) discuss the driving factors of SSC variation in Poyang Lake. The results from this study will help lake managers understand the driving factors of SSC variation and define the artificially controllable ones to improve lake health and further protect this unique lake ecosystem.
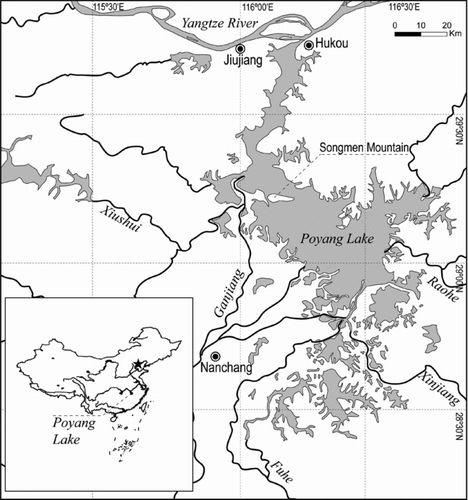
Figure 1 Poyang Lake, China.
Study site
Poyang Lake (115°47′–116°45′E, 28°22′–29°45′N) is located on the southern bank of the middle Yangtze River (). Its size fluctuates from <1000 km2 in the dry season (Dec–Feb) to about 4000 km2 in the flooding season (Jul–Aug). The lake receives water from 5 rivers (Raohe, Xinjiang, Fuhe, Ganjiang, and Xiushui) and drains into the Yangtze through a channel in the north. Poyang Lake is divided geographically by Songmen Mountain into 2 parts: a larger and shallower basin in the south and a narrower and deeper channel in the north. Most of the lake bottom has an elevation of 12–17 m (Wusong Datum: an elevation system established by measured datum plane determined through the lowest tidal datum in tide station of Wusongkou of China during 1871 to 1900, known as Wusong Elevation System); the low elevation (<12 m) of the northern outlet is relatively uniform, while a large gradient exists in the southern region (Feng et al. Citation2011). Suspended sediment is the dominant factor affecting the water quality of Poyang Lake (Wu et al. Citation2011). Two general particle sizes were found in Poyang Lake, with the majority dominated by particles of 10–20 μm in diameter and the other dominated by >100 μm in size (Feng et al. Citation2012). Inorganic matter is dominant (about 90% in 2010 and 2011) within the total suspended sediment of this lake (Wu et al. Citation2011).
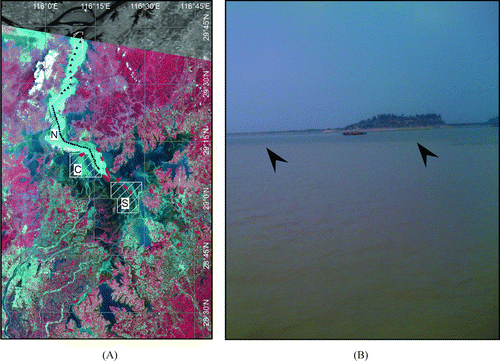
Figure 2 (A) Landsat 5 TM image (bands 4, 3, and 2) on 28 July 2011 and MODIS Terra image (band 2) on 17 October 2010 together showing the sampling sites in 2007 (black circle) and 2010 (black triangle), the defined regions describing the suspended sediment concentration in northern (N), central (C) and southern (S) regions as well as new dredging regions in central Poyang Lake (the red rectangles are dredging-related vessels identified from the band 5 of Landsat TM 5 image); (B) Photo showing the zone of turbid water caused by sand dredging (the separation line between the clear and turbid water was indicated by black arrows) (color figure available online).
Materials and methods
Field studies
Two field studies were conducted in 2007 and 2010, respectively. The first study on 27 September 2007 included 42 sampling sites () selected from turbid to clear water. A global position system (GPS) receiver was used to record the location coordinate, and 300 mL of surface water was collected from around 0–50 cm water depth at each site. The second study conducted on 17 October 2010 included 12 sampling sites (). At each site, the surface water and location coordinate were collected and recorded with the same methods as those in 2007.
MODIS images
MODIS is the key instrument aboard the satellites Terra (EOS AM-1) and Aqua (EOS PM-1) launched by the US National Aeronautics and Space Administration (NASA) on 18 December 1999 and 4 May 2002, respectively. Terra and Aqua pass over the equator at around 10:30 h and 13:30 h, respectively. Terra and Aqua MODIS instruments scan the entire earth's surface every 1 to 2 days with a ±55 degree scanning pattern, which allows remotely sensed measurements of land, oceans, and the lower atmosphere (http://modis.gsfc.nasa.gov). The MOD09GQ and MYD09GQ are the surface reflectance products with 250 m spatial resolution computed from MODIS Terra and Aqua level 1B bands 1 and 2 centered at 645 and 859 nm. MOD09GQ and MYD09GQ were employed to estimate SSC in this study.
Three MOD09GQ and MYD09GQ images captured on 27 September 2007 and 17 October 2010, the dates of our field studies, were downloaded from NASA's EOS data gateway (http://edcimswww.cr.usgs.gov/pub/imswelcome; accessed 30 May 2011) to develop MODIS-based SSC retrieval models. One MOD09GQ or MYD09GQ (when the MOD09GQ image with high quality was not available) image with high quality was downloaded for each month of 2000–2010, except for January 2000, June and August 2007, and April 2010 (which were excluded due to cloud cover). The resulting 128 images were used to estimate the spatiotemporal SSC in Poyang Lake. All downloaded images were projected into the WGS 84/UTM zone 50N using nearest-neighbor resampling to preserve the original reflectance values. For each image, a sub-image covering Poyang Lake was cut from the original, and the land areas and small water bodies were removed using a binary mask created by visually interpreting its unsupervised classification image.
Laboratory SSC measurement
The SSC of each water sample was measured in the laboratory using the following method. One 0.45 μm nucleopore membrane filter was weighed, wetted with distilled water, dried for 1 h at 110°C in a drying oven, and reweighed after returning to room temperature in a desiccator. This procedure was repeated at least 5 times until the weight of the membrane filter was stabilized to within 0.001 g. Sample water was shaken to suspend the sediments, and 250 ml of water was poured through the membrane filter in a vacuum pump filtration apparatus. Next, the membrane filter was dried for 2 h at 110 C and reweighed after cooling to room temperature in the desiccator. The SSC was calculated by dividing the weight difference of the membrane filter before and after filtering by 250 mL.
SSC model development
The distance between 2 adjacent sampling points was >1.5 km, and thus one pixel of MODIS image with 250 m spatial resolution at most covers one sampling point. The spectral values at each sampling point were assumed equal to those of the pixel in which the sampling point is located, and thus 54 SSC measurements in 2007 and 2010 combined with their corresponding MODIS Terra 250 m red and infrared band reflectance were used to develop the best-fitting model for estimating SSC from MODIS Terra image. The descriptive statistics of SSC and red and infrared band reflectance were performed first. The linear, logarithmic, quadratic, cubic, power, growth, and exponential models between the SCC and the single red or infrared band, or the ratio or difference of the 2 bands were then calibrated, respectively, with the least-squares technique to find the best-fitting model for SSC estimation. Finally, the determination coefficients (R2) and estimated standard errors (SE) of all the calibrated models were compared to determine the best-fitting model.
The best-fitting model was validated using the leave-one-out cross-validation (LOOCV) technique, which was proposed by Craven and Wahba (Citation1978) and considered an almost unbiased estimator of model validation (Cawley and Talbot Citation2004). To validate the best-fitting model, one sample was excluded as a validation datum, and the other 53 samples were used as training data to fit a regression model with the same form as the best-fitting model using the least-squares technique. The resulting regression model was then used to estimate the SSC of the excluded sample. This process was repeated 54 times to estimate the SSCs of the 54 water samples.
The correlation coefficient (r) between the measured and estimated SSC values of the 54 water samples was calculated to assess model accuracy; the null hypotheses that the slope and intercept of the linear regression line between the measured and estimated SSCs were equal to one and zero, respectively, was tested to estimate model bias. The root mean square error (RMSE) and relative root mean square error (RRMSE) also were calculated to assess the performance of the best-fitting model.
This study used 17 MODIS Aqua images, one for each month in which no high quality Terra image was available. The model developed for the Terra sensor, however, could not be applied to Aqua images directly; thus, 42 SSC measurements on 27 September 2007 with their corresponding MODIS Aqua 250 m red band reflectance were employed to calibrate the best-fitting model for estimating SSC from MODIS Aqua images with the same method as that previously described. The infrared band of MODIS Aqua image was not employed for model calibration because of its negative reflectance values at some sampling sites. The model validation was not implemented because no coincident in situ SSC measurements and Aqua image with good quality were available.
SSC estimation and analysis
The best-fitting SSC models for MODIS Terra and Aqua images were applied to estimate the SSC values from the 128 preprocessed MODIS images. Three sampling regions () were created to calculate the mean SSCs in the southern, central, and northern regions of Poyang Lake for each time period. The 3 regions were completely inundated at high water levels but only partly during low water levels. Based on the mean SSC at each time period from 2000 to 2010, their yearly and monthly mean SSCs were derived, and the spatiotemporal variation of SSC was further analyzed.
Results
SSC measurement and MODIS reflectance
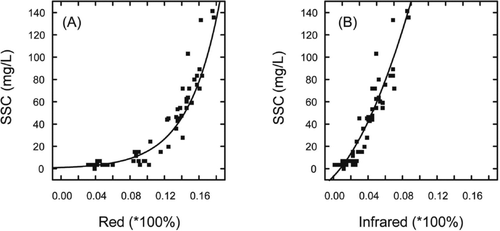
The in situ SSCs range widely from about 0 to 141.9 mg/L (). The remotely sensed measurements associated with these SSC measurements show that the infrared band has lower reflectance than the red band due to its stronger absorption by the water column.
Table 1 Statistics describing the variation of suspended sediment concentrations (SSC) of 54 water samples and their corresponding red and infrared reflectance of MODIS Terra images. (Std. Dev. = standard deviation).
Figure 3 Relationships between suspended sediment concentration (SSC) and red (A: exponential model) and infrared (B: quadratic model) band reflectance of MODIS Terra images (n = 54).
SSC model development
Both the red and infrared bands of MODIS Terra images correlate positively with SSC (). For the red band, the exponential model explained 91% of the variation of SSC with an SE value of 11.20 mg/L (; ); the cubic model had a slightly higher R2 (0.92) and SE value (11.26 mg/L) compared with the exponential model (). For the infrared band, the cubic () and quadratic models (; ) explained 90 and 89% of the variations of SSC, with SE values of 12.53 and 12.60 mg/L, respectively. The ratio of infrared and red bands yielded a lower fitting accuracy compared with the 2 individual bands alone. F-tests showed that all 4 regression models were statistically significant at a p value of 0.05. The highest and lowest correlation coefficients derived from the 4 models, r model(B) = 0.96 and r model(D) = 0.95, were not significantly different (z-test for 2 correlation coefficients: z = 0.58, p = 0.57), while the exponential model of the red band yielded the smallest SE. Thus, the exponential model of the red band obtained the best-fitting results of all tested models for estimating SSC from MODIS Terra image.
Table 2 Regression models with goodness of fit between suspended sediment concentration (SSC) and red (R) and infrared (IR) band reflectance of MODIS Terra (n = 54) and Aqua (n = 42) images (p < 0.05).
We fitted 54 exponential models of MODIS Terra red band when the best-fitting model was validated using the LOOCV technique; statistical analysis indicated the stability of these models (). A scatter plot () indicates a significantly strong correlation between the measured and estimated SSC values (r = 0.95, p < 0.001). The null hypothesis tests of intercept equal to zero (a = −0.185, SE = 2.457) and slope equal to one (b = 0.999, SE = 0.045) revealed that the intercept and slope of the regression line between the measured and estimated SSCs were not significantly different from zero (t = −0.075, d.f. = 53, p = 0.940) and one (t = 0.022, d.f. = 53, p = 0.983). This indicates that the exponential model of the red band obtained an unbiased SSC estimation.
No clear trend was found within the residual plot of SSC estimation (), which reconfirmed the unbiased SSC estimation. The RMSE and RRMSE of SSC estimation were 11.20 mg/L and 28.6%, respectively, indicating that the model accuracy was acceptable for estimating SSC from MODIS Terra images. A saturation problem was observed, however; the red reflectance would not increase with the increasing SSC when it reached a certain value (about 18% in this study; ), which indicated that the exponential model of red band may have large estimation errors for very high turbid water.
The exponential model of MODIS Aqua red band explained 70% of the variation of SSC with an SE value of 23.38 mg/L (), and the quadratic model explained 72% of the variation of SSC with an SE value of 22.68 mg/L (). The correlation coefficients derived from the 2 models were not significantly different (z-test for 2 correlation coefficients: z = 0.18, p = 0.86). Thus, the exponential model of MODIS Aqua red band, due to its simple style, was applied to estimate SSC from MODIS Aqua images in this study.
Table 3 Statistics of 54 exponential models of the Terra red band (Red) for validating the best-fitting model of suspended sediment concentration (SSC) estimation using the leave-one-out cross-validation (LOOCV) technique (SSC = a*eb*Red). (Std. Dev. = standard deviation).
Figure 4 Validation of the best-fitting regression model for estimating suspended sediment concentration (SSC) from MODIS Terra images: (A) measured vs. estimated SSCs with observed regression line (solid line) and 95% prediction interval (dashed lines); (B) residual of SSC vs. estimated SSC.
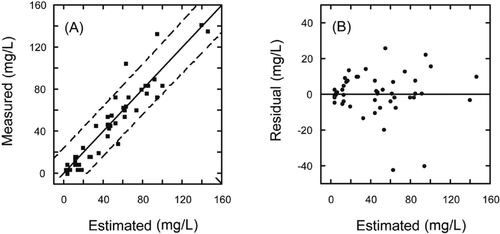
Figure 5 MODIS-based suspended sediment concentrations on 1 Aug 2000 (left, before dredging), 17 Aug 2005 (middle, during dredging), and 19 Aug 2008 (right, dredging was banned) in Poyang Lake (color figure available online).
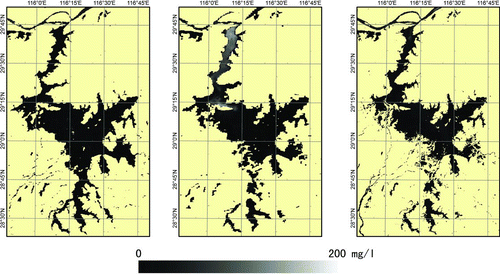
Figure 6 Mean suspended sediment concentration (SSC) within the 3 sampling regions in the northern, central, and southern Poyang Lake from 2000 to 2010 (color figure available online).
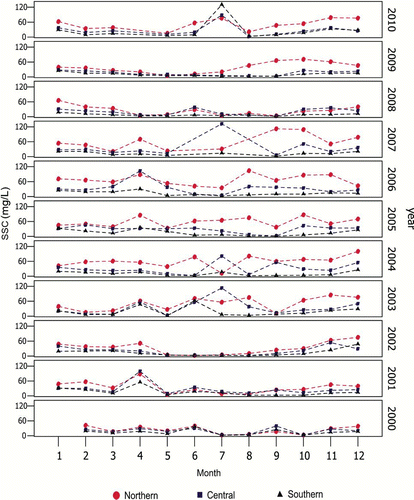
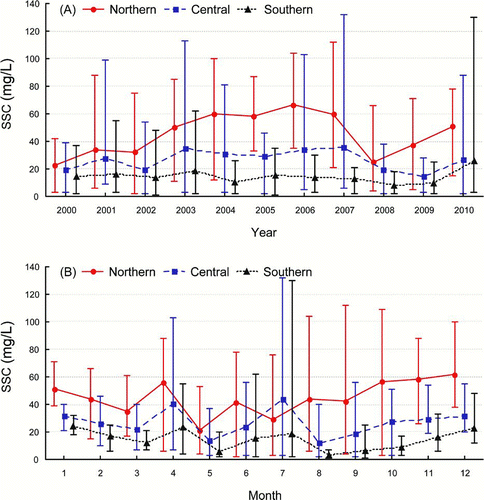
Figure 7 Yearly (A) and monthly (B) mean suspended sediment concentration (SSC) within the 3 sampling regions in the northern, central and southern Lake from 2000 to 2010. The middle point of the box-and-whisker plot is the mean value low and high whiskers are minimum and maximum, respectively (color figure available online).
SSC estimation and analysis
The best-fitting models for MODIS Terra and Aqua images were applied to the 128 MODIS images to estimate the SSCs of Poyang Lake; estimation results on 1 August 2000, 17 August 2005, and 19 August 2008 are shown (). The mean SSCs within the 3 sampling regions in the northern, central, and southern regions of the lake at each time period from 2000 to 2010 () were calculated, and their yearly and monthly values () were determined.
In general, the mean SSC was lower in the south, higher in the north, and moderate in the central region of the lake ( and 7A). An analysis of variance (ANOVA) revealed a significant difference in mean SSC values among the northern, central, and southern lake regions (F(2, 381) = 64.860, p < 0.001). In the southern region, the mean SSC was <20 mg/L from 2000 to 2009 and slightly >20 mg/L in 2010, with no clear annual trend ( and 7A). In the north, the mean SSC was slightly >20 mg/L in 2000, increased from 2001, and reached the highest value >60 mg/L in 2006; it then declined from 2007, reaching a low value close to 20 mg/L in 2008, and increased again after 2009 ( and 7A). In the central lake region, the mean SSC values for most years, except for 2009, ranged from 20 to 40 mg/L, with an annual variation similar to that found in the southern region ( and 7A). Considering the entire lake, the mean SSC declined from January to March, increased from September to December, and fluctuated from April to August in the northern, central, and southern lake regions ( and 7B). Higher SSC values were observed in the central or southern region during several time periods, such as 14 July 2003, 6 September 2004, and 27 July 2007 ().
Discussion
SSC models
The MODIS Terra and Aqua red or near infrared band closely estimated the SSC in Poyang Lake. The water-leaving radiances captured by remote sensing sensor are used to estimate water quality parameters, and they are affected by the inherent optical properties of the waterbody, the most fundamental parameters of which are the absorption and backscattering coefficients (Lee et al. Citation2002). These coefficients are determined by the main water constituents, including phytoplankton, suspended sediment, and yellow substance within the water column (Kirk Citation1994, Ma et al. Citation2006). The absorption coefficients of these main water constituents decrease with the increasing wavelength and are close to zero in the red and near infrared bands, especially for waterbodies with low phytoplankton concentration; thus, the water-leaving reflectance is dominated by the backscattering coefficient of suspended sediment within the red and near infrared regions (Doxaran et al. Citation2006, Ma et al. Citation2010). Such water absorption and backscattering characteristics could explain why the red and infrared bands have the potential to estimate SSC.
The exponential model of MODIS Terra 250 m red band yielded the best estimate of SSC in this study. This model is different from the linear models of red band (Miller and Mckee Citation2004, Sipelgas et al. Citation2006), the exponential model of the reflectance difference at red and near infrared band (Hu et al. Citation2004), and many other models (e.g., Hu et al. Citation2004, Miller and Mckee Citation2004, Liu et al. Citation2006, Sipelgas et al. Citation2006, Kutser et al. Citation2007, Liu and Rossiter Citation2008, Wu and Cui Citation2008, Chen et al. Citation2009, 2011a, 2011b, Jiang et al. Citation2009, Tarrant et al. Citation2010, Wang et al. Citation2010a, Citation2010b, Wang and Lu Citation2010, Zhang et al. Citation2010, Jiang and Liu Citation2011, Binding et al. Citation2012, Feng et al. Citation2012, Ondrusek et al. Citation2012). These differences could be attributed to the characteristic of SSC empirical or semi-empirical retrieval models, which vary in different water bodies and/or seasons due to different water constituents (Liu et al. Citation2003, Zhang et al. Citation2008, Ma et al. Citation2010). Although the empirical or semi-empirical models have limitations, they are currently the dominant models for remote sensing-based water quality monitoring because accurate bio-optical models are not available for most water bodies.
The MODIS Terra 250 m red band explained 91% of the variation of SSC in Poyang Lake, which is higher than that reported in many previous studies. For example, Hu et al. (Citation2004), Miller and McKee (Citation2004) and Sipelgas et al. (Citation2006) reported that the red band of MODIS could explain 90, 89, and 58% of the variation of SSC, respectively. To a certain extent, the variation explained by a model depends on the range of SSC values used for model calibration, and generally a larger SSC range results in a higher explained variation. The SSC range used for model calibration SSC in this study (around 0–142 mg/L) was larger than previous studies (e.g., ∼2–11 mg/L, n = 31 in Hu et al. Citation2004;, 0–60 mg/L, n = 52 in Miller and Mckee Citation2004; and 0–12 mg/L, n = 48 in Sipelgas et al. Citation2006), which might explain why our model yielded a relatively higher level of estimation accuracy.
We also found that the red band of Aqua image explained 70% of the variation of SSC with an SE of 23.38 mg/L, and its estimation accuracy was lower compared with that of the red and infrared bands of Terra image. This difference might be affected by several factors, including different sensors, different atmospheric situations of image capturing, and different atmospheric correction levels of images. We suggest that the comparison between the Terra and Aqua images for SSC estimation cannot be used to draw conclusions on the performance of the 2 sensors because these results were obtained from only 3 images.
SSC variation and driving factors
The mean SSC in southern Poyang Lake was lower compared with that in the central and northern regions, and there was no clear trend from 2000 to 2010. The SSC in southern Poyang Lake is mainly controlled by the SSCs in water from the Fuhe, Xinjiang, and Raohe rivers. According to the “Changjiang Sediment Bulletin” published by the Yangtze River Water Resources Committee, there were no obvious SSC trends in the 3 rivers from 2000 to 2009. This might explain why no clear pattern for mean SSC was found in southern Poyang Lake.
The mean SSC in northern Poyang Lake was higher compared with that in the central and southern regions; it showed an increasing trend from 2000 to 2006, decreased in 2007 and 2008, and increased again from 2009. Dredging in northern Poyang Lake started around 2001 (Zhong and Chen Citation2005). The dredging activities were concentrated along the deeper main channel of northern Poyang Lake in 2001 and 2002 and were extended to the region north of Songmen Mountain from 2003; the dredging was restricted to main channel of northern Poyang Lake in low water levels, presumably because low water prohibited dredging in the shallow waters north of Songmen Mountain (Wu et al. Citation2007).
A highly significant positive correlation between the water turbidity and dredging-related ship number in northern Poyang Lake was found by Wu et al. (Citation2007); however, this relation does not necessarily implicate that dredging resulted in the increased water turbidity or SSC, which could be caused by other factors. Through detailed analyses on coincidence of ship clusters with turbid plume development when clear waters upstream pass the first ship cluster, Wu et al. (Citation2007) confirmed that the increased water turbidity or SSC in northern Poyang Lake was mainly caused by dredging.
The differences in dredging-related ship numbers might, to a certain extent, explain the SSC variation from 2000 to 2010 in Poyang Lake. In particular, illegal sand dredging was banned in 2008, which greatly reduced the number of dredging-related ships (from about 400 ships in 2007 to about 200 ships in 2008; unpubl. data); meanwhile, the mean SSC also decreased greatly in 2008 compared with that in 2007 (from about 60 mg/L in 2007 to about 25 mg/L in 2008, as observed in this study).
Poyang Lake hydrologically connects to the middle Yangtze River at Hukou through a narrow channel (). Due to the different flooding seasons of Poyang Lake and Yangtze River, the water backflow from Yangtze River to Poyang Lake occurs frequently when the water level of the middle Yangtze River is higher than that of Poyang Lake (Shankman et al. Citation2006). When backflow and sand dredging occur together, the river water pushes the water with high SSC in northern Poyang Lake to the south and increases SSC in the central or even southern parts (Cui et al. Citation2009). This might explain why the mean SSC in central Poyang Lake was consistent with that of the southern region during most time periods, but high SSC values appeared in the central or even southern regions during several time periods, such as 14 July 2003, 6 September 2004, and 27 July 2007.
Generally, the water level of Poyang Lake is lower in January and higher in July or August, with an increasing trend from January to June and a decreasing trend from September to December (Min Citation1995). Such seasonal trends of water level could explain why the mean SSC in Poyang Lake declined from January to March and increased from September to December, because wave action increases the resuspension of sediment when water levels are lower. The SSC fluctuation from April to August is complex and controlled jointly by natural and human factors such as water level, wind speed, precipitation, backflow, or dredging.
Feng et al. (Citation2012) considered that the wind and precipitation seemed unrelated to the mean SSC interannual variations, and, compared with the sand dredging, these natural factors played a minor role in affecting SSC at annual scale. We, however, observed that, in 2010, the SSC values of 1 July were higher than those of 4 June and 4 August, especially at the central and southern Poyang Lake (). Heavy precipitation occurred within Poyang basin in late June 2010 and caused the severe flood in July in Poyang Lake (http://www.jjsw.com.cn). The heavy precipitation and the increased inflows with high SSC from the 5 rivers increased the SSC in this lake, which could explain why the high SSC values were observed on 1 July 2010.
Dredging and management recommendations
Zhong and Chen (Citation2005) attributed the dredging problems in Poyang Lake to several factors. First, a dredging ban in the Yangtze River resulted in dredging being shifted to Poyang Lake in 2001. Second, dredging further increased due to the rapidly rising demand for sand to support construction in the lower Yangtze River economic zone. Finally, the benefits to the local economy likely persuaded the local government to allow and possibly promote dredging. The dredging activities were focused on the main channels between Hukou and Songmen mountains in northern Poyang Lake before 2010 (Wu et al. Citation2007). Two new dredging regions, however, were found in central Poyang Lake in 2011 from both field observations and Landsat TM 5 image (), which means the regions affected by dredging were enlarged with the dredging moving southward.
Several organizations, including the European Inland Fisheries Advisory Commission and Canadian Council Ministers Environment, reported an SSC threshold of 25 mg/L for a high level of water protection or suspended sediment affecting aquatic ecosystems (Kerr Citation1995). The dredges in Poyang Lake employ floating platforms to extract sediments from the lake bottom through suction pumps powered by engines. This process stirs up sediments (), increases SSC (from a mean value around 25 mg/L in 2000 to >25 mg/L, or as high as 60 mg/L, from 2001 to 2007, as observed in this study), and decreases water clarity (Wu et al. Citation2007), which reduces underwater light climate and further affects the growth of aquatic organisms. Dredging changes lake bottom morphology and destroys benthic habitats, which may result in the change and decrease of benthic biodiversity. Dredging also removes sediments, and an estimated ∼236 million m3 sands per year were extracted in 2005 and 2006 (De Leeuw et al. Citation2010), which will lower the water level assuming unchanged water inputs.
Zhong and Chen (Citation2005) considered that the noise, oil pollution, turbidity, and decreased habitat caused by dredging could seriously affect the propagation, growth, and subsistence of fish in the lake. Poyang Lake is an important habitat for several rare or endangered species, such as the baiji (Lipotes vexillifer), Chinese sturgeon (Acipenser sinensis), white sturgeon (Acipenser transmontanus), and Yangtze finless porpoise (Neophocaena phocaenoides). Fok and Pang (Citation2006) reported that populations of the Yangtze finless porpoise and baiji in Poyang Lake rapidly decreased with the rapid growth of fisheries boating, traffic, and dredging activities.
Poyang Lake is considered the most important habitat of wintering waterfowl in East Asia. For example, more than 95% of the Siberian crane (Grus leucogeranus) population winters here (Li et al. Citation2005), and its main food is tubers of Vallisneria spiralis L., a submerged aquatic vegetation species found in the lake (Wu and Ji Citation2002). The increased SSC caused by dredging decreases the available light for photosynthesis of Vallisneria, which causes Vallisneria to decrease or disappear, thus affecting the survival of the Siberian crane (Wu et al. Citation2007).
The SSC variation of Poyang Lake is controlled by natural and human factors. Although several studies reported the SSC status of Poyang Lake before 2000, they were not comparable with our results because they focused only on limited hydrological stations. We considered that the SSC changing patterns in 2000 (no dredging) and 2008 (dredging was banned) described the natural SSC process of Poyang Lake ( and 7). In general, lower SSC values were observed in deeper waters (Jul and Aug) and higher SSC values in shallower waters (Jan and Dec), while the SSC changing patterns in southern, central, and northern lake regions were coincident. This natural process was dominated mainly by water level, flow velocity, wind speed, rainfall, and water inputs from watersheds.
Although these natural factors affect the SSC variation, controlling or managing them to reduce the SSC of Poyang Lake is difficult or impossible at present. In addition, when the water backflow from Yangtze River to Poyang Lake occurs, the river water with high SSC moves southward and changes the SSC in Poyang Lake (Wang Citation1994, Ma et al. Citation2003), resulting in SSC fluctuation, especially in northern Poyang Lake. Severe flooding may greatly increase the SSC, but this only occurred during 7 years from 1950 to 1998 (Shankman et al. Citation2006). Compared with the long-term impacts of dredging on SSC, the effects of short-term severe flood or backflow are limited and uncontrollable at present.
Dredging increased the SSCs in Poyang Lake, and one question for lake management is whether stopping dredging can decrease SSC. The dredging in Poyang Lake started in 2001, and SSC increased sharply from 2001 to 2007; the mean SSC in the northern part in 2006 was about 3 times that in 2000 ( and 7). The SSC immediately recovered to the levels similar to 2000 (before dredging) when dredging was banned in 2008 (, 6, and 7). This SSC recovery in 2008 was consistent with the hypothesis that dredging resulted in the increasing of SSC in Poyang Lake, and also indicated that stopping dredging can decrease SSC. Managers must balance the pros and cons of dredging to protect this unique lake ecosystem. At least 2 measures could be taken to improve the water quality and maintain the sustainable development of Poyang Lake: limit the area of dredging regions and reduce dredging intensity.
Dredging occurs frequently in many lakes, rivers, harbors, or coastal areas to maintain adequate water depths for navigation, provide sand and gravel for construction and reclamation projects, or remove contaminated sediments to improve water quality and restore the health of aquatic ecosystems (Nayar et al. Citation2004, Robinson et al. Citation2005, Fraser et al. Citation2006, Smith et al. Citation2006, Spencer et al. Citation2006, Roman-Sierra et al. Citation2011, Lurling and Faassen Citation2012). However, long-term and intensive dredging can also create disturbances to aquatic ecosystems with adverse impacts. The dredging in Poyang Lake provides lessons for lake managers in many other regions who must balance the pros and cons of dredging to maintain sustainable developments of aquatic ecosystems.
Currently, many lakes around the world are suffering a number of problems such as eutrophication, water level change, increased erosion and sedimentation, loss of biodiversity and habitat, human health risks, accumulation of litter and garbage, and invasive species (ILEC-UNEP Citation2003), which may hamper the sustainable developments of multiple lake functions. Remote sensing techniques may provide methods to obtain the spatiotemporal variations of these problems, which will help managers or researchers analyze and understand the processes and mechanisms and make sound decisions for lake management.
Limitations
A number of issues were not addressed in this study that may be common problems for similar projects. First is the influence of lake bottom and submerged vegetation on SSC estimation accuracy. Lakes have optically shallow and deep water, and the water-leaving reflectance is affected by lake bottom for optically shallow water. Submerged vegetation may also affect the water-leaving reflectance. The optically shallow water and submerged vegetation in Poyang Lake might increase the water-leaving reflectance, and thus might result in an over-estimation of SSC. To analyze this obstacle, several difficulties must be resolved: (1) distinguish optically shallow from deep water; (2) determine the appearance of submerged vegetation; and (3) estimate the impacts of these factors on water-leaving reflectance considering different sediment type or vegetation density. These questions were beyond the scope of this study.
The second issue is the effect of mixed pixels on SSC estimation accuracy, which is a difficult problem when using images with medium spatial resolution. Along a water boundary, one MODIS pixel with 250 m spatial resolution might cover water, vegetation, bare soil, or a combination, which will result in an inaccurate SSC estimate if we considered this pixel as a pure water pixel. How to separate the water information from a mixed pixel is also beyond the content of this study; however, we tried to reduce the effect of mixed pixel on the spatiotemporal analysis of SSC by (1) using sampling points at least 500 m away from the lake shore; and (2) removing the mixed pixels along the water boundary in estimating SSC from MODIS images.
The third issue is the effect of image number on SSC variation analysis. In our study, only one image each month was selected to analyze the spatiotemporal variation of SSC. Poyang Lake is a hydrologically dynamic system with large human disturbances. Thus, one image might not accurately represent the general status of each month, and the spatiotemporal analysis of SSC in this study might have randomness at a certain level. Considering the 11-year spatiotemporal analysis, however, our results are valuable. Using all MODIS images with high quality might reduce but not completely overcome such randomness.
The fourth issue is the quantitative analysis of factors driving SSC variation. Poyang Lake is a dynamic system with huge water level and area changes, and its SSC variation is driven by complex natural and human factors. In this study, we focused only on the qualitative analysis of the factors driving SSC variation and reaffirmed that dredging was the dominant factor. The sediment transport modeling method, which considers important natural and human factors together, might improve our understanding on how much each factor contributes to the SSC variation in Poyang Lake.
Acknowledgments
This study was supported by the National Natural Science Foundation of China (Grant No. 40971191) and the Special Foundation of Ministry of Finance of China for Nonprofit Research of Forestry Industry (Grant No. 200904001).
References
- Bailey , M C and Hamilton , D P . 1997 . Wind induced sediment resuspension: a lake-wide model . Ecol Model. , 99 ( 2–3 ) : 217 – 228 .
- Bilge , F , Yazici , B , Dogeroglu , T and Ayday , C . 2003 . Statistical evaluation of remotely sensed data for water quality monitoring . Int J Remote Sens. , 24 ( 24 ) : 5317 – 5326 .
- Binding , C E , Greenberg , T A and Bukata , R P . 2012 . An analysis of MODIS-derived algal and mineral turbidity in Lake Erie . J Great Lakes Res. , 38 ( 1 ) : 107 – 116 .
- Blom , G , Duin , EHSV and Lijklema , L . 1994 . Sediment resuspension and light conditions in some shallow Dutch lakes . Water Sci Technol. , 30 ( 10 ) : 243 – 252 .
- Cawley , G C and Talbot , N LC . 2004 . Fast exact leave-one-out cross-validation of sparse least-squares support vector machines . Neural Networks. , 17 ( 10 ) : 1467 – 1475 .
- Chen , S S , Huang , W R , Chen , W Q and Chen , X Z . 2011a . An enhanced MODIS remote sensing model for detecting rainfall effects on sediment plume in the coastal waters of Apalachicola Bay . Mar Environ Res. , 72 ( 5 ) : 265 – 272 .
- Chen , S S , Huang , W R , Chen , W Q and Wang , H Q . 2011b . Remote sensing analysis of rainstorm effects on sediment concentrations in Apalachicola Bay, USA . Ecol Info. , 6 ( 2 ) : 147 – 155 .
- Chen , S S , Huang , W R , Wang , H Q and Li , D . 2009 . Remote sensing assessment of sediment re-suspension during Hurricane Frances in Apalachicola Bay, USA . Remote Sens Environ. , 113 ( 12 ) : 2670 – 2681 .
- Cigizoglu , H K and Kisi , O . 2006 . Methods to improve the neural network performance in suspended sediment estimation . J Hydrol. , 317 ( 3–4 ) : 221 – 238 .
- Craven , P and Wahba , G . 1978 . Smoothing noisy data with spline functions: estimating the correct degree of smoothing by the method of generalized cross-validation . Numer Math. , 31 ( 4 ) : 377 – 403 .
- Cui , L , Wu , G and Liu , Y . 2009 . Monitoring the impact of backflow and dredging on water clarity using MODIS images of Poyang Lake, China . Hydrol Process. , 23 ( 2 ) : 342 – 350 .
- Davies-Colley , R J and Smith , D G . 2001 . Turbidity, suspended sediment, and water clarity: A review . J Am Water Resour Assoc. , 37 ( 5 ) : 1085 – 1101 .
- De Leeuw , J , Shankman , D , Wu , G , De Boer , W , Burnham , J , He , Q , Yesou , H and Xiao , J . 2010 . Strategic assessment of the magnitude and impacts of sand mining in Poyang Lake, China . Reg Environ Change. , 10 ( 2 ) : 95 – 102 .
- Doxaran , D , Cherukuru , N and Lavender , S J . 2006 . Apparent and inherent optical properties of turbid estuarine waters: measurements, empirical quantification relationships, and modeling . Appl Optics. , 45 ( 10 ) : 2310 – 2324 .
- Feng , L , Hu , C , Chen , X , Li , R , Tian , L and Murch , B . 2011 . MODIS observations of the bottom topography and its inter-annual variability of Poyang Lake . Remote Sens Environ. , 115 ( 10 ) : 2729 – 2741 .
- Feng , L , Hu , C , Chen , X , Tian , L and Chen , L . 2012 . Human induced turbidity changes in Poyang L.ake between 2000 and 2010: Observations from MODIS . J Geophys Res. , 117 ( C7 ) : C07006
- Fok , M and Pang , T . 2006 . Finless porpoises in Wuhan, China. University of Hong Kong: Newsletter of the Department of Ecology & Biodiversity . 34 : 18 – 20 .
- Fraser , C , Hutchings , P and Williamson , J . 2006 . Long-term changes in polychaete assemblages of Botany Bay (NSW, Australia) following a dredging event . Mar Pollut Bull. , 52 ( 9 ) : 997 – 1010 .
- Hu , C , Chen , Z , Clayton , T D , Swarzenski , P , Brock , J C and Muller-Karger , F E . 2004 . Assessment of estuarine water-quality indicators using MODIS medium-resolution bands: Initial results from Tampa Bay, FL . Remote Sens Environ. , 93 ( 3 ) : 423 – 441 .
- [ILEC-UNEP] International Lake Environment Committee Foundation and United Nations Environment Programme . 2003 . World lake vision: a call to action , 142 Kusatsu (Japan) : ILEC and UNEP .
- Islam , M R , Yamaguchi , Y and Ogawa , K . 2001 . Suspended sediment in the Ganges and Brahmaputra Rivers in Bangladesh: observation from TM and AVHRR data . Hydrol Process. , 15 ( 3 ) : 493 – 509 .
- Jiang , H and Liu , Y . 2011 . Monitoring of TSS concentration in Poyang Lake based on MODIS data (in Chinese) . Yangtze River. , 42 ( 17 ) : 87 – 90 .
- Jiang , X W , Tang , J W , Zhang , M W , Ma , R H and Ding , J . 2009 . Application of MODIS data in monitoring suspended sediment of Taihu Lake, China . Chin J Oceanol Limn. , 27 ( 3 ) : 614 – 620 .
- Jorgensen , S E , Loffler , H , Rast , W and Straskraba , M . 2005 . Lake and reservoir management, Volume 54 (Developments in Water Science) , Amsterdam (Netherlands) : Elsevier .
- Keiner , L E and Yan , X-H . 1998 . A neural network model for estimating sea surface chlorophyll and sediments from thematic mapper imagery . Remote Sens Environ. , 66 ( 2 ) : 153 – 165 .
- Kerr , S J . 1995 . Silt, turbidity and suspended sediments in the aquatic environment: An annotated bibliography and literature review , Ontario Ministry of Natural Resources .
- Kilham , N E and Roberts , D . 2011 . Amazon River time series of surface sediment concentration from MODIS . Int J Remote Sens. , 32 ( 10 ) : 2659 – 2679 .
- Kirk , J TO . 1994 . Light and photosynthesis in aquatic ecosystems , New York (NY) : Cambridge University Press .
- Kloiber , S M , Brezonik , P L and Bauer , M E . 2002 . Application of Landsat imagery to regional-scale assessments of lake clarity . Water Res. , 36 ( 17 ) : 4330 – 4340 .
- Kutser , T , Metsamaa , L , Vahtmae , E and Aps , R . 2007 . Operative monitoring of the extent of dredging plumes in coastal ecosystems using MODIS satellite imagery . J Coast Res. , 50 ( special issue ) : 180 – 184 .
- Lee , Z P , Carder , K L and Arnone , R A . 2002 . Deriving inherent optical properties from water color: a multiband quasi-analytical algorithm for optically deep waters . Appl Optics. , 41 ( 27 ) : 5755 – 5772 .
- Li , F , Ji , W , Zeng , N , Wu , J , Wu , X , Yi , W , Huang , Z , Zhou , F , Barzen , J and Harris , J . 2005 . Crane Research in China. International Crane Foundation; Crane and Waterbird Specialists Group of Chinese Ornithological Society , Edited by: Wang , Q and Li , F . 58 – 65 . Yunnan Educational Publishing House .
- Li , R and Li , J . 2004 . Satellite remote sensing technology for lake water clarity monitoring: an overview . Environ Informatics (Archives) , 2 : 893 – 901 .
- Liu , C-D , He , B-Y , Li , M-T and Ren , X-Y . 2006 . Quantitative modeling of suspended sediment in middle Changjiang River from MODIS . Chin Geogr Sci. , 16 ( 1 ) : 79 – 82 .
- Liu , Q and Rossiter , D G . 2008 . Estimation on suspended sedimentation concentration of Poyang Lake using MODIS and hyperspectral data . Remote Sens Technol Appl. , 23 ( 1 ) : 7 – 11 .
- Liu , Y , Islam , A and Gao , J . 2003 . Quantification of shallow water quality parameters by means of remote sensing . Prog Phys Geogr. , 27 ( 1 ) : 24 – 43 .
- Lurling , M and Faassen , E J . 2012 . Controlling toxic cyanobacteria: Effects of dredging and phosphorus-binding clay on cyanobacteria and microcystins . Water Res. , 46 ( 5 ) : 1447 – 1459 .
- Ma , R , Duan , H , Tang , J and Chen , Z . 2010 . Remote sensing of lake water environment (in Chinese) , Beijing (China) : Science Press .
- Ma , R , Tang , J and Dai , J . 2006 . Bio-optical model with optimal parameter suitable for Taihu Lake in water colour remote sensing . Int J Remote Sens. , 27 ( 19 ) : 4305 – 4328 .
- Ma , Y , Xiong , C and Yi , W . 2003 . Sedimentary characteristics and developing trend of sediments in Poyang Lake, Jiangxi Province (in Chinese) . Resour Survey Environ. , 24 ( 1 ) : 29 – 37 .
- Martinez , J M , Guyot , J L , Filizola , N and Sondag , F . 2009 . Increase in suspended sediment discharge of the Amazon River assessed by monitoring network and satellite data . Catena. , 79 ( 3 ) : 257 – 264 .
- Miller , R L and Mckee , B A . 2004 . Using MODIS Terra 250 m imagery to map concentrations of total suspended matter in coastal waters . Remote Sens Environ. , 93 ( 1–2 ) : 259 – 266 .
- Min , Q . 1995 . On the regularities of water level fluctuations in Poyang Lake (in Chinese) . J Lake Sci. , 7 ( 3 ) : 281 – 288 .
- Nayar , S , Goh , B PL and Chou , L M . 2004 . Environmental impact of heavy metals from dredged and resuspended sediments on phytoplankton and bacteria assessed in in situ mesocosms . Ecotox Environ Safe. , 59 ( 3 ) : 349 – 369 .
- Nellis , M D , Harrington , J A and Wu , J P . 1998 . Remote sensing of temporal and spatial variations in pool size, suspended sediment, turbidity, and Secchi depth in Tuttle Creek Reservoir, Kansas: 1993 . Geomorphology. , 21 ( 3–4 ) : 281 – 293 .
- Ondrusek , M , Stengel , E , Kinkade , C S , Vogel , R L , Keegstra , P , Hunter , C and Kim , C . 2012 . The development of a new optical total suspended matter algorithm for the Chesapeake Bay . Remote Sens Environ. , 119 ( 0 ) : 243 – 254 .
- Pozdnyakov , D , Shuchman , R , Korosov , A and Hatt , C . 2005 . Operational algorithm for the retrieval of water quality in the Great Lakes . Remote Sens Environ. , 97 ( 3 ) : 352 – 370 .
- Robinson , J E , Newell , R C , Seiderer , L J and Simpson , N M . 2005 . Impacts of aggregate dredging on sediment composition and associated benthic fauna at an offshore dredge site in the southern North Sea . Mar Environ Res. , 60 ( 1 ) : 51 – 68 .
- Roman-Sierra , J , Navarro , M , Munoz-Perez , J J and Gomez-Pina , G . 2011 . Turbidity and other effects resulting from Trafalgar sandbank dredging and Palmar Beach nourishment. J Waterw Port C-ASCE . 137 ( 6 ) : 332 – 343 .
- Rorslett , B . 1996 . Modelling of underwater light in freshwater lakes using survival and failure time analysis . Freshwater Biol , 35 ( 1 ) : 11 – 24 .
- Ruhl , C A , Schoellhamer , D H , Stumpf , R P and Lindsay , C L . 2001 . Combined use of remote sensing and continuous monitoring to analyse the variability of suspended-sediment concentrations in San Francisco Bay, California . Estuar Coast Shelf Sci. , 53 ( 6 ) : 801 – 812 .
- Shankman , D , Keim , B D and Song , J . 2006 . Flood frequency in China's Poyang lake region: trends and teleconnections . Int J Climatol. , 26 ( 9 ) : 1255 – 1266 .
- Sipelgas , L , Raudsepp , U and Kouts , T . 2006 . Operational monitoring of suspended matter distribution using MODIS images and numerical modelling . Adv Space Res. , 38 ( 10 ) : 2182 – 2188 .
- Smith , R , Boyd , S E , Rees , H L , Dearnaley , M P and Stevenson , J R . 2006 . Effects of dredging activity on epifaunal communities - Surveys following cessation of dredging . Estuar Coast Shelf Sci. , 70 ( 1–2 ) : 207 – 223 .
- Spencer , K L , Dewhurst , R E and Penna , P . 2006 . Potential impacts of water injection dredging on water quality and ecotoxicity in Limehouse Basin . River Thames, SE England (UK): Chemosphere , 63 ( 3 ) : 509 – 521 .
- Tarrant , P E , Amacher , J A and Neuer , S . 2010 . Assessing the potential of Medium-Resolution Imaging Spectrometer (MERIS) and Moderate-Resolution Imaging Spectroradiometer (MODIS) data for monitoring total suspended matter in small and intermediate sized lakes and reservoirs . Water Resour Res. , 46 ( 9 ) : W09532
- Tyler , A N , Svab , E , Preston , T , Presing , M and Kovacs , W A . 2006 . Remote sensing of the water quality of shallow lakes: A mixture modelling approach to quantifying phytoplankton in water characterized by high-suspended sediment . Int J Remote Sens. , 27 ( 8 ) : 1521 – 1537 .
- Volpe , V , Silvestri , S and Marani , M . 2011 . Remote sensing retrieval of suspended sediment concentration in shallow waters . Remote Sens Environ. , 115 ( 1 ) : 44 – 54 .
- Wang , H Q , Hladik , C M , Huang , W R , Milla , K , Edmiston , L , Harwell , M A and Schalles , J F . 2010a . Detecting the spatial and temporal variability of chlorophyll-a concentration and total suspended solids in Apalachicola Bay, Florida using MODIS imagery . Int J Remote Sens. , 31 ( 2 ) : 439 – 453 .
- Wang , J , Lu , X , Liew , S C and Zhou , Y . 2010b . Remote sensing of suspended sediment concentrations of large rivers using multi-temporal MODIS images: an example in the Middle and Lower Yangtze River, China . Int J Remote Sens. , 31 ( 4 ) : 1103 – 1111 .
- Wang , J J and Lu , X X . 2010 . Estimation of suspended sediment concentrations using Terra MODIS: An example from the Lower Yangtze River, China . Sci Total Environ. , 408 ( 5 ) : 1131 – 1138 .
- Wang , J J , Lu , X X , Liew , S C and Zhou , Y . 2009 . Retrieval of suspended sediment concentrations in large turbid rivers using Landsat ETM plus: an example from the Yangtze River, China . Earth Surf Proc Land. , 34 ( 8 ) : 1082 – 1092 .
- Wang , Y . 1994 . Impact of Three-Gorge Project on erosion and deposition of Poyang Lake and its prediction (in Chinese) . J Lake Sci. , 6 ( 2 ) : 124 – 130 .
- Wu , G and Cui , L . 2008 . Time-series MODIS images- based retrieval and change analysis of suspended sediment concentration during flood period in Poyang Lake (in Chinese) . J Lake Sci. , 28 ( 12 ) : 6113 – 6120 .
- Wu , G , Cui , L , Duan , H , Fei , T and Liu , Y . 2011 . Absorption and backscattering coefficients and their relations to water constituents of Poyang Lake, China . Appl Optics. , 50 ( 34 ) : 6358 – 6368 .
- Wu , G , De Leeuw , J and Liu , Y . 2009 . Understanding seasonal water clarity dynamics of Lake Dahuchi from in situ and remote sensing data . Water Resour Manage. , 23 ( 9 ) : 1849 – 1861 .
- Wu , G , De Leeuw , J , Skidmore , A K , Prins , H HH and Liu , Y . 2007 . Concurrent monitoring of vessels and water turbidity enhances the strength of evidence in remotely sensed dredging impact assessment . Water Res. , 41 ( 15 ) : 3271 – 3280 .
- Wu , Y and Ji , W . 2002 . “ Study on Jiangxi Poyang Lake national nature reserve ” . Beijing , , China : Forest Publishing House .
- Zhang , B , Li , J , Shen , Q and Chen , D . 2008 . A bio-optical model based method of estimating total suspended matter of Lake Taihu from near-infrared remote sensing reflectance . Environ Monit Assess. , 145 ( 1–3 ) : 339 – 347 .
- Zhang , Y , Lin , S , Liu , J , Qian , X and Ge , Y . 2010 . Time-series MODIS image-based retrieval and distribution analysis of total suspended matter concentrations in Lake Taihu (China) . Int J Environ Res Public Health. , 7 ( 9 ) : 3545 – 3560 .
- Zhang , Y , Pulliainen , J T , Koponen , S S and Hallikainen , M T . 2003 . Water quality retrievals from combined Landsat TM data and ERS-2 SAR data in the Gulf of Finland . IEEE T Geosci Remote Sens. , 41 ( 3 ) : 622 – 629 .
- Zhao , H H , Chen , Q , Walker , N D , Zheng , Q A and Macintyre , H L . 2011 . A study of sediment transport in a shallow estuary using MODIS imagery and particle tracking simulation . Int J Remote Sens. , 32 ( 21 ) : 6653 – 6671 .
- Zhong , Y and Chen , S . 2005 . Impact of dredging on fish in Poyang Lake (in Chinese) . Jiangxi Fish Sci Technol. , 1 : 15 – 18 .