
Abstract
Phosphorus is the growth-limiting nutrient for phytoplankton in Lake Mead. Multiple agencies have developed an extensive phosphorus dataset with low detection limit since 2007 by obtaining monthly or biweekly samples at 19 monitoring stations throughout the lake and at all the major inflows. Approximately 2000 phosphorus grab samples were collected and analyzed as part of this effort. We developed a phosphorus budget for Lake Mead during 2007–2008 using these measured phosphorus data and evaluated its accuracy using the water and bromide budget developed in this study. Based on the phosphorus budget, total phosphorus (TP) loading from the Colorado River dominated external TP loading to Lake Mead, accounting for 98% of total external loading. The orthophosphate (Ortho-P) portion that is soluble and bioavailable accounted for <2% of the TP loading from the Colorado River, indicating that a significant portion of the Colorado River TP loading was in particulate form. Our analysis showed that 88% of this TP loading settled within 8 km of the river confluence. Calculated annual retention coefficients for Ortho-P indicated that Lake Mead retained about three-fourths of the influent Ortho-P; thus, Lake Mead is a significant phosphorus sink for the Colorado River, limiting the transport of phosphorus to downstream reaches or attached systems. In Boulder Basin, the most downstream basin where major drinking water intakes are located, Las Vegas Wash was the largest Ortho-P contributor during 2007–2008, validating the recent management efforts to reduce phosphorus loading in the Las Vegas Wash.
Key words:
For water supply lakes and reservoirs, increased algal production associated with eutrophication creates many operational problems for drinking water supplies and water treatment plants (WTP) (Walker Citation1983), including shortened filter runs, formation of trihalomethanes precursors (Ansari et al. Citation2011), and the persistence of taste- and odor-producing compounds. The most common cause of eutrophication in these water bodies is excessive phosphorus loading into the system (Correll Citation1998), and thus developing a phosphorus budget is an essential step to evaluate the level of biological productivity and understand the potential for eutrophication of lake or reservoir. A phosphorus budget can be used not only to identify and rank major phosphorus sources, but also to determine the quantity and fate of phosphorus entering the water body.
Phosphorus budgets have been developed and studied for many lakes and reservoirs worldwide, including Lake Erie between the United States and Canada (Burns et al. 1976), Lake Cameron in Canada (Dillon 1975), Lake Kinneret in Israel (Smith et al. Citation1989), Lake Okeechobee in the United States (Havens and James Citation2005), and Lake St. Clair in Canada (Lang et al. Citation1988). However, there has not been a complete and reliable phosphorus budget developed for Lake Mead, the largest reservoir in the United States where algal production is strongly phosphorus limited (Piechota et al. 2002, LaBounty and Burns Citation2005). Part of the reason is because most of the available in-lake phosphorus measurements are below the laboratory detection limit of 0.01 mg/L (based on the review of the data inventory by authors). These below-detection-limit data created great uncertainty in determining historical phosphorus mass storage in the lake and any interbasin phosphorus loadings, both of which are critical to construct a meaningful phosphorus budget. Since February 2007, the phosphorus detection limit has been lowered to 0.002 mg/L due to switching sample analysis to a different lab that specializes in analyzing samples with low concentration levels, resulting in more precise in-lake phosphorus concentrations. These new high quality data provided the basis for developing a reasonably accurate phosphorus budget for Lake Mead.
The main motivation for the development of a phosphorus budget for Lake Mead is to maintain overall water quality in the lake. Lake Mead currently supplies municipal water for the Nevada cities of Las Vegas, North Las Vegas, Henderson, and Boulder City, as well as municipal, industrial, and irrigation water for downstream users in Nevada, Arizona, California, and Mexico (Holdren and Turner Citation2010). Meanwhile, the lake receives highly treated effluent from the City of Las Vegas, City of Henderson, and Clark County municipal wastewater treatment plants (WWTPs).
All effluent enters Lake Mead through Las Vegas Wash (LVW), a main tributary located at the west end of the lake (), which has long been suspected as the main source of phosphorus loading into Lake Mead. The area near the LVW typically has high phosphorus concentrations, high chlorophyll a concentrations (a surrogate of algal levels), and low Secchi depth measurements that together indicate eutrophic to hypereutropic conditions (Holdren and Turner Citation2010).
In 2001, a major algal bloom occurred in Lake Mead during which the peak chlorophyll a concentrations reached >1000 μg/L (Rosen et al. Citation2012) and could be detected downstream as far away as a reservoir in San Diego County, California (CRRSCO Citation2008). Although multiple factors contributed to the occurrence of the algal bloom (LaBounty and Burns Citation2005), the main driving factor was attributed to increased phosphorus concentrations at the water surface during early spring 2001 (Rosen et al. Citation2012). This abundance of phosphorus, combined with warming water, promoted a rapid growth of the algal species in 2001 (LaBounty and Burns Citation2005, Rosen et al. Citation2012). Since 2001, the surrounding WWTPs have enhanced treatment for phosphorus removal, which resulted in a steadily decreasing phosphorus discharge from wastewater effluent (Holdren and Turner 2011). Although the algal abundance in the area close to the WWTP discharges is decreasing, the importance of this phosphorus reduction in relation to other phosphorus sources in the lake is still unknown because of a lack of a phosphorus budget. Determining the amount of phosphorus loading from LVW to the lake, and comparing this phosphorus loading to the loadings from other sources, became one of the key drivers of this study.
The unprecedented drop in water levels in Lake Mead since 1999 (Holdren and Turner 2011) provided additional motivation for constructing a phosphorus budget. The lowering lake water levels reduces the volume of water available to dilute incoming phosphorus loads and may lead to rising phosphorus levels and algal production in the lake. An accurate phosphorus budget can provide reasonable estimates of rising phosphorus levels and facilitate quick and appropriate responses from the lake management agencies.
The recent discovery of adult quagga mussels (Dreissena rostriformis bugensis) in Lake Mead has significant impacts on water quality, lake biology, and infrastructure (Holdren and Turner Citation2010, Wong et al. Citation2010). The study of water quality impacts of quagga mussels can benefit from the development of a phosphorus budget. For example, the phosphorus budget can be used to determine whether the lowering chlorophyll a concentrations in the lake in recent years can be attributed to the decline of phosphorus loadings or invasion of quagga mussels (Wong et al. Citation2010).
The objectives of this study were to (1) develop a phosphorus budget in Lake Mead and provide essential information for sound management of this lake, and (2) provide insight into the fate of major phosphorus loadings into the lake. Two distinct features are associated with this study. First, we used a large number of available high-quality phosphorus and flow data to study a phosphorus budget in one of the largest reservoirs in the world. Second, we constructed a bromide budget in the lake to estimate errors in the calculated phosphorus budget. Bromide served as a conservative tracer, while the residual of calculated bromide mass balance provides an indication of errors in the water mass balance and, to a certain extent, the phosphorus budget.
Study area
Lake Mead, formed in 1935 by the construction of Hoover Dam on the Colorado River, is the largest reservoir in the United States and one of the largest reservoirs in the world. The dam is located ∼40 km southeast of the City of Las Vegas, Nevada. The lake extends upstream from the dam along approximately 110 km of the Colorado River valley and straddles the states of Nevada and Arizona. At full capacity, the lake holds ∼37 km3 of water, has a surface area of 660 km2, and a maximum depth of 180 m (LaBounty and Burns Citation2007). Lake Mead serves as an important water supply for almost 2 million residents of Southern Nevada and provides recreational opportunities to more than 8 million yearly visitors to the Lake Mead National Recreation Area (Tietjen and Holdren Citation2010). The lake also provides flood control, electricity through hydropower generation, and water storage for millions of downstream users in Arizona, California, Nevada, and Mexico.
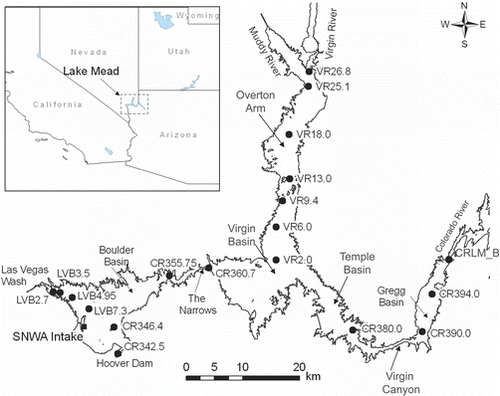
The lake comprises 3 main basins (): (1) the first immediately upstream to the Hoover Dam is Boulder Basin; (2) the next basin upstream of Boulder Basin consists of the Virgin Basin, Temple Basin, and the Overton Arm (referred as Virgin+Temple Basin hereafter); and (3) the most upstream basin is the Gregg Basin. These 3 basins are connected by 2 narrow channels: The Narrows connects Boulder Basin and Virgin+Temple Basin, and Virgin Canyon connects Virgin+Temple Basin and Gregg Basin.
There are 4 main inflows into Lake Mead (): the Colorado River enters the Gregg Basin; the Muddy and Virgin rivers discharge into the Overton Arm, which is connected to the northern part of the Virgin+Temple Basin; and LVW flows into the northwest part of the Boulder Basin. WWTPs from surrounding areas discharge into the LVW. The 2 principal outflows include releases through Hoover Dam to supply the lower Colorado River and withdrawals by the Southern Nevada Water Authority (SNWA). SNWA withdraws through intakes located at the east side of Saddle Island in Boulder Basin to supply municipal, irrigation, and industrial demand in the Las Vegas metropolitan area. Basic Management Industrial (BMI) also withdraws a small amount of water through its intakes near Saddle Island. Because the BMI intake is located close to the SNWA intakes, the withdrawals were designated as “SNWA/BMI outflow.” The average water residence times for the Gregg, Virgin+Temple, Boulder Basin, and the lake as a whole (estimated as lake volume divided by Colorado River flow rate) are ∼2, 12, 8, and 22 months, respectively.
Lake Mead is a deep, subtropical, monomictic lake (LaBounty and Burns Citation2005) that is thermally stratified from April to December and is generally well-mixed from January to March. During the stable summer stratification period, the epilimnion, metalimnion, and hypolimnion are about 15, 20, and up to 120 m thick, respectively, depending on the depth of the reservoir and location (LaBounty and Burns Citation2007). Lake Mead does not completely destratify every year. For example, LaBounty and Burns (Citation2007) reports that Boulder Basin completely destratified every other year on average between 1991–2007. During the same period, the dissolved oxygen in the near-bottom water layer in Boulder Basin remained >2 mg/L at all times, despite this incomplete destratification (LaBounty and Burns Citation2007).
Algal growth in Lake Mead is strongly phosphorus limited (Paulson and Baker Citation1983, Piechota et al. 2002, LaBounty and Burns Citation2005). Algae biomass typically peaks in spring and summer and declines in the winter (; FSI Citation2010). Thus, the algal growing season (GS) is between 1 April and 30 September, while the rest of the year is the non-growing season (Non-GS) according to the Lake Mead water quality standard (A. Preston et al., 2013, Flow Science Incorporated, unpubl.). The dominant algal species in Lake Mead is Pyramichlamys spp., a Chlorophyta or green algae (Rosen et al. Citation2012).
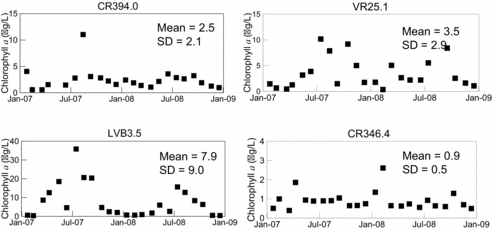
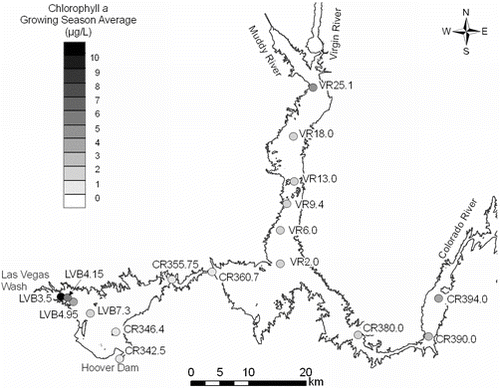
Chlorophyll a concentrations remain relatively low in the open water but are higher near the lake inflows (Holdren and Turner Citation2010). The Virgin+Temple Basin, the lower half of the Overturn Arm, and the upper end of Boulder Basin are oligotrophic to mesotrophic, while the areas near inflows are eutrophic to hypereutrophic (Holdren and Turner Citation2010). The chlorophyll a concentrations are highest in the area near LVW and in Las Vegas Bay (LVB; and ; FSI Citation2010) due to a large amount of bioavailable phosphorus entering from LVW (LaBounty and Burns Citation2005).
Methods
Conceptually, the mass budget for any substance (i.e., water, phosphorus, and bromide in this study) can be constructed by considering the area of interest (i.e., basin of the lake in this study) as a single “black box” using the following equation (Chapra Citation1997):
(1)
where ΔMx/Δt is the rate of observed change of the mass of material x in the water body over time period Δt; Ix and Ox are the inflow and outflow mass flow rates of the material; Sx is the sum of rate of change of internal sources (e.g., phosphorus release from sediment) and sinks (e.g., phosphorus settling to the bottom of the lake); and Ex is the residual of the mass balance. For phosphorus, Sx is unknown and can be inferred from Equationequation 1(1) by calculating all other terms in the equation using measured inflow, outflow, and in-lake data if Ex is zero. A positive value for Sx indicates an internal source while a negative value indicates an internal sink.
Ex is not zero, however, because of inaccuracy associated with field data and approximations (e.g., interpolation) used to develop the budget calculation. Thus, the calculated source and sink term in the phosphorus budget includes this non-zero residual term. The significance of this residual term relative to the total loading (or the true source and sink term that was expected to be of the same order of magnitude as the total loading in Lake Mead) is estimated by evaluating both the water and bromide budget in the lake that were constructed in the same fashion as the phosphorus budget.
Because the internal sources/sinks terms were near zero for water and bromide, a factor validated by small relative errors (RE) in the calculated water and bromide budget, the residual terms (i.e., Ex) for water and bromide can be calculated directly by computing the values of Ix, Ox, and ΔMx/Δt in Equationequation 1(1) using field data. The RE were calculated for water and bromide budgets as Ex expressed as a percentage of Ix (i.e., as a percentage of the sum of all inflow mass). The small RE of the water budget indicated an accurate water budget, a prerequisite for an accurate phosphorus balance. The RE of the bromide mass budget provided an additional check of the water budget and validation of approximations used to develop the phosphorus budget. Thus, a small RE in the bromide budget indicates that the major inflows and outflows are included in the calculation, and errors associated with approximations are relatively small. The budgets developed in this study were presented in annual averaged daily values to be consistent with common lake water quality regulations such as total maximum daily loading.
Water budget
The water budget for Lake Mead includes inflows, outflows, precipitation, evaporation, groundwater seepage, and changes in water storage. During any given period, the sum of outflows, evaporation, and groundwater seepage, and changes in water storage should balance the sum of inflows and precipitation. Change in water storage is defined as the difference in lake water volume between the end and the beginning of the period of concern. The groundwater seepage and precipitation (precipitation was estimated as <0.08 m/yr in both 2007 and 2008) were neglected, assumptions that were ultimately validated by the resulting small errors in the final water budget.
All major inflow rates were measured by the United States Geological Survey (USGS). Daily flow rates through Hoover Dam and the SNWA/BMI drinking water intakes were obtained from the United States Bureau of Reclamation (USBR) and SNWA, respectively. These measured daily flow rates were averaged annually. Evaporation data were not available at the lake for 2007 and 2008 and instead were estimated based on a hydrodynamic/thermodynamic simulation of the lake (A. Preston et al., 2013, Flow Science Incorporated, unpubl.). Evaporation rates were estimated as 2.3 m/yr for 2007 and 2.2 m/yr for 2008, which was consistent with the reported historical annual evaporation rate of 2.3 m/yr (Westenburg et al. Citation2006).
Phosphorus budget
Multiple agencies including USGS, USBR, SNWA, the City of Las Vegas, and the City of Henderson developed an extensive multiyear total phosphorus (TP) and orthophosphate (Ortho-P) dataset by sampling 19 monitoring stations and all of the major inflows on a monthly or biweekly basis. Samples analyzed for phosphorus data were taken from 3 to 8 depths at each station. Approximately 2000 phosphorus grab samples were analyzed and used for this effort.
Ortho-P is considered the soluble and biologically available portion of phosphorus in the water, and TP is the sum of Ortho-P, soluble nonreactive phosphorus, and particulate forms. Phosphorus loads and budgets were calculated for both TP and Ortho-P. Note that sampling for this work was conducted by many agencies, and no single sampling protocol was employed; however, samples were generally collected and analyzed using appropriate techniques as dictated by conditions, sampling location, and depth. Details on the sampling locations, depth, collection time, analytical methods and protocols, as well as data values can be found on the SNWA data inventory website (http://www.snwa.com/apps/wq_database/index.cfml). Sampling, analytical, and quality assurance and control (QA/QC) techniques were sufficient for the 0.002 mg/L detection limit, which was demonstrated through a combination of field, laboratory, and analytical replicate samples.
Phosphorus loads were calculated as the product of the rate of water inflow and the associated phosphorus concentration. In this study, phosphorus loads were calculated on a daily basis using a spreadsheet. While daily flow rates for all major inflows and outflows were available, phosphorus concentrations were measured monthly or biweekly. Linear interpolation was used to calculate daily phosphorus concentrations; the product of daily flow rate and phosphorus concentration then produced a daily phosphorus loading. Annual average flow rates, concentrations, and loadings reported here were calculated using these daily values. Phosphorus concentrations were assumed to be half of the detection limit when they were reported as “below the detection limit.” Calculation of phosphorus losses from the reservoir through the outflows followed the same approach as the phosphorus loading calculation discussed earlier.
The computation of the phosphorus storage in the lake was a 3-step process: (1) the inverse distance weighting method (weighting factor = 1; Shepard Citation1968) was used to interpolate field data from monitoring stations and set up the horizontal phosphorus distribution within the lake using a discretized model grid with a horizontal grid size of 300 m (A. Preston et al., 2013, Flow Science Incorporated, unpubl.); (2) linear interpolation was used to set up the vertical phosphorus distribution within the lake using a vertical grid size of 2 m; and (3) the concentrations throughout the whole lake were then numerically integrated over this discretized model grid to obtain the phosphorus mass in storage. The computed mass storage of phosphorus using this approach accounted for all phosphorus mass stored in the whole water body. Note that errors associated with the computation of the phosphorus storage were considered relatively small, as evidenced by the small RE in bromide budgets calculated using the same approach as phosphorus budgets.
The monitoring stations used for setting up the horizontal phosphorus distribution include CR394.0, CR390.0, CR380.0, CR360.7, CR355.75, CR346.4, LVB2.7, LVB3.5, LVB4.95, LVB7.3, VR2.0, VR6.0, VR13.0, VR18.0, and VR25.1 (). The monitoring stations used to represent inflow water quality were not included in setting up the in-lake horizontal phosphorus distribution. Due to a lack of data, the phosphorus deposition from the atmosphere was considered a part of the phosphorus source/sink term (i.e., Sx in Equationequation 1(1) ) in this study, but this source is believed to be insignificant because the phosphorus content of Mohave Desert soils seems to be generally low (Rundel and Gibson Citation2005) in unvegetated areas (the source for dust). The modeling study of atmospheric TP and Ortho-P deposition by Mahowald et al. (Citation2008) found that the simulated deposition rates of TP and Ortho-P in Lake Mead are approximately 2 and 0.1 mg/m2/yr, respectively. This translates to loadings of 2 and 0.1 kg/d for TP and Ortho-P, respectively, over the whole lake surface through atmospheric deposition. These loadings represent only <0.1% of the average TP and Ortho-P loadings from Colorado River, supporting our assumption of insignificant atmospheric deposition at Lake Mead.
In addition to the phosphorus budget for the whole lake, phosphorus budgets were also developed for each basin. This partitioning enables a better understanding of the spatial distribution of phosphorus loadings and concentrations. To calculate phosphorus loadings from the immediate upstream basin, daily flow rate and phosphorus concentrations were needed for flows through the channels connecting these basins (i.e., the Narrows and Virgin Canyon). Phosphorus data measured at stations either in or close to the channels (i.e., CR390.0 for Virgin Canyon and CR360.7 for the Narrows) were used for this purpose.
Daily flow rates between the various basins were calculated by conducting a water mass balance for the basin immediately upstream. Phosphorus loadings through the channels were calculated in vertical layers based on the flow distribution results of a 3-dimensional hydrodynamic simulation of Lake Mead (A. Preston et al., 2013, Flow Science Incorporated, unpubl.). Two vertical layers (0–30 m water depth and >30 m water depth) were used at the Virgin Canyon, and 3 layers (0–45, 45–100, and >100 m water depth) were used at the Narrows. Measured phosphorus concentrations were averaged in these layers and then combined with flows to calculate phosphorus loadings for each layer. The sum of the phosphorus loads for these layers produced the overall phosphorus loadings through each channel.
A phosphorus retention coefficient (R), defined as the ratio of the net amount of phosphorus retained in the lake sediment to the sum of external loadings, was calculated for each of these basins and for the whole lake. Following Equationequation 1(1) , R can be written as:
(2)
The RE of the phosphorus budget represents the error in the calculation of R. In this study, the RE of the bromide budget was used to provide an indication of the RE of the phosphorus budget associated with an unbalanced water budget and approximation approach. A positive retention coefficient indicates that a fraction (i.e., R) of the phosphorus external loading is deposited into the lake sediments; a negative retention coefficient reflects the sediment release and downstream transport of previously retained phosphorus. The significance of calculating the retention coefficient in the lake is to determine whether the lake is a nutrient sink (positive R) or nutrient source (negative R) as well as the importance of this source or sink in related to the total external loadings.
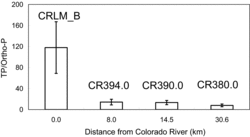
To closely examine the settling patterns of phosphorus particles from the Colorado River, ratios of TP concentration to Ortho-P concentration were calculated during the winter months (in this case, defined as Nov–Feb) at the stations in Gregg Basin including CRLM, CR394.0, CR390.0, and CR380.0. Considering there was minimal loss of Ortho-P due to limited algal consumption during the winter months, the ratio of TP to Ortho-P should remain constant in Gregg Basin if settling of phosphorus particles did not occur. The reduction in this ratio indicated the loss of TP due to particle settling. Note that the ratios of TP to Ortho-P presented here were averaged vertically at these stations to account for all the TP and Ortho-P over the whole water column.
Not included in the current analysis was the effect of infrequent storm events on the overall phosphorus budget because the existing phosphorus monitoring frequency is insufficient to capture these phenomena.
Bromide budget
All terms except the residual in the mass budget equation (i.e., Equationequation 1(1) ) for bromide were calculated based on field data. The bromide data as well as the sampling locations, depths, collection times, analytical methods, and protocols were obtained from the SNWA website (http://www.snwa.com/apps/wq_database/index.cfml). Bromide budgets in 2007 and 2008 were computed, and the RE were obtained for each basin as well as for the whole lake. The calculation of the bromide budget used the same approach and same units used for the phosphorus budgets (with the exception that the internal source term Sx is set to zero). In addition, the bromide dataset came from the samples obtained on the same day at the same monitoring stations as the phosphorus dataset. Thus, the RE of the bromide mass budget provided an additional check of the water budget and validation of approximations used to develop the phosphorus budget.
Results
Water budget
Colorado River inflow and Hoover Dam outflow dominated the water budgets for 2007 and 2008 (). The average flow rate for the Colorado River was approximately 378 m3/s and contributed about 97% of all inflow to the lake. The next largest inflow was the LVW with a 2007–2008 average flow rate of about 8.2 m3/s. The 2007–2008 average flow rate through Hoover Dam was about 370 m3/s and consisted of 95% of the outflow. The remaining 5% of the outflow was the withdrawal through intakes operated by SNWA/BMI with a 2007–2008 average flow rate of 19.0 m3/s.
Table 1 Annual water budget in Lake Mead and its individual basins for 2007 and 2008 in Lake Mead, NV. Symbols are inflows (I) and outflows (O), evaporation loss (S), rate of change of mass (ΔM/Δt), and residual (E) (see Equationequation 1 (1) ). There are no data for the flows through Virgin Canyon and the Narrows, and these flows were derived from Equationequation 1(1) . The relative error (RE) is the residual expressed as a percentage of the total inflow rate; all other terms are flow rates in m3/s.
The residuals were −2.3% (−8.7 m3/s) and −0.9% (−3.8 m3/s) of the measured total inflows in 2007 and 2008, respectively (). These small residuals suggested that measured flow rates were reasonably accurate and can be used to develop reliable bromide and phosphorus loading estimates. Note that the measured Colorado River inflow rates reported by USGS were rounded to the nearest 100 cfs (or 2.8 m3/s), and the residual errors for the water budget were of the same order of magnitude as the rounding error.
Phosphorus budget
The phosphorus budget for Gregg Basin showed that the Colorado River TP load into the Gregg Basin was quite large, and that the TP flux leaving the basin was an order of magnitude smaller (). In addition, the Ortho-P loads from the Colorado River made up <2% of the Colorado River TP load, indicating that a large portion of the TP loading from the Colorado River was in particulate form and settled out of the water column quickly after the flow reached a wider area of the basin.
Table 2 Annual phosphorus budgets in Lake Mead and its individual basins for 2007 and 2008. Terms include inflow loadings (I), outflow losses (O), internal sources/sinks (S), and mass storage change rate (ΔM/Δt) (see Equationequation 1(1) ). The computed S term includes the residual (E) term. A positive S term represents a source and a negative S term represents a sink. All terms are mass flow rates in kg/d.
Ratios of TP concentration to Ortho-P concentration during the winter months at Stations CRLM, CR394.0, CR390.0, and CR380.0 were calculated and plotted against the distance from the entrance of the Colorado River (). The reduction of the ratio of TP to Ortho-P from the Colorado River to the Station CR394.0 indicated that, on average, more than 88% of the TP loading from the Colorado River settled within 8 km of the river mouth. Similarly, more than 93% of the TP loading from the Colorado River settled in Gregg Basin (i.e., prior to Station CR390.0; ). The sediment depth survey in the Gregg Basin (Ferrari Citation2008) confirmed significant sediment accumulation since the construction of the dam in 1935. The sharp horizontal gradient of the sediment depth between the mouth of the river and the middle of Gregg Basin indicated that a large portion of the particles settled within the first few miles of the Gregg Basin, which is consistent with the findings obtained from the analysis presented here.
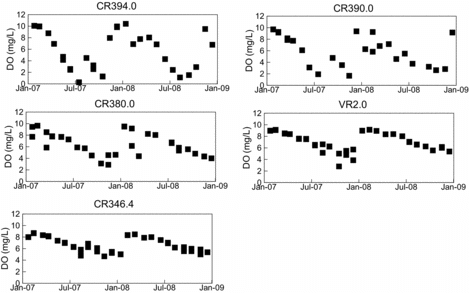
The Ortho-P annual retention coefficient for Gregg Basin was 0.24 for 2007 and 0.45 for 2008 (). The Ortho-P retention coefficients for the GS were significantly higher than those for the Non-GS, suggesting that algal production in the GS led to high Ortho-P uptake and subsequent settling. We noted that the retention coefficient became negative in the 2007 Non-GS, indicating possible release of Ortho-P from sediment back to the water. Because there are no data available for sediment phosphorus release to confirm this finding, the measured dissolved oxygen (DO) concentrations at the bottom were used to examine the occurrence of sediment phosphorus release because hypolimnetic anoxia can release phosphorus sequestered in the sediment. Time series of bottom DO concentrations for 2 stations in Gregg Basin, Station CR394.0 and CR390.0, revealed that bottom DO concentrations were generally lower in 2007 than 2008 (). In particular, bottom DO at Station CR394.0 decreased close to zero in July 2007 and was <1 mg/L in October of 2007, which is consistent with the relatively low GS retention coefficient and the negative Non-GS retention coefficient for Gregg Basin in 2007.
Table 3 Growing season (GS), non-growing season (Non-GS) and annual retention coefficient (R) for Ortho-P in Lake Mead and its individual basins for 2007 and 2008. A positive R represents retention and a negative R represents release or loading.
In the Virgin+Temple Basin, the Colorado River loading through the Virgin Canyon was still the dominant phosphorus source and contributed 89% and 84% of total external loading into the Basins for TP and Ortho-P, respectively (). Most of the remainder of the total external phosphorus loading came from the Virgin River, while the loading from the Muddy River was minimal due to its small flow rate. The internal sink for Ortho-P was approximately 62% and 54% of the total loadings on an annual basis in 2007 and 2008, respectively. During the GS of 2007 and 2008, 82% and 89%, respectively, of the Ortho-P was retained compared to only 38% and 46%, respectively, retained during the Non-GS (). Again, the seasonal variation in the retention coefficients was consistent with the seasonality of algal growth (and uptake of Ortho-P) observed in the lake (e.g., ), which followed by algae mortality and settling.
In Boulder Basin, the loading from the Narrows was the dominant source for TP, but the Ortho-P loading from LVW exceeded the Ortho-P loading from the Narrows (). This was because the flow rate at the Narrows was much higher than the LVW flow rate, while the Ortho-P concentrations, which make up a major portion of the TP from LVW (), were much higher in the LVW than those at the Narrows. The annual retention coefficient for Ortho-P for Boulder Basin was 0.44 for 2007 and 0.53 for 2008 (), suggesting that about half of the Ortho-P entering Boulder Basin was used up by the algae and retained in the basin on an annual basis. Furthermore, 64% and 79% of the Ortho-P was retained during the GS of 2007 and 2008, respectively, and only 11% and 46% of the Ortho-P was retained during the Non-GS of 2007 and 2008, respectively.
Table 4 Annual average and standard deviation of TP and Ortho-P concentrations (mg/L) at inflows, outflows, and inter-basin connections. Numbers in the parentheses are one standard deviation.
For the whole lake, 98% of TP loadings into the lake came from the Colorado River (). For Ortho-P, the loadings from the Colorado River and LVW constituted 58% and 35% of total Ortho-P loadings, respectively, on average in 2007–2008. The lake as a whole acted as a sink for both TP and Ortho-P (). More than 95% of TP was retained within the lake over the 2-year study period (). The annual retention coefficient for Ortho-P for the entire lake was 0.73 for 2007 and 0.75 for 2008 (), suggesting that about three-fourths of Ortho-P entering the lake was used up by the algae and retained in the lake. As mentioned earlier, algal production led to significant Ortho-P uptake in the GS (e.g., retention coefficient = 1.13 in 2007 and 1.04 in 2008 for the whole lake; ), and minimal algal growth in the late fall and winter led to low Ortho-P uptake in the Non-GS (e.g., retention coefficient = 0.29 in 2007 and 0.52 in 2008 for the whole lake; ). Because the average water residence time for the entire lake in 2007–2008 was about 19 to 22 months (estimated as lake volume divided by Colorado River flow rate), a significant portion of the water that entered the lake from the Colorado River is expected to reside in the reservoir on average for almost 2 years (or 2 growing seasons). As a result, a large portion of the Ortho-P entering from the Colorado River is expected to be used by algae and retained in the lake.
Bromide budget
Bromide budgets in 2007 and 2008 were constructed, and the RE of bromide budgets were calculated (). The largest absolute value of RE is about 11% and all others are <8%. These RE are fairly small considering the size and complexity of Lake Mead, suggesting relatively small errors are associated with the unbalanced water budget and approximation approach used in the calculated phosphorus budgets.
Table 5 Annual bromide budgets in Lake Mead and its individual basins for 2007 and 2008. Terms include inflow loadings (I), outflow losses (O), mass storage change rate (ΔM/Δt), and residual (E) (see EquationEquation 1(1) ). The relative error (RE) is the residual expressed as a percentage of the total inflow loadings in each of the water bodies. All other terms are in kg/day.
Discussion
When ranking the individual phosphorus loadings into Lake Mead, the dominant TP source was the Colorado River, but most of this TP loading settled in the Gregg Basin. For bioavailable Ortho-P, the loadings from the Colorado River and LVW were of the same order of magnitude, and the loading from the Virgin River ranked a distant third. For Boulder Basin, for which water quality is critical due to its proximity to the SNWA drinking water intakes and the discharge at Hoover Dam, LVW exhibits stronger effects on water quality than the Colorado River because the Ortho-P loading from LVW is confined to Boulder Basin, while a significant portion of the Ortho-P loading from the Colorado River is retained in the upstream basins.
High algal production in the area near LVW has been linked to the Ortho-P loading from LVW by multiple studies (Paulson and Baker Citation1983, LaBounty and Horn Citation1997, LaBounty and Burns Citation2005). The LVW Ortho-P loadings were 44% and 97% higher than the Ortho-P loadings through the Narrows in 2007 and 2008, respectively (). In addition, the Ortho-P loading from LVW mainly came from highly treated wastewater effluent from Las Vegas Valley and can be managed through enhancing phosphorus treatment at the WWTPs. Thus, reducing Ortho-P loading from LVW can be an effective management action to improve water quality in Boulder Basin. Major efforts to reduce phosphorus inputs to LVW from the WWTPs have recently been implemented (LaBounty and Burns Citation2007), and since 2002, the phosphorus load has been reduced by as much as 98% from the loadings of the 1970s and 1980s (Rosen et al. Citation2012).
The lake served as a significant sink for both TP and Ortho-P; more than 95% of TP and 73% of Ortho-P were retained within the lake over the 2-year study period (). Phosphorus concentrations between the mouth of the Colorado River and the outlet at Hoover Dam declined (), limiting the transport of phosphorus to downstream reaches or attached systems in California, Arizona, and Mexico. The finding of a net phosphorus sedimentation in Lake Mead is partially related to the absence of seasonal anoxia throughout most of the hypolimnion during the 2007–2008 period (or other recent years; ; LaBounty and Burns Citation2007, FSI Citation2010). As a result, we can reasonably conclude that sediment phosphorus release was not significant (Mortimer Citation1941–Citation1942). If the lake were to experience any seasonal anoxia that produces favorable redox conditions, however, the phosphorus sequestered in the sediment could be released back to the water column to stimulate algal growth (Burns and Ross Citation1972), potentially leading to water quality problems. Frequent lake monitoring and examining of dissolved oxygen profiles and phosphorus levels by lake management agencies is critical for detecting the onset of such events.
The annual average TP loading from the Colorado River in 2008 is more than 3 times of that in 2007 (). The Ortho-P loading from the Colorado River in 2008 is about 62% higher than in 2007. This significant increase of TP and Ortho-P in 2008 may be related to the High Flow Experiment (HFE) conducted at the upstream Glen Canyon Dam on 5 March 2008. During the HFE, water was released at Glen Canyon Dam into the Colorado River at a rate of about 1275 m3/s, almost 3 times the normal flow rate, for 60 hours to mimic natural seasonal flooding that carries sediments and redeposits them as sandbars along downstream reaches. This HFE generated widespread increase in area and volume of sandbars in the Colorado River, and these sandbars were then slowly eroded for the rest of the year (USGS 2008 HFE Fact Sheet: http://pubs.usgs.gov/fs/2010/3009/), implying that the HFE may produce high particulate phosphorus loading by resuspending sediments and transporting them into Lake Mead. The increase in TP loading in 2008 is mainly in particulate form and consistent with the findings of this study; however, this hypothesis needs further study to confirm and is out of the scope of this study.
The phosphorus budgets developed in this study were based on available field data. The accuracy of the budget methodology was verified by the small relative errors of water and bromide budgets; however, the water and bromide budgets do not include the atmospheric deposition or sediment release, which apply to the phosphorus budget. This study would certainly benefit from the direct measurements of atmospheric phosphorus deposition and/or sediment phosphorus release; however, these data are not currently available, and as such the atmospheric phosphorus deposition and sediment release were not quantified explicitly, but rather included as a part of the source/sink term. If future measurements of atmospheric phosphorus deposition and/or sediment release rates become available, then the methodology presented in this study could be repeated to provide refined estimates of phosphorus settling rates.
Nevertheless, the phosphorus budget developed here provides valuable information as to the relative importance of several external phosphorus sources for Lake Mead. In particular, it highlights the significance of the Ortho-P load from the WWTPs to productivity in Boulder Basin, thus validating the recent management efforts to reduce phosphorus loading from the WWTPs. The phosphorus budget provides a basis for the management and future study of one of the most important reservoirs in the United States.
Acknowledgments
Data were provided by USGS, USBR, SNWA, City of Las Vegas, and City of Henderson. Special thanks to Noel Burns of Lakes Consulting for useful discussions and advice associated with this project.
Funding
Funding was provided by the Clean Water Coalition and SNWA.
References
- Ansari AA, Gill SS, Lanza GR, Rast W. 2011. Eutrophication: Causes, consequences and control. Netherlands: Springer.
- Burns NM, Ross C. 1972. Oxygen-nutrient relationships within the Central Basin of Lake Erie. In: Project Hypo. Canada Centre for Inland Waters, Paper No. 6; USEPA Technical Report, TS-05-71-208-24:85–117.
- Burns NM, Williams JDH, Jaquet JM, Kemp ALW, Lam DCL. 1976. A phosphorus budget for Lake Erie. J Fish Res Board Can. 33:564–573.
- Chapra SC. 1997. Surface water-quality modeling. WCB/McGraw-Hill.
- [CRRSCO] Colorado River Regional Sewer Coalition. 2008. Quagga mussels and their effects on the aquatic system. . Available from: http://www.crrsco.org/Quagga%20mussels%20and%20their%20affects %20on%20the%20aquatic%20system.pdf
- Correll DL. 1998. The role of phosphorus in the eutrophication of receiving waters: a review. J Environ Qual. 27:261–266.
- Dillon PJ. 1975. The phosphorus budget of Cameron Lake, Ontario: the importance of flushing rate to the degree of eutrophy of lakes. Limnol Oceanogr. 20:28–39.
- Ferrari RL. 2008. 2001 Lake Mead sedimentation survey. Denver (CO): US Dept of Interior, . Bureau of Reclamation, Technical Service Center.
- [FSI] Flow Science Incorporated. 2010. Whole Lake Mead ELCOM-CAEDYM Model: additional of year 2008; prepared for Clear Water Coalition and Southern Nevada Water Authority.
- Havens KE, James RT. 2005. The phosphorus mass balance of Lake Okeechobee, Florida: Implications for eutrophication management. Lake Reserv Manage. 21(2):139–148.
- Holdren GC, Turner K. 2010. Characteristics of Lake Mead, Arizona-Nevada. Lake Reserv Manage. 26:230–239.
- LaBounty JF, Burns NM. 2005. Characterization of Boulder Basin, Lake Mead, Nevada-Arizona, USA – Based on analysis of 34 limnological parameters. Lake Reserv Manage. 21:277–307.
- LaBounty JF, Burns NM. 2007. Long-term increases in oxygen depletion in the bottom waters of Boulder Basin, Lake Mead, Nevada-Arizona, USA. Lake Reserv Manage. 23:69–82.
- LaBounty JF, Horn MJ. 1997. The influence of drainage from the Las Vegas Valley on the limnology of Boulder Basin, Lake Mead, Arizona-Nevada. Lake Reserv Manage. 13:95–108.
- Lang GA, Morton JA, Fontaine TD. 1988. Total phosphorus budget for Lake St. Clair: 1975–1980. J Great Lakes Res. 14:257–266.
- Mahowald N, Jickellset TD, Baker AR, Artaxo P, Benitez-Nelson CR, Bergametti G, Bond TC, Chen Y, Cohen DD, Herut B, et al. 2008. Global distribution of atmospheric phosphorus sources, concentrations and deposition rates, and anthropogenic impacts. Glob Biogeochem Cy. 22:GB4026.
- Mortimer CH. 1941–1942. The exchange of dissolved substances between mud and water in lakes. J Ecol. 29:280–329; . 30:147–201.
- Paulson LJ, Baker JR. 1983. The limnology in reservoirs on the Colorado River, Las Vegas (NV): University of Nevada, Department of Biological Science, Lake Mead Limnological Research Center. . Las Vegas Technical Report No. 11.
- Piechota T, James D, Batista J, Amy P. 2002. Final report: microbiological, limnological, and nutrient evaluations of the Las Vegas Wash/Bay system. University of Nevada at Las Vegas. Technical Report.
- Rosen MR, Turner K, Goodbred SL, Miller JM, editors. 2012. A synthesis of aquatic science for management of Lakes Mead and Mohave: U.S. Geological Survey Circular 1381. 162 p.
- Rundel MR, Gibson AC. 2005. Ecological communities and processes in a Mojave Desert ecosystem. Cambridge University Press.
- Shepard D. 1968. A two-dimensional interpolation function for irregularly-spaced data. In: Proceedings of the 1968 ACM National Conference. p. 517–524.
- Smith SV, Serruya S, Geifman Y, Berman T. 1989. Internal sources and sinks of water, P, N, Ca, and Cl in Lake Kinneret, Israel. Limnol Oceanogr. 34:1202–1213.
- Tietjen TE, Holdren GC. 2010. Lake Mead limnology and ecosystem management: preface. Lake Reserv Manage. 26:229.
- Walker JWW. 1983. Significance of eutrophication in water supply reservoirs. J Am Water Works Assoc. 75:38–42.
- Westenburg CL, DeMeo GA, Tanko DJ. 2006. Evaporation from Lake Mead, Arizona and Nevada, 1997–1999. . United States Geological Survey; Scientific Investigations Report 2006–5252.
- Wong WH, Tietjen T, Gerstenberger S, Holdren GC, Mueting S, Loomis E, Roefer P, Moore B, Turner K, Hannoun I. 2010. Potential ecological consequences of invasion of the quagga mussel (Dreissena bugensis) into Lake Mead, Nevada-Arizona. Lake Reserv Manage. 26:306–315.