
Abstract
Land use along lakeshores impacts littoral habitat. We used raster-based land use and land cover datasets as well as a statewide dock polygon dataset to assess the development status of lake shoreland on 150 Minnesota lakes. A dataset containing dock polygons identified using a semiautomated process performed best statewide. An older raster dataset that classified rural development based on the presence of buildings performed better than a recent dataset based on dominant land cover. We classified points along the shore as developed or undeveloped using proximity to a development indicator: either a raster cell with a developed land use or a dock point. We compared classifications derived from GIS data to actual development, which was defined by the presence of a manually identified dock on aerial photos, and used total operating characteristic (TOC) analysis to evaluate the performance of each dataset. All 3 datasets classified development better than random chance. The dock dataset performed best, and its results were consistent statewide, while the raster datasets' performance varied among ecoregions. Researchers should be aware that the prevalence of the condition being classified has a large impact on some commonly used metrics, such as accuracy and positive predictive value. The costs and tradeoffs of different types of error (false alarms or missed detections) will vary in different situations and should be explicitly considered when deciding how and when to use classification systems like these.
Investigations into the relationship between lakeshore land use and littoral habitat have increased in recent years. In north-central Minnesota, an estimated 15% of emergent and floating-leaf vegetation has been lost due to development (Radomski Citation2006). There is a strong, negative relationship between development and large woody structure (Christensen et al. Citation1996, Marburg et al. Citation2006), and in Wisconsin, large woody structure removal was shown to change the aquatic food web, resulting in slower growth of largemouth bass (Micropterus salmoides) and a steep decline in the yellow perch (Perca flavescens) population (Sass et al. Citation2006). In northern Wisconsin and Michigan, lakeshore development was associated with overall slower growth of largemouth bass (Gaeta et al. Citation2011) and bluegill (Lepomis macrochirus) production, and growth rates were more than 2 times lower in heavily developed lakes versus undeveloped lakes (Schindler et al. Citation2000). Other studies found that black crappie (Pomoxis nigromaculatus) and largemouth bass were less likely to nest adjacent to developed shoreline and that the spatial distributions of other fish species were significantly affected by the amount of development (Scheuerell and Schindler Citation2004, Reed and Pereira Citation2009). In addition to impacts on fish, density or diversity of other members of aquatic food webs such as frogs and macroinvertebrates are negatively correlated with lakeshore development (Woodford and Meyer Citation2003, Brauns et al. Citation2007, Remsburg and Turner Citation2009).
As lake managers have become more aware of the impacts of development on habitat and fish populations, the need for better methods to quantify lakeshore development at various scales has grown (Minns et al. Citation1996, Soranno et al. Citation2009). Although detailed information may be available at the local level from zoning maps, lake survey data, and high resolution photographs, these data are often labor intensive to extract and use, making regional interpretation and analysis challenging and expensive.
Available GIS datasets often cover large areas, but knowing which datasets will detect the low density development typical along lakes is not always obvious. Raster-based datasets may classify pixels by land use or land cover, which might conflict at different scales. Land use describes human activity on the land, and identifying this activity may require different spatial resolution or different thresholds for classification. Land cover is determined by visual observation of a given area and is often compiled via automated interpretation of satellite images (Homer et al. 2004, Xian et al. Citation2009). When all of a given pixel fits the same category, such as cultivated or urban, land use and land cover schemes will yield the same result. In other cases a pixel may partly fit more than one category, and differing classification systems can yield different results. For example, residential areas with largely intact tree canopies would be labeled as “forest” by a land cover scheme that looks for >25% forest canopy, but also fit a “developed” land use defined by the presence of a dwelling or other structure.
The Minnesota Department of Natural Resources (DNR) recently completed an inventory of habitat conditions for all of the state's waters managed for fish. With more than 3000 lakes >20 ha to analyze, we used GIS-based techniques to complete this investigation, compiling an inventory of watershed land use to reflect water quality conditions (Cross and Jacobson Citation2013) and undertaking a separate analysis of lakeshore land use and in-water structures as indicators of littoral habitat conditions, described here.
Our goal was to predict the extent of development, both at the lake level, as needed for regional planning, and at the scale of individual shoreline segments for targeting and prioritizing management actions. A binary classification model was used to characterize points along the shoreline of lakes as developed or not developed. We classified points based on their proximity to a development indicator in each of 4 GIS datasets and evaluated the correspondence with the assumed actual state of development derived from manual photointerpretation. We examined 2 raster-based GIS datasets: one that classified 30 m pixels based on the dominant land cover and one that classified cells with buildings as developed, even when the dominant land cover fit another category. We also made a composite dataset that merged the 2 datasets. Finally, we analyzed a recently created feature dataset derived from semiautomated dock identification on aerial photos (Beck et al. Citation2013). We used a recently introduced variation on receiver operating characteristic (ROC), the total operating characteristic (TOC), to evaluate the various datasets' efficacy for classifying shoreline development status along a range of threshold distances (Pontius and Si Citation2014).
We suspected that differences in land cover types between ecoregions might affect the utility of the GIS analysis technique, particularly when using land cover data, because prairie landscapes afford a much different view of low density development than coniferous forest cover. We therefore examined the datasets at the US Forest Service Ecological Classification System's province level as well as for the state as a whole (Bailey Citation1995, Cleland et al. Citation1997).
Materials and methods
GIS dataset
We used 2 raster datasets with coverage of the entire state of Minnesota. The National Land Cover Database (NLCD) is based on a decision-tree classification of circa 2011 Landsat satellite data (Jin et al. Citation2013). There are 15 land cover classes, including 4 levels of development (open space, low intensity, medium intensity, and high intensity). Developed land use is assigned to areas where 30% or more of a cell is constructed (buildings, pavement, or lawn grass); the 30 m cell size of the NLCD data means that only large expanses of pavement or buildings are classified as developed. Cells are classified as forest when the forest canopy covers >25% of the cell. In rural, forested areas with scattered homes, these thresholds categorize many areas with a developed land use as forest, based on the predominant land cover, which is often the case near lakes in central and northern Minnesota.
The second raster dataset is called Minnesota Land Use and Cover – A 1990's Census of the Land (MNLU). These data were compiled by the Minnesota DNR from 6 different source datasets, which creates some regional variation due to the different source data for different parts of the state. Much of the MNLU source data were also based on Landsat images, but thresholds for classifying development were lower, and some of the source datasets also included human interpretation of land use from high resolution aerial photos (Minnesota DNR Citation1996). MNLU has a 30 m cell size and contains 8 different classes, one of which is urban and rural development. Cells where buildings were identified are classified as developed, and the threshold for the forest classification is two-thirds canopy cover. We included this dataset despite its age because its classification thresholds and source data seemed to identify rural developed land use more accurately than NLCD. Because lakeshore rarely reverts to a natural state once developed, and existing development may be correlated with future development (Pontius and Si Citation2014), we believed the MNLU data could have value for predicting current conditions.
ArcMap 10.1 (Environmental Systems Research Institute, Redlands, CA) was used for spatial analysis unless otherwise specified. We reclassified the raster data, grouping land use classes to create new raster files where cells were classified as either developed or not developed. We generated a third, combined dataset in which the developed category included any cell classified as developed in either the NLCD or MNLU dataset. Three new feature datasets were created containing points located at the center point of each developed raster cell in the MNLU, NLCD, and combined datasets.
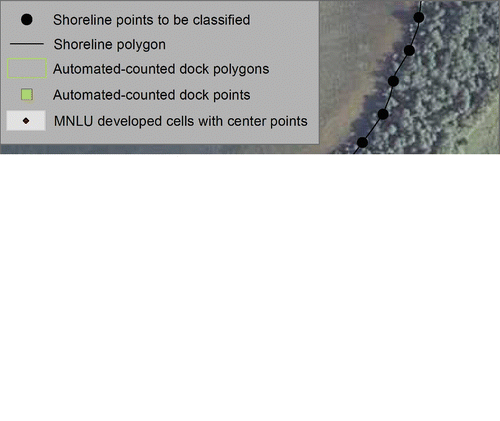
We also examined a feature dataset consisting of docks identified using a semiautomated analysis of digital aerial images (Beck et al. Citation2013). This dataset contains dock polygons for 4261 lakes managed for fish by the Minnesota DNR. The dock polygons were extracted from 2008 National Agricultural Imagery Program (NAIP) 1 m resolution digital aerial photos, taken from May through September (USDA Citation2014). We transformed the dock polygons to points, which we moved to the closest location on each lake shoreline polygon using the snap geoprocessing tool. We refer to this data as automated-counted docks throughout this manuscript.
Shoreline classification
The actual state of development was determined by manual identification of artificial in-water structures such as docks, rafts, trampolines, boat lifts, and other manufactured structures on high resolution aerial photographs. As in Beck et al. (Citation2013), we refer to these structures collectively as “docks” throughout this paper. Docks are easier to identify on air photos than buildings, which may be obscured by trees, and the presence of a dock is conclusive evidence that human activity has occurred in the water, potentially altering habitat. We viewed 2008–2010 NAIP aerial photos and assigned a point to each visible dock (USDA Citation2014). Simple dock and boat lift complexes were assigned a single point, but complex docks with several branches (such as a marina) were assigned one point for each branch so that the number of points would better reflect the area potentially impacted by docks and related activity. Other structures such as rafts and trampolines were also assigned a point. If a dock was seen one year but was missing in another year, we still counted that dock because lakeshore properties commonly go unused in a given year. Docks on the same lot that were seen over several years were assigned a single point, even if they had moved slightly. When a road bridge bisected a lake, it was assigned a point because it represented an artificial structure. All dock points were placed at the closest perpendicular point on the shoreline polygon using the snap geoprocessing tool and we assigned development status to points on shore based on their proximity to a dock point. These data are referred to as manual-counted docks.
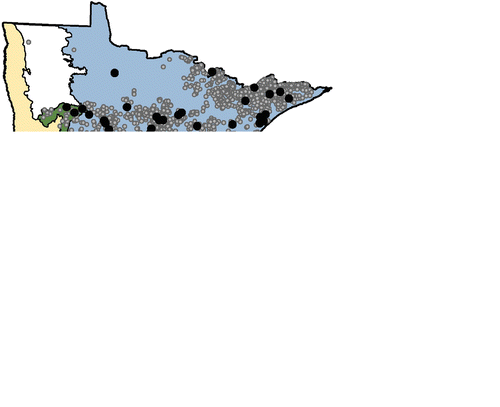
Most of Minnesota's lakes are located in 3 of the US Forest Service Ecological Classification System's ecological provinces: the Laurentian Mixed Forest (forest), Eastern Broadleaf Forest (transition) and Prairie Parkland (prairie; Cleland et al. Citation1997). We manually counted docks in 150 randomly selected lakes for our analysis, including 50 lakes from each of the 3 ecological provinces that contain a substantial number of lakes. ().
We created one reference point every 30 m along the shoreline of all 150 lakes using the sampleperpointsalonglines command in Geospatial Modeling Environment (Beyer Citation2012). For each of these points, we measured the distance to the nearest manual-counted dock point on the shoreline. If we found a dock within 30 m of a point, the point was designated “developed,” and if there were no docks within 30 m the point was declared “undeveloped.” These assignments represented the “true” state of development for each point and were used to evaluate the classifications made using the various GIS datasets.
We then measured the distance from each reference point to the center point of the nearest developed raster cell or automated-counted dock point and used these measurements to classify each point's development status, changing threshold distances from 0 to 13,000 m in 5 m increments (). The uppermost threshold value was chosen to ensure that the largest threshold included the extreme case where 100% of points were classified as developed. If a development indicator occurred nearer to the point under consideration than the cutoff distance, that point's state was classified as developed. For each point, the classified development state was compared to the true development state for each dataset under consideration, and we compiled confusion matrices for each dataset/threshold combination.
Dataset evaluation
Graphic depiction of changes in classification accuracy across a range of thresholds forms the basis for ROC analysis, which is widely used to evaluate medical diagnostics and spatial models (Zweig and Campbell Citation1993, Pontius and Schneider Citation2001, Schmieder and Lehmann Citation2004, Palaseanu-Lovejoy et al. Citation2009). ROC analysis and the metrics derived from it, while useful and informative, have some drawbacks (Pontius and Parmentier Citation2014). The TOC is a recent improvement on ROC that includes all of the information from ROC and adds all the information included in the confusion matrix (Pontius and Si Citation2014). We used TOC to evaluate the overall performance of each GIS dataset for classifying lakeshore development and to confirm our selection of threshold distances. We calculated the area under the ROC curve (AUC), which can also be derived from the TOC.
Fundamental to TOC analysis is the compilation of a confusion matrix, a contingency table specifying the number of true and false classifications. Classification accuracy can be evaluated using various metrics derived from the confusion matrix (). The TOC curve is constructed by plotting the number of hits versus the number of hits+false alarms over a range of different threshold values for the classifier (Pontius and Si Citation2014). We use the terminology from Pontius and Si (Citation2014), where “hits” refer to true positive classifications, “misses” are false negatives, “false alarms” are false positives, and “correct rejections” are true negatives. TOC tracks the inherent tradeoff between increasing the diagnosis rate at the expense of adding false alarms (Metz Citation2006). As you move from left to right along the TOC curve (increasing the threshold distance), the number of hits increases along with a simultaneous increase in the number of false alarms. The shape of the TOC curve reflects the overall efficacy of the model under consideration and can indicate the most appropriate threshold values to use because points falling closer to the upper left corner of the curve correspond with more hits and fewer false alarms. When all thresholds indicate associations greater than random chance, the TOC curve falls above the uniform line and the AUC is >0.5.
Table 1 Measures of classification accuracy derived from confusion or error matrices, composed of the count data in the first 4 rows (Metz Citation1978, Fielding and Bell 1997).
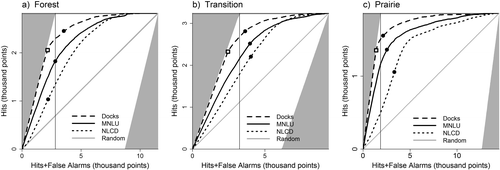
Contingency tables were constructed and statistical analyses performed using R statistical software version 3.1.2 (R Core Team Citation2014). TOC curves were also evaluated separately for each of the 3 ecoregions.
Our a priori preferred threshold distance for the raster data was 75 m, chosen because it includes the maximum required building setback for the state of Minnesota (61 m) and covers the first tier of lakeshore development without being overly influenced by agriculture, roads, or other upland land use that may not affect the immediate shoreline. For the automated dock data, our chosen threshold distance was 30 m (), and because this was also the distance between the shoreline points being classified, it classifies 2 shoreline points as developed for most dock points.
We used the chosen thresholds to compare the classified lakeshore development for whole lakes to the actual development state using manual-counted docks. The manual-counted docks were used to classify shoreline points using a 30 m threshold distance, just as for the automated-counted docks, and we calculated the number of developed points per shoreline kilometer for each lake. The slope of simple linear regressions with intercept = 0 were used to compare classified shoreline development to actual shoreline development. An accurate classifier would have a slope of 1, whereas a classifier that overestimates development will have a slope <1, and a classifier that underestimates development will have a slope >1.
Table 2 Selected characteristics for 150 Minnesota lakes as a whole and separated by ecoregion: Laurentian mixed forest (Forest); eastern broadleaf forest (Transition) and prairie parkland (Prairie). Developed shore points/km uses generated points along the shoreline classified by calculating their proximity to the nearest development indicator for each dataset: manual-counted docks, automated-counted docks, Minnesota Land Use and Cover (MNLU), National Land Cover Database (NLCD), and a composite dataset containing developed cells from each of the 2 raster datasets (Combined).
Prioritization tools
A useful tool for prioritizing management actions would display segments of developed or undeveloped shoreline, allowing lake managers to identify undisturbed or highly disturbed expanses. We created such a line feature, based on the 30 m shoreline points. Classified point files were separated into new files, containing only developed or undeveloped points. We generated 16 m buffers around each point, which slightly overlapped for adjacent points. These buffer polygons were merged using the dissolve geoprocessing tool, and we then extracted the intersection of these polygons and the lake perimeter line so that the resulting line feature contained segments of shoreline classified as developed or undeveloped. We completed the same process for both development states using both the reference dataset (manual-counted docks) and the GIS-based classifications (automated-counted docks, MNLU, and NLCD). We summarized the shoreline segments by lake and used 3 scenarios to assess performance as a prioritization tool.
Three different goals and sets of criteria were used to identify candidate lakes for management actions. First, we tried to identify pristine lakes that might be candidates for protection by selecting lakes with >90% undeveloped shoreline. Second, we looked for large, contiguous segments of undeveloped shoreline on highly developed lakes by selecting lakes with >40% of the shoreline developed and where the largest segment of undeveloped shoreline was at least 800 m. Third, we located lakes with highly fragmented shoreline that might be targeted for shoreline restoration projects. These were lakes with a mean length of undeveloped shoreline <300 m. We compared results derived from automated-counted docks, MNLU, and NLCD to results using manual-counted docks data.
Results and discussion
Dataset comparison
Manual-counted dock density for the 150 lakes ranged from 0 to 34 docks/km of shoreline. The amount of shoreline development differed between ecoregions, with a median dock density of 1.4 in the forest region, 3.9 in the transition region, and 0.5 in the prairie lakes. Highly developed lakes were relatively rare: 49 lakes had >5 docks/km, and of these 28 had >10 docks/km, and 8 had >20 docks/km. The median lakewide development for the combined raster data indicated substantially higher development than either source dataset, indicating considerable areas in MNLU and NLCD with little overlap ().
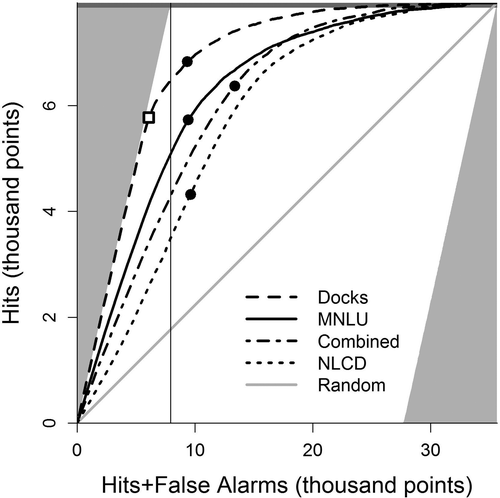
The TOC curve plots the number of points correctly classified as developed (hits) versus the total number of shoreline points classified as developed (hits+false alarms) for each dataset under consideration (). The vertical line crosses each curve at the point where the number of points classified as developed equals the actual number of developed points. The higher on the vertical scale that a curve crosses this line, the more hits it had. The automated-counted dock layer was the best performing dataset for classifying lakeshore development (). The MNLU dataset was a better predictor of lakeshore development than NLCD, despite being derived from data that were approximately 20 years older. Somewhat unexpectedly, the MNLU dataset also outperformed a the dataset that combined development data from MNLU and NLCD. TOC curves for the different datasets did not cross, which made interpretation of the area under the curves (AUC) straightforward (; Metz Citation2006). The AUCs were 0.95 for the automated-counted docks, 0.87 for MNLU, 0.84 for the combined data, and 0.78 for NLCD.
Our data indicated that NLCD development in rural areas was mainly limited to roads while MNLU excluded roads. The failure of the combined dataset to improve classification accuracy indicates that adding roads as a developed land use was not helpful for lakeshore classification. Although both datasets are composed of 30 m raster cells, the NLCD was uniformly created at 30 m resolution, and it classifies cells using the predominant land cover at that scale (Jin et al. Citation2013). The MNLU was amalgamated from different data sources, including some vector data, which was combined and rasterized into 30 m cells (Minnesota DNR Citation1996). The MNLU threshold for classifying developed land use was the detection of buildings while the NLCD threshold was >30% coverage with constructed materials. Despite the varying resolution of the data sources and the amalgamation into a uniform 30 m raster dataset, the MNLU assignment of a developed classification when buildings were identified resulted in more rural development being detected statewide. We conclude that this distinction produced a more realistic measure of anthropogenic activities on land, which is important for correctly identifying lakeshore development.
Examination of the 75 m threshold confirmed it was a reasonable choice because this point falls near the upper left corner of the curve for the MNLU model. The 75 m cutoff point for combined data returned a small gain in the number of hits but was more than offset by the increase in false alarms compared to MNLU. The MNLU data were error prone, with 70% of all developed points correctly classified as developed. The NLCD model performed poorly at 75 m, correctly classifying just 54% of developed points. Because the combined model did not perform better than MNLU, we dropped it from the subsequent analyses.
The raster datasets' classification success at the 75 m threshold varied between ecoregions and was particularly evident in the NLCD data (). The automated-counted dock dataset was the best classifier in all ecoregions and behaved similarly across all ecoregions, which was expected given the vastly different landscapes between ecoregions that would affect NLCD as well as the regional differences in data comprising the MNLU dataset. Docks are visible in the lake and thus are not as affected by the surrounding landscape; therefore, the automated-counted dock layer not only performed best, it also performed more consistently across ecoregions.
As expected, the automated-counted dock layer performed well because it was derived from high-resolution aerial photos and is more directly comparable to the manual-counted dock data used to define the true state of development. Due to our interest in aquatic habitat, our definition of development required the presence of a dock; however, developed parcels sometimes lack docks, especially in agricultural areas. Even the most accurate land use layer will be subject to this kind of error when compared to dock data. Regardless, the difference in effectiveness between the NLCD and MNLU datasets highlights the impact of different thresholds for classifying development.
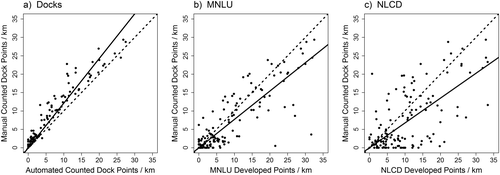
When we used each dataset to classify shoreline points for 150 lakes, the results mirrored our conclusions from the TOC analysis and illustrate biases for each dataset/threshold combination (). All 3 regression lines had a slope significantly different from 1 (P < 0.05), and the adjusted R2 values were 0.95 for the automated-counted docks, 0.83 for MNLU, and 0.68 for NLCD. The automated-counted docks underestimated actual development, while both raster datasets overestimated shoreline development. This result was also indicated on the TOC plot, where the 30 m threshold used for the automated-counted dock data was to the left of the line indicating the actual number of developed points (). The points marking the 75 m threshold for the raster datasets were to the right of that line, indicating that more development was classified than actually existed. Beck et al. (Citation2013) found that the automated-counted dock data overestimated development compared to a manually digitized dock dataset based on 2003–2004 images (Radomski et al. Citation2010). Our finding that it underestimates development likely results from our use of multiple years of images to classify the true development state. In any single year, some docks will not be in the water, and shadows or glare can make dock detection difficult at various locations. Viewing several years of images helped eliminate these sources of error.
Prioritization tool
We tested all 3 dataset classifications as they might be used to prioritize lakes for various management scenarios. The first scenario was aimed at selecting undeveloped lakes (). The positive predictive value was high for all 3 datasets, indicating a large ratio of hits to false alarms. Note, however, the low true positive rate for the NLCD data, reflecting its failure to classify more than half of the lakes meeting the criteria. The automated-counted docks performance was excellent by all measures, but perhaps most important, it missed only one lake that met our criteria. Missed lakes would be left out of our protection plans in this scenario, while falsely identified lakes could simply be dropped as we discover that they do not meet the criteria. Erring on the side of false alarms over missed lakes is a conservative error.
Table 3 Testing shoreline classification using 3 prioritization scenarios to evaluate amount and distribution of undeveloped shoreline. Lakes were selected using the automated-counted dock layer (Auto-Dock), the Minnesota Land Use and Cover (MNLU) data, and the National Land Cover database (NLCD) according to the criteria listed and compared to lakes selected using the same criteria derived from the manual-counted dock data, which represents the true development state.
Our second scenario attempted to identify developed lakes with relatively large, contiguous segments of undeveloped shoreline (). The conditions we chose were rare, with just 14 of 150 lakes meeting the criteria based on manual-counted dock data. In this scenario the MNLU dataset had the highest true positive rate, but it also had a low positive predictive value because half of the lakes identified did not meet the criteria. With 91% of the lakes not meeting the criteria defined by manual-counted docks, the automated dock layer's failure to detect more than half of the rare lakes that do meet this criteria is a more costly error than the MNLU's high false alarm rate. The classification accuracy of these 2 datasets was similar, demonstrating that accuracy alone does not reveal all information needed to evaluate the performance of different classification systems.
Third, we aimed to identify highly fragmented lakes that might be targeted for shoreline restoration projects (). There were few false alarms for all 3 datasets, however they all missed a substantial portion of the lakes that met the criteria, resulting in missed opportunities to target restoration projects in those lakes. The automated dock layer correctly identified more lakes in this scenario than the other datasets.
Cost of error
Both the prevalence of the condition being tested for and the cost of various types of error are important to consider when evaluating the utility of a diagnostic model. This consideration is well known in the medical screening field, where the vast majority of individuals who undergo screening do not have the condition being tested for. For example, in screening mammography, <1% of people screened actually have cancer; thus, a test that uniformly predicts that no subjects have cancer will be correct 99.5% of the time while failing to detect all patients with cancer. In mammography the median true positive rate is 85%, but due to the large proportion of cancer-free individuals in the screened population, the positive predictive value is 3–8% (Carney et al. Citation2010). We need both measures to understand that although many false positives occur during screening, most cases of cancer are detected.
The cost of missing a true positive in medical screening is often presumed to be much higher than the cost of further testing to identify a false alarm. The cost of both false alarms and missed detections should be considered when prioritizing lakes for management actions. In these scenarios, the main cost of false positive predictions is the time it takes to review lakes and rule them out. When searching for rare conditions, a low positive predictive value may be acceptable if the model helps identify uncommon conditions. Some false positives may be close to meeting the criteria and might be included with true positives upon review. The cost of false negatives is higher. Identifying the 8 false negatives out of 142 lakes classified as negative by the automated-counted dock data () would defeat the purpose of using a classification system to identify lakes; thus, the real cost of missed lakes in this scenario is the lost opportunity to protect 8 lakes. These scenarios illustrate the importance of validating the specific criteria being considered to clarify how various forms of prediction error will affect results.
Conclusions
The semi-automated dock identification methodology created by Beck et al. (Citation2013) resulted in a dataset with great potential for management planning at both regional and local scales. The line segment layer we derived from these data indicates developed and undeveloped sections of shoreline and may be used in a variety of management scenarios. Although NLCD land cover data are available for all of North America, we found that the scale of interpretation used in this dataset did not detect relatively low density development near lakes. Datasets derived using a lower threshold for developed land use, such as the MNLU, are more effective for classifying lakeshore development and could be used for regional planning purposes. Regions without reliable lakeshore development data would be well advised to create dock polygon layers following the techniques of Beck et al (Citation2013). Lake managers might also combine lakeshore development data with other spatial data, such as demographic trends, to further refine their ability to prioritize areas for protection or restoration.
Acknowledgments
We thank those who created the datasets used in this project, including the University of Minnesota, Minnesota DNR, the Association of Minnesota Counties, the Legislative Commission on Minnesota Resources, and the US Geological Survey. This manuscript benefitted from comments and statistical guidance from David Staples, Cynthia Tomcko, and Bruce Vondracek. Three anonymous reviewers provided valuable comments that greatly improved the manuscript.
Funding
This work was supported in part by the Federal Aid in Sport Fish Restoration program.
References
- Bailey RG. 1995. Description of the ecoregions of the United States.2nd ed. Washington (DC): USDA Forest Service, Misc Publ. No 1391(rev). 108 p.
- Beck MW, Vondracek B, Hatch LK, Vinje J. 2013. Semi-automated analysis of high-resolution aerial images to quantify docks in glacial lakes. ISPRS J Photogramm Remote Sens. 81:60–69.
- Beyer HL. 2012. Geospatial Modelling Environment (v0.7.3.0). (software); [cited 15 Jan 2015]. Available from: . www.spatialecology.com/gme
- Brauns M, Garcia X-F, Walz N, Pusch MT. 2007. Effects of human shoreline development on littoral macroinvertebrates in lowland lakes. J Appl Ecol. 44:1138–1144.
- Carney PA, Sickles EA, Monsees BS, Bassett LW, Brenner RJ, Feig SA, Smith RA, Rosenberg RD, Bogart TA, Browning S, et al. 2010. Identifying minimally acceptable interpretive performance criteria for screening mammography. Radiology. 255:354–361.
- Christensen DL, Herwig BR, Schindler DE, Carpenter SR. 1996. Impacts of lakeshore residential development on coarse woody debris in north temperate lakes. Ecol Appl. 6:1143–1149.
- Cleland DT, Avers PE, McNab WH, Jensen ME, Bailey RG, King T, Russell WE. 1997. National hierarchical framework of ecological units. In: Boyce MS, Haney A, editors. Ecosystem management applications for sustainable forest and wildlife resources. New Haven (CT): Yale University Press. p. 181–200.
- Cross TK, Jacobson PC. 2013. Landscape factors influencing lake phosphorus concentrations across Minnesota. Lake Reserv Manage. 29:1–12.
- Fielding AH, Bell JF. 1997. A review of methods for the assessment of prediction errors in conservation presence/absence models. Environ Conserv. 24:38–49.
- Gaeta JW, Guarascio MJ, Sass GG, Carpenter SR. 2011. Lakeshore residential development and growth of largemouth bass (Micropterus salmoides): a cross-lakes comparison. Ecol Freshw Fish. 20:92–101.
- Homer C, Huang C, Yang L, Wylie B, Coan M. 2004. Development of a 2001 National land cover database for the United States. Photogramm Eng Remote Sensing. 70:829–840.
- Jin S, Yang L, Danielson P, Homer C, Fry J, Xian G. 2013. A comprehensive change detection method for updating the National Land Cover Database to circa 2011. Remote Sens Environ. 132:159–175.
- Marburg AE, Turner MG, Kratz TK. 2006. Natural and anthropogenic variation in coarse wood among and within lakes. J Ecol. 94:558–568.
- Metz CE. 1978. Basic principles of ROC analysis. Semin Nucl Med. 8:283–298.
- Metz CE. 2006. Receiver operating characteristic analysis: a tool for the quantitative evaluation of observer performance and imaging systems. J Am Coll Radiol. 3:413–422.
- [Minnesota DNR] Minnesota Department of Natural Resources. 1996. Minnesota land use and cover – a 1990s census of the land. St. Paul (MN): Minnesota Department of Natu-ral Resources, MIS Bureau, Metadata; [cited 11 Apr 2015]. Available from: . http://www.mngeo.state.mn.us/chouse/metadata/luse8.html
- Minns CK, Kelso JRM, Randall RG. 1996. Detecting the response of fish to habitat alterations in freshwater ecosystems. Can J Fish Aquat Sci. 53(Suppl 1):403–414.
- Palaseanu-Lovejoy M, Nayegandhi A, Brock J, Woodman R, Wright CW. 2009. Evaluation of airborne lidar data to predict vegetation presence/absence. J Coast Res. 53:83–97.
- Pontius RG Jr, Parmentier B. 2014. Recommendations for using the relative operating characteristic (ROC). Landsc Ecol 29:367–382.
- Pontius RG Jr, Schneider LC. 2001. Land-cover change model validation by an ROC method for the Ipswich watershed, Massachusetts, USA. Agric Ecosyst Environ. 85:239–248.
- Pontius RG Jr, Si K. 2014. The total operating characteristic to measure diagnostic ability for multiple thresholds. Int J Geogr Inf Sci 28:570–583.
- R Core Team. 2014. R: a language and environment for statistical computing. Vienna (Austria): [cited 1 Dec 2014]. Available from: . www.R-project.org
- Radomski P. 2006. Historical changes in abundance of floating-leaf and emergent vegetation in Minnesota lakes. N Am J Fish Manage. 26:932–940.
- Radomski P, Bergquist LA, Duval M, Williquett A. 2010. Potential impacts of docks on littoral habitats in Minnesota lakes. Fisheries. 35:489–495.
- Reed JR, Pereira DL. 2009. Relationships between shoreline development and nest site selection by black crappie and largemouth bass. N Am J Fish Manage. 29:943–948.
- Remsburg AJ, Turner MG. 2009. Aquatic and terrestrial drivers of dragonfly (Odonata) assemblages within and among north-temperate lakes. J N Am Benthol Soc. 28:44–56.
- Sass GG, Gille CM, Hinke JT, Kitchell JF. 2006. Whole-lake influences of littoral structural complexity and prey body morphology on fish predator–prey interactions. Ecol Freshw Fish. 15:301–308.
- Scheuerell MD, Schindler DE. 2004. Changes in the spatial distribution of fishes in lakes along a residential development gradient. Ecosystems. 7:98–106.
- Schindler DE, Geib SI, Williams MR. 2000. Patterns of fish growth along a residential development gradient in north temperate lakes. Ecosystems. 3:229–237.
- Schmieder K, Lehmann A. 2004. A spatio-temporal framework for efficient inventories of natural resources: a case study with submersed macrophytes. J Veg Sci. 15:807–816.
- Soranno PA, Webster KE, Cheruvelil KS, Bremigan MT. 2009. The lake landscape-context framework: linking aquatic connections, terrestrial features and human effects at multiple spatial scales. Verh Int Verein Limnol. 30:695–700.
- [USDA] US Department of Agriculture. 2014. National Agricultural Imagery Program. Salt Lake City (UT): USDA, Farm Service Agency, Aerial Photography Field Office; [cited 23 Feb 2015]. Available from: . http://www.fsa.usda.gov/FSA/apfoapp?area=apfohome&subject=landing&topic=landing
- Woodford JE, Meyer MW. 2003. Impact of lakeshore development on green frog abundance. Biol Conserv. 110:277–284.
- Xian G, Homer C, Fry J. 2009. Updating the 2001 national land cover database land cover classification to 2006 by using landsat imagery change detection methods. Remote Sens Environ. 113:1133–1147.
- Zweig MH, Campbell G. 1993. Receiver-operating characteristic (ROC) plots: a fundamental evaluation tool in clinical medicine. Clin Chem. 39:561–577.