
Abstract
The amount of fine sediment deposition in some river reaches in the permanent backwater zone of the Three Gorges Reservoir has exceeded predictions made during the design period of the reservoir. In this study, a series of laboratory experiments were conducted on field samples of fine sediment from the Zhongxian reach, a typical reach in the permanent backwater region of the Three Gorges Reservoir. Compared with the existing formulas, an improved incipient velocity function for fine-grained sediment deposits was developed that includes the influence of water pressure and molecular force. Here we present a 2-dimensional (2D), depth-averaged, hydrodynamic-morphological model for simulating channel evolution processes. The proposed velocity formula was considered in the calculation of sediment transport, and the improved 2D numerical model was applied to the sedimentation process of the Zhongxian reach. Comparisons between model simulation results and field measurements were in acceptable agreement, illustrating the ability of the 2D model to predict fine sediment behavior and assist navigation management decisions in the permanent backwater region of the Three Gorges Reservoir.
Sediments greatly impact natural fluvial processes and human exploitation of rivers. Scour, transport, and deposition of sediment can render expensive infrastructures such as bridges and dams useless and can transport pollutants long distances from their source. Over the past decades, human impacts on channel morphology and fluvial processes have become an increasingly important factor, particularly dam construction and water diversions for water and energy needs (Nilsson et al. Citation2005). Dams can disrupt river continuity, intercept sediment, and change the fluvial hydrology, leading to altered channel patterns (Graf Citation2006, Kiss et al. Citation2008, Lu and Jiang Citation2009). Therefore, the ability to predict the transport of fluvial sediments has far-reaching applications, from conservation to river basin management and civil engineering design (Vignaga et al. Citation2013). There currently are >45,000 dams in major rivers worldwide, and much progress has been made in the study of downstream river dynamics in response to the changes in climate, river runoff, and sediment transportation (Aleem Citation1972, Batalla et al. Citation2004, Kummu et al. Citation2010, Draut et al. Citation2011).
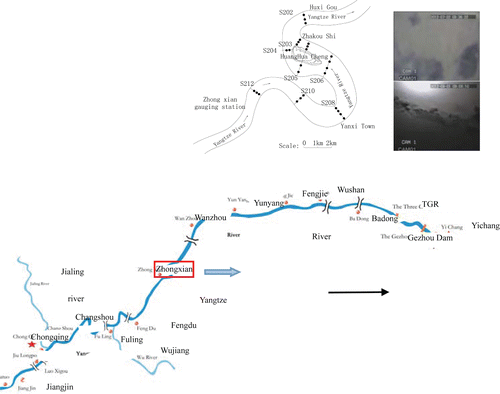
The Three Gorges Reservoir is a key project for flood control, navigation, and water resource development of the Yangtze River, China (). The completion of the Three Gorges Dam has led to a rapid and significant decrease in downstream sediment load. Recent research has focused on the changing trends of water and sediment discharge (Chen et al. Citation2001, Lu and Higgitt 2001, Xiong et al. Citation2009, Xu and Milliman Citation2009, Dai and Lu Citation2014), changes in the downstream channel patterns, and material fluxes and water exchanges between the river and large lakes (Li et al. Citation2009, Yang et al. Citation2011, Sun et al. Citation2012, Dai and Liu 2013). However, changes in sediment behavior have significantly influenced the lifespan of the reservoir, the size of the inundated area, the fluvial processes in navigation channels and ports in the backwater zone, and the operational condition of power plants and ship locks. The dam holds a reservoir 660 km long, stretching from Yichang to Chongqing (). Previous research investigated the impact of channel siltation on navigation conditions of waterways and ports in the fluctuating backwater zone, particularly in the Chongqing reach (Lin et al. Citation2004), focusing especially on environmental and land-slip impacts in the reservoir area (Yan et al. Citation2008, Zhang et al. Citation2009, Yang et al. Citation2010, Wolf et al. Citation2013).
After the first 10 years of operation, the sedimentation in the Three Gorges Reservoir has reached about 1.46 billion tons, 90% of which has accumulated in the permanent backwater zone (IRTCES Citation2012). Evidence to support a newly proposed phenomenon in the permanent backwater region of the Three Gorges Reservoir is the serious siltation of fine-grained sediments with a maximum thickness surpassing 50 m in the Zhongxian reach, about 350 km from the dam (Hu et al. Citation2013), a possibility that was neglected in the planning stage. The median grain size of the sediment deposits has reached 0.008 mm (Dong et al. Citation2010), composed of significant fractions of fine-grain-sized material (). Due to flocculation processes caused by Brownian motion, turbulent shear, and differential settling, the settling behavior of fine suspended particles could be different from those of noncohesive sands, and the fine sediment deposits would have greater resistance to entrainment than coarser sediments consisting only of sands (). Li (2013) and Li et al. (2015) investigated the settling velocity of the fine sediment in the Zhongxian reach compared with the field sediment sample and found that the settling velocity is about 10 times higher than the value under normal conditions considering the influence of the flocculation processes, and the critical deposition velocity was up to 0.3 m/s. Few studies have been conducted to research the incipient motion of the fine sediment deposit, however, which is also key to the sedimentation process in the Three Gorges Reservoir.
The morphology of natural river channels is determined by the interaction of fluid flow, sediment transport, and bank erosion (Knighton Citation1984). With the rapid development of numerical methods in fluid mechanics, computational modeling has become an important tool for studying the evolution of channel patterns. A common class of high resolution models of river morphology is 2-dimensional (2D) in the horizontal plane (Mosselman Citation1998). Most 2D models solve the depth-averaged continuity and Navier-Stokes equations along with the sediment mass balance equation using the methods of finite difference, finite element, or finite volume (Struiksma et al. Citation1985, Spasojevic and Holly Citation1990, Bosboom et al. Citation1997, Jia and Wang Citation1999). At present, various numerical models have been developed to simulate fluvial sedimentation in the Three Gorges Reservoir (Fang et al. Citation2006, Lu et al. Citation2010, Jia et al. Citation2013), but few studies have been conducted in response to the sedimentation process with fine sediments in the permanent backwater zone of the Three Gorges Reservoir and the prediction of the channel pattern evolution.
The objective of this study was to investigate the mechanics of fine sediment behavior and predict the morphological channel changes that can assist navigation management decisions in the Three Gorges Reservoir. Based on the research of the deposition process of fine sediment in the Zhongxian reach, a series of experiments was conducted to obtain an incipient velocity function for fine-grained sediment deposits. A 2D depth-averaged model for hydrodynamics, sediment transport, and river morphological adjustment was upgraded to account for the fine sediment behavior with the sediment transport submodel and then applied to the sedimentation process of the Zhongxian reach.
Data collection and methods
Description of study area and field measurements
The Zhongxian reach study area is 24 km long and 0.75–1 km wide, located 350 km upstream from the Three Gorges Dam in the permanent backwater area of the Three Gorges Reservoir (). The river channel of Zhongxian reach is basically meandering, with a central gravel bar exposed during low flows. The previous numerical sediment prediction for the Zhongxian reach was 40 million tons after the first 10 years of Three Gorges Reservoir operation, but because most fine sediments were trapped, the accumulated amount had reached 130 million tons by 2013, about 3 times the prediction (Bulletin of Yangtze River Sediment 2013). The left branch of the Zhongxian reach suffers from serious siltation, leading to navigational changes for ships travelling upstream from the original left flow route to the right flow route during the flood season.
Table 1 The dry density of fine sediment for the 6 group experiments.
To investigate the sedimentation process of this area, field measurements were conducted from 18 July to 2 August 2012. The discharge was about 40,000 m3/s, the water level about 160 m, and the water depth from 10 to 100 m. We surveyed representative river cross-sections simultaneously at 8 locations during the flood season, establishing 3–4 vertical lines and measuring ∼25 points () located by a GPS system on board a survey ship. The Acoustic-Doppler Velocimeter and water sampling equipment were fixed on an iron cage and connected to the ship with a steel rope to lift the cage for field measurements. A description of the field measurements can be found in Li et al. (Citation2015).
Experimental procedures
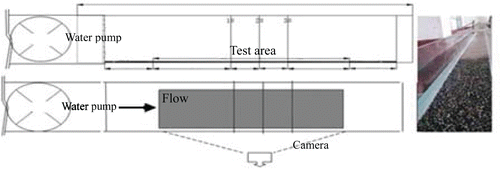
The sediment samples used in this research were from field observations in the Zhongxian reach (). Six group experiments () were conducted in a flume 6 m long, 0.25 m wide, and 0.5 m high, with adjustable bottom slopes ranging from 0.005 to 0.05; glass windows were used for observations (). Samples with identical water content were placed in the testing area; the median grain size was 0.008 mm. The flow velocity of the introduced water was accelerated slowly until the sediment bed was destroyed by current. During the experiment, water discharge was measured by a flow meter, water level measured by an ultrasound water meter, and flow velocity recorded by a potamometer.
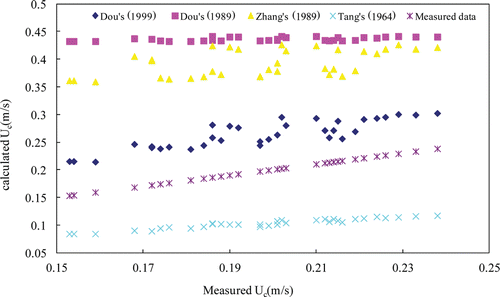
Table 2 Incipient velocity formulas for sediment used in the Yangtze River.
Formula improvement
A comparison of the measured and calculated incipient velocity () from formulas widely used in the Yangtze River () showed that Dou's (1999) formula and Tang's (1964) formula take into account the influence of water pressure and the molecular force, respectively, and they have a relatively smaller deviation than the formulas of Dou (Citation1960) and Zhang (Citation1989), with average relative errors (Umc-Ucc) of about −36% and 40%, respectively. The change trend of the incipient velocity calculated by Tang's (1964) formula is similar to that of our 6-group experimental data. Moreover, the largest water depth in the Three Gorges Reservoir can reach about 100 m, leading to more control of water pressure on the incipient motion of the fine sediments.
Table 3 Measured and calculated incipient velocity for 6 group experiments in the 6-m flume.
Based on the experimental data analysis, we upgraded Tang's (1964) formula to incorporate the effects of water pressure; the coefficients were determined and verified by experimental and field data. The cohesive force N taking into account the influence of the Van del Waal force (Tang Citation1964) and the water pressure (Yang et al. Citation2001) can be expressed as:
(1)
The incipient velocity of the fine sediment can then be rewritten as:
(2)
where H is the water depth; d is the median grain size; γ is the water density; γ′0 is the steady-state dry bulk density; γ′ is the actual dry bulk density; the value of parameter m is shown in ; and C, C1, k1, k2 denote the coefficients, adjusted to help the corresponding curve coincide with the field data. The coefficients can be fitted from the experimental data () as:
(3)
The improved and existing formulas were compared with the field observations from August 2012 for the specific gravity of sediment of 1.65 g/cm3 (). For fine sediment, the formula represents an improvement over the previously used formulas (); the correlation coefficient increased from 0.19 (Tang Citation1964) and 0.5 (Dou Citation1999) to 0.72 (improved formula), illustrating the ability of the improved formula to describe fine sediment behavior in the study area of the Three Gorges Reservoir.
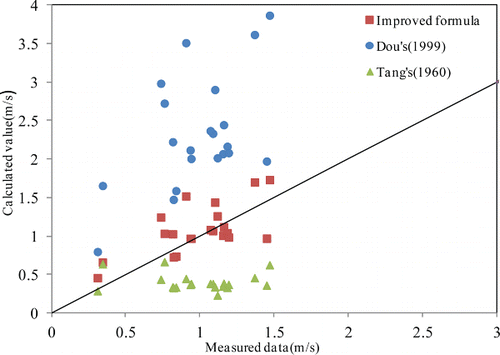
Table 4 Comparison of calculated and field incipient velocity in the Zhongxian reach in August 2012.
Numerical model description
The 2D numerical model was developed to account for effects of secondary currents, non-equilibrium sediment transport process, and bank failure processes due to bed scour (Xiao et al. Citation2012). The hydrodynamic model was solved in the orthogonal curvilinear grid system by using the Beam and Warming alternating-direction implicit (ADI) scheme. Effect of secondary currents was evaluated by the method of Lien et al. (Citation1999). The governing equations for flow model can be expressed as:
(4)
(5) where:
(6)
(7)
(8)
(9)
in which ξ and η are orthogonal curvilinear coordinates; h1 and h2 are the lame coefficients; U, V are the depth-averaged velocity components in the ξ and η direction of curvilinear coordinate, respectively; are the time-averaged velocity component in the ξ and η direction, respectively; flow discharge components per unit width are
; Z is the water level based on the reference datum; β is the correction coefficient considering the non-uniform of vertical velocity; f is Coriolis coefficient; g is the acceleration of gravity; C is the Chezy coefficient; υe is the depth-averaged vortex viscosity; Zs, Zb are the water and bed elevation, respectively; and D11, D12, D21, D22 are the depth-averaged dispersion stress terms that consider the secondary flow in curvilinear coordinates.
The governing equations for the original sediment transport model include a 2D numerical non-equilibrium suspended-load transport equation, an equation for bed-load transport, and equations of bed deformation, written as:
(10)
where ϵζ, ϵη are the depth-averaged longitudinal and transverse diffusivity coefficients of sediment in the directions; Sk, S*k are the depth-averaged suspended-load concentration and transport capacity of the kth grain size, respectively; Fk is the exchange term of the kth size group; Sok is the sediment mass entering the flow from the sides of the channel, which was not considered in this study; qbkξ, qbkη are the rate of bed load transport in the ξ and η direction, respectively; Lb is the distance of non-equilibrium sediment transport; αk is the saturation recovery coefficient for size group k; and ωk is the fall velocity of the kth grain size sediment.
A moving grid system was applied in these simulations because regenerating new grids can be time consuming in areas with complex boundaries, such as migrating island bars in multi-thread channels. The numerical solution was based on a finite difference method in the orthogonal curvilinear coordinate system. The finite difference equations corresponding to the differential equations were expressed in an alternating direction implicit form. All the discretization procedures were based on a second-order central difference scheme, except for the time differentials of water level in the continuity equation, which used a forward difference scheme. For the advective accelerations in the momentum equations, a combination of the first-order upwind scheme and second-order central difference (Falconer Citation1986) can be used in the 2D numerical model.
The flow model was verified using various laboratory experiments and field data, including flow measurements in a laboratory channel with consecutive bends and simulations on the downstream sedimentation of the Three Gorges Reservoir (Zhou et al. Citation2009). The sediment transport model was validated with field measurements on the changes of bed elevation of a 180° bend channel and tested with the physical modeling of meandering channels by Friedkin (Xiao et al. Citation2012).
Modification of the sediment transport model
According to field measurements of the fine sediments behavior in the study area, the sediment movement can be divided into 3 stages: siltation, erosion, and transportation (Li Citation2013). Combined with the experimental research on the deposition and incipient motion of fine sediments, the exchange term of the suspended-load transport Fk in Equationequation 10(10) can be rewritten as follows:
(11)
where β1, β2 denote the paraments to describe the movement of the fine sediments; Ukc is the incipient velocity of kth size group, calculated by the developed formula as Equationequation 2(2) in this study; and Uf is the critical deposition velocity, which is obtained as 0.3 m/s from the field measurements in the Zhongxian reach (Li Citation2013).
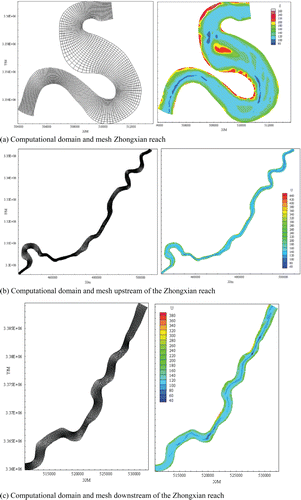
Computational domain and orthogonal curvilinear grid
The river channel in the study area is mostly meandering; therefore, an orthogonal curvilinear coordinate system was applied to 200 × 21 grids in the computational domain. The initial channel topography was mapped in October 2011 (). Daily observations of the inlet and outlet conditions for water discharge and water level were measured at the Qing Xichang station, 100 km upstream from the Zhongxian reach, and at the Wanxian station, 60 km downstream from the Zhongxian reach. To ensure the accuracy of the boundary conditions, the whole computational domain was about 184 km, and the grid system of 1600 × 21 nodes was generated, among which 200 × 21 nodes were arranged for the study area of Zhongxian reach (), 1000 × 21 nodes for the upstream reach (), and 400 × 21 nodes for the downstream reach (). The angles between the ξ and η grid lines were 88° and −92°, except for some grids close to the banks. The grid spacing was 80–110 m in the ξ direction and 25–40 m in the η direction.
Results and discussion
Calibration of flow model and discussion
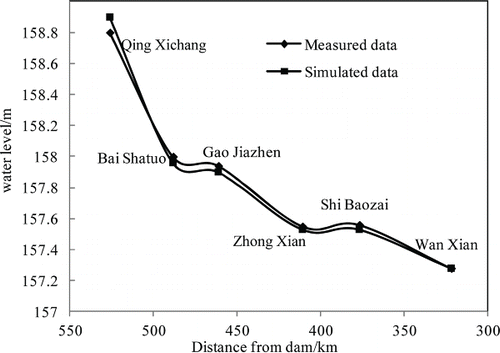
The flow model was validated using the measurement data on 14 July, 24 July, and 11 August 2012, when the observed flow discharges at the Qing Xichang station were 34,000, 63,000, and 23,200 m3/s, respectively, and the water levels at the Wanxian station were 157.78, 159.81, and 157.28 m, respectively; the simulated time interval was Δt = 6 s.
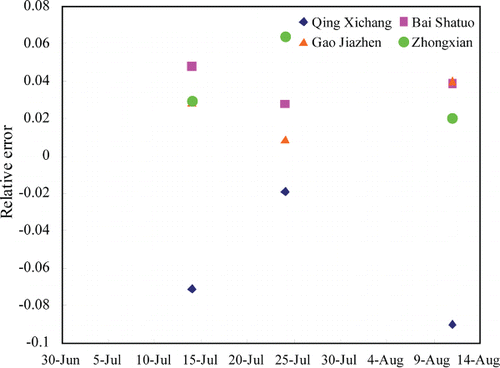
The calculated water levels at the measured stations along the river were in acceptable agreement with the field measurements when the discharge was 63,000 m3/s on 24 July (). The relative error at the 4 reference stations was <0.08 m under various discharges. The performance of water level in the entrance of the Qing Xichang station was slightly higher than the measured value (), which may be due to the uncertainties introduced by the initial and boundary conditions. As the sinuosity increases along the river, the impact of the secondary currents cannot be disregarded, leading to increasing discrepancy; however, the developed 2D numerical model takes into account the influence of secondary currents in the hydraulic submodel. The relative error ranged from 0.02 to 0.07 in this simulation, and the maximum deviation occurred at the Zhongxian station under the largest discharge on 24 July 2012.
Observed and calculated cross-sectional distributions of depth-averaged velocity at the typical cross sections on 11 August 2012 () show a difference between the calculated and measured velocity of <0.05 m/s, with the maximum deviation occurring at the bend, especially at the apex of the bend. The relative error decreased with the decreasing sinuosity, which contributed to the accuracy of the secondary currents simulation (the same conclusion can be drawn from ). As flow entered the river bend (), the mid-channel bar and the secondary currents contributed to the obvious asymmetrical velocity pattern; the velocity increased as the distance from the left bank increased. The velocity of the right course increased to 3 times that of the left branch at the tail of the gravel bar. After the flow confluence, the influence of the gravel bar decreased, and the velocity at cross-section S202 recovered to a symmetrical pattern (). The simulated change trends of the flow velocity along the river reach qualitatively duplicated the observed changes of flow.
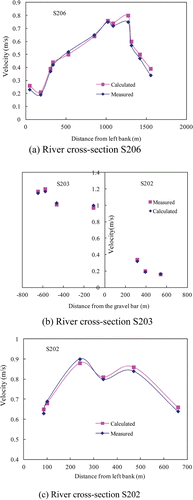
In the simulated flow field (), the contours of flow velocity near the gravel bar indicate that the velocity in the right course was about 3 times higher than that in the left course, similar to the field measurements of the typical cross-sections (). The inner bank of the nearby left entrance of the second bend has a relatively deep bed level, leading to a lower velocity compared with the other location of the same cross-section, which would result in sedimentation.
Calibration of the sediment transport model and discussion
The sediment transport model was validated using the measurement data from 2012. Daily discharges at the Qing Xichang station were measured as the inlet boundary condition (), and the daily water levels of the Wanxian station were measured as the outlet boundary condition (). The time interval length was 12 s. Considering the grain size of the fine sediments along the river reach (D50 = 0.008 mm; ), calculation of suspended-load concentration was uniformly conducted in this simulation. The sediment feed rate at the Qing Xichang station was calculated () with a computational time interval of Δt = 12 s for this simulation.
The amount of sediment deposition in the study area () indicated that the performance of our improved model was superior; by simulating the physical mechanics of the fine sediment behavior in this study area, the deviation of the total sediment deposits decreased to 15%. Trends of the relative errors relate to the channel pattern and were higher in the meandering reach section than that in the straight reach.
The simulated results also indicate that the original 2D numerical model cannot exactly reflect the sedimentation process; the amount of deposited sediment was much smaller than the field measurements, only 30% of the observed value.
The comparison of bed topography between modeled and measured data () shows that the calculated river bed level using the original model was not in agreement with the observed values (). The bed level in the left branch was lower than the field measurements, which can be attributed to the inaccurate formula used to describe the fine sediment behavior in the study area. The improved model computed an acceptable result with the measured data (). The main deposition in the Zhongxian reach occurs in the left branch, and the simulated maximum depositional thickness can reach 3 m compared with the original model of 1.2 m, which is about 80% of the field survey in 2012. This value underestimates the sediment deposition in the point bar (inner bank) at the entrance of the second bend with the gravel bar; however, the improved 2D numerical model can reasonably reproduce the river bed topography with the measured data.
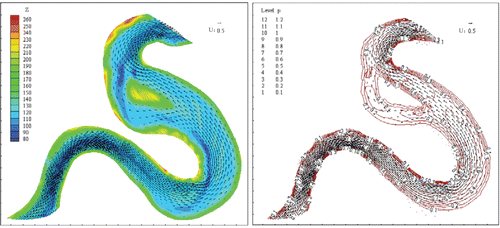
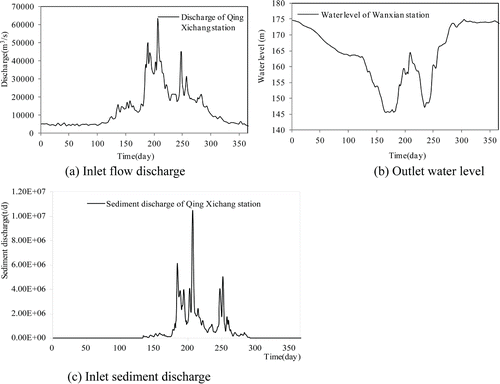
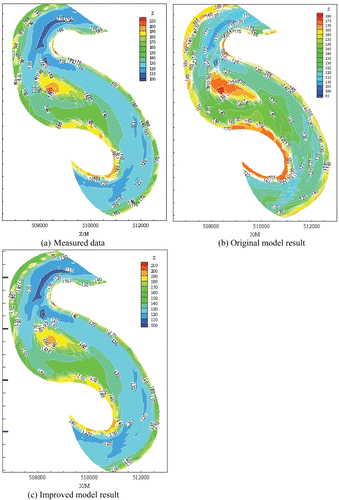
Table 5 Size distribution of the suspended load at the 2 control stations in the permanent backwater zone of TGR.
Table 6 Comparison of the sedimentation between the calculated and field data in the Zhongxian reach.
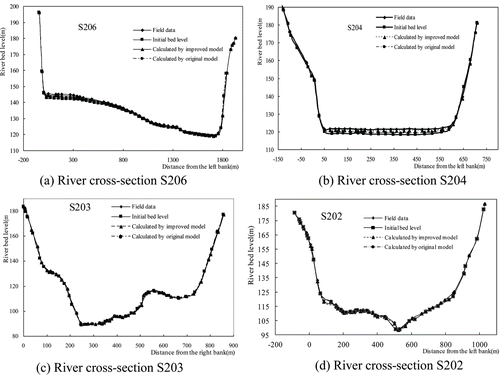
A comparison of the changing trends of the river cross-sections between modeled and measured data () indicates that the improved model computed an acceptable result with the field measurements, and the bed level of the original model was smaller than that of the improved model and field observation. At the entrance of the bend, considering the lower velocity upstream of the left side (), the reduction of the sediment capacity would lead to sedimentation downstream.
The changes of the left and right branches at the end of the gravel bar () show that accretion occurred in the left branch, and the bed level increased by about 2 m along cross-section S204 whereas the right branch remained basically stable, as shown in river cross-section S203. In comparison with the changes in the velocity distribution for cross-section S202, the bed level rose by 0.5 m in the main channel (). The overall results demonstrate that the improved 2D numerical model can reproduce the sedimentation process and help explain the evolution of the channel configuration in the Zhongxian reach of the Three Gorges Reservoir.
Conclusions
After implementation of the Three Gorges Reservoir, the fine sediment behavior showed typical characteristics, and most sediments were deposited in the permanent backwater zone beyond the previous research of the sedimentation process, leading to changing trends in the original flow route for navigation. In this study, field observation and a series of experiments were conducted to study the incipient motion of the fine sediments in the typical Zhongxian reach of the Three Gorges Reservoir. Compared with the existing formula, an improved incipient velocity formula was developed to describe the fine-grained sediment behavior, taking into account the developed 2D numerical model to simulate the sedimentation process of the Zhongxian reach. Comparisons of the water level, velocity distribution, and the changes of the bed configuration indicate that the improved 2D numerical model can be applied to predict changing trends of the sedimentation processes under different discharge rates and supplied sediments in the Three Gorges Reservoir. Further studies are needed to predict the long-term change trends of the Zhongxian reach and assist navigation management decisions in the permanent backwater zone of the Three Gorges Reservoir.
Funding
This research is supported by the China's National Natural Science Foundation (No. 51409027), and the National Basic Research 973 Program of China (Grant No: 2012CB417002).
References
- Aleem AA. 1972. Effect of river outflow management on marine life. Mar Biol. 5:200–208.
- Batalla RJ, Gomez CM, Kondolf GM. 2004. Reservoir-induced hydrological changes in the Ebro River basin (NE Spain). J Hydrol. 290:117–136.
- Bosboom J, Aarninkhof SG, Reniers JM, Roelvink JA, Walstra DJ. 1997. UNIBEST TC-2.0 model: overview of formulations. The Netherlands: Delft Hydraulics, Report H2305-42.
- Bulletin of Yangtze River Sediment. 2013. Press of Ministry of Water Resources of the People's Republic of China. Available from: http://www.cjh.com.cn/
- Chen Z, Li J, Shen H, Wang Z. 2001. The Yangtze River of china: historical analysis of discharge variability and sediment flux. Geomorphology. 41:77–91.
- Dai Z, Liu JT. 2013. Impacts of large dams on downstream fluvial sedimentation: an example of the Three Gorges Dam (TGD) on the Changjiang (Yangtze River). J Hydrol. 480:10–18.
- Dai SB, Lu XX. 2014. Sediment load change in the Yangtze River (Changjiang): a review. Geomorphology. 215:60–73.
- Dong N, Fang C, Cao W. 2010. Non-equilibrium sediment transport in the Three Gorges Reservoir. J Hydraul Eng. 41:653–658.
- Dou G. 1960. Study on the incipient velocity of fine sediment. J Hydraul Eng. 4:44–60. Chinese.
- Dou G. 1999. Incipient motion of coarse and fine sediment. J Sediment Res. 6:4–11. Chinese.
- Draut AE, Logan JB, Mastin MC. 2011. Channel evolution on the dammed Elwha River, Washington, USA. Geomorphology. 56:325–334.
- Falconer RA. 1986. Water quality simulation study of a natural harbor. J Waterw Port C-ASCE. 112:15–34.
- Fang CM, Li YZ, Niu LH. 2006. Numerical simulation of sedimentation deposition in access channel of temporal shiplock in Three Gorges Project. J Hydraul Eng. 3:320–324.
- Graf WL. 2006. Downstream hydrologic and geomorphic effects of large dams on American rivers. Geomorphology. 79:336–360.
- Hu J, Yang S, Wang X. 2013. Sedimentation in Yangtze River above Three Gorges Project since 2003. J Sediment Res. 1:39–44. Chinese.
- [IRTCES] International Research and Training Center on Erosion and Sedimentation. 2012. River Sediment Bulletin of China 2012. Beijing. Chinese.
- Jia D, Shao X, Zhang X. 2013. Sedimentation patterns of fine-grained particles in the dam area of the Three Gorges Project: 3D numerical simulation. J Hydraul Eng. 139:669–674.
- Jia Y, Wang SS. 1999. Numerical model for channel flow and morphological change studies. J Hydraul Eng. 125:924–933.
- Kiss T, Fiala K, Gy S. 2008. Alterations of channel parameters in response to river regulation works since 1840 on the lower Tisza River (Hungary). Geomorphology. 98:96–110.
- Knighton D. 1984. Fluvial forms and processes. New York: John Wiley and Sons.
- Kummu M, Lu XX, Wang JJ, Varis O. 2010. Basin-wide sediment trapping efficiency of emerging reservoirs along the Mekong. Geomorphology. 119:181–187.
- Li WJ. 2013. Suspended particle settling velocities in the Three Gorges Reservoir. Proceedings of 2013 IAHR Congress, Chengdu, China.
- Li Y, Sun Z, Liu Y, Deng J. 2009. Channel degradation downstream from the Three Gorges project and its impacts on flood level. J Hydraul Eng. 135:718–728.
- Li WJ, Wang J, Yang SF, Zhang P. 2015. Determining the existence of the fine sediment flocculation in the Three Gorges Reservoir. J Hydraul Eng. 141:10–16.
- Lien HC, Hsieh YTY, Yeh KC. 1999. Bend-flow simulation using 2D depth-averaged model. J Hydraul Eng. 125:1097–1108.
- Lin B, Zhang R, Dai D, Tan Y. 2004. Sediment research for the Three Gorges Project on the Yangtze River since 1993. Proceedings of the Ninth International Symposium on River Sedimentation, Yichang, China.
- Lu XX, Higgitt DL. 2001. Sediment delivery to the Three Gorges 2: local response. Geomorphology. 41:157–169.
- Lu X, Jiang T. 2009. Larger Asian rivers: climate change, river flow and sediment flux. Quatern Int. 208:1–3.
- Lu Y, Zuo L, Ji R, Liu H. 2010. Deposition and erosion in the fluctuating backwater reach of the Three Gorges Project after upstream reservoir adjustment. Int J Sediment Res. 25:64–80.
- Mosselman E. 1998. Morphological modeling of rivers with erodible banks. Hydrol Process. 12:1357–1370.
- Nilsson C, Reidy CA, Dynesius M, Revenga C. 2005. Fragmentation and flow regulation of the world's large river systems. Science. 308:405–408.
- Spasojevic M, Holly FM. 1990. MOBED2 : Numerical simulation of two- dimensional mobile-bed processes. Iowa City (IA): Iowa Institute of Hydraulic Research, Technical Report No. 344.
- Struiksma N, Olsen KW, Flokstra C, De Vriend HJ. 1985. Bed deformation in curved alluvial channels. J Hydraul Res. 23:57–79.
- Sun ZD, Huang Q, Opp C, Henning T, Marold U. 2012. Impacts and implications of major changes caused by the Three Gorges Dam in the middle reaches of the Yangtze River, China. Water Resour Manage. 26:3367–3378.
- Tang C. 1964. Study on the principle of Threshold Motion of fine sediment. J Hydraul Eng. 2:11–16. Chinese.
- Vignaga E, Sloan DM, Luo X, Haynes H, Phoenix VR, Sloan WT. 2013. Erosion of biofilm-bound fluvial sediments. Nat Geosci. 6:770–774.
- Wolf A, Bergmann A, Wilken RD, Gao X. 2013. Occurrence and distribution of organic trace substances in waters from the Three Gorges Reservoir, China. Environ Sci Pollut Res. 20:7124–7139.
- Xiong M, Xu QX, Yuan J. 2009. Analysis of multi-factors affecting sediment load in the Three Gorges Reservoir. Quatern Int. 208:76–84.
- Xiao Y, Shao XJ, Wang H, Zhou H. 2012. Formation process of meandering channel by a 2D numerical simulation. Int J Sediment Res. 3:306–322.
- Xu K, Milliman J. 2009. Seasonal variations of sediment discharge from the Yangtze River before and after impoundment of the Three Gorges Dam. Geomorphology. 104:276–283.
- Yan Q, Yu Y, Feng W. 2008. Plankton community composition in the Three Gorges Reservoir Region revealed by PCR-DGGE and its relationships with environmental factors. J Environ Sci. 20:732–738.
- Yang T, Li Q, Wan Z. 2001. Incipient motion of the fine sediments under the high water depth. The conference for the sediment problem in 21st century, Chengdu, China. Chinese.
- Yang ZJ, Liu DF, Ji DB, Xiao SB. 2010. Influence of the impounding process of the Three Gorges Reservoir up to water level 172.5 m on water eutrophication in the Xiangxi Bay. Sci China Technol Sci. 53:1114–1125.
- Yang SL, Milliman JD, Li P, Xu K. 2011. 50,000 dams later: erosion of the Yangtze River and its delta. Global Planet Change. 75:14–20.
- Zhang R. 1989. Dynamics of the River Sediment. Beijing: China Water Power Press. Chinese.
- Zhang J, Liu Z, Sun X. 2009. Changing landscape in the Three Gorges Reservoir Area of Yangtze River from 1977 to 2005: land use/land cover, vegetation cover changes estimated using multi-source satellite data. Int J Appl Earth Obs. 11:403–412.
- Zhou G, Wang H, Shao X, Jia D. 2009. Numerical mode for sediment transport and bed degradation in the Yangtze river channel downstream of Three Gorges Reservoir. J Hydraul Eng. 135:729–739.