
Abstract
This study explored the effect of seasonally varying inflow hydrology and circulation on total mercury (Hg) and methylmercury (MeHg) in the water column of a warm, temperate reservoir. The study site in Grand Lake, Oklahoma, is >80 km long and usually 36 m deep at its dam. During this study, aside from 2 large, storm-driven springtime events, drought caused low inflows. During maximal summer stratification, the surface mixed layer was 8–11 m thick, water below was anoxic, and inflows entered as an interflow. Total Hg in filtered samples was <4 ng/L with an interquartile range of 0.27–0.96 ng/L. Highest concentrations occurred in spring and summer, and lowest concentrations followed overturn. In filtered samples, MeHg was ≤0.62 ng/L with an interquartile range of 0.01–0.08 ng/L. Highest concentrations of MeHg occurred in some large inflows and in anoxic summertime bottom water in specific locations where total suspended sediment was also elevated. During this study, Hg concentrations in Grand Lake were driven by inflow hydrology when inflows were high. During low inflows, biogeochemistry controlled the enrichment of MeHg in specific locations of the anoxic bottom water and sequestered both Hg species in autumn. This sequestration suggests that Grand Lake decreases watershed-derived Hg pollution downstream. Occurrence of elevated Hg and MeHg concentrations primarily in large inflows and anoxic bottom water suggests that exposure of biota to Hg species is greatest when floods enter the reservoir because Hg enrichment in deep, anoxic water does not coincide with the habitat of most fauna.
Mercury (Hg) contamination is widespread in terrestrial and aquatic ecosystems due to atmospheric deposition (Morel et al. Citation1998). The methylation of inorganic, oxidized, dissolved mercury, Hg(II)(aq), promotes bioaccumulation of this potent neurotoxin (e.g., Mason et al. Citation1995) and subsequent contamination of food supplies (e.g., Chevalier et al. Citation1997). Consequently, accumulation of aqueous methylmercury, MeHg(aq), in pelagic waters and biota has been studied thoroughly. In lakes without point-source inputs of Hg(II), methylation in anoxic sediment and subsequent diffusion to the water column can enhance water-column MeHg(aq) concentrations (Sellers et al. Citation2001). Inundation of shoreline regions in lakes (Selch et al. Citation2007) and reservoirs (Patterson et al. 1998, Sorensen et al. Citation2005, Mast and Krabbenhoft Citation2010) also promotes methylation due to comparatively low oxygen conditions in flooded shoreline soils. Additionally, methylation has been observed in anoxic hypolimnia of stratified lakes (Watras et al. Citation1995, 2005, Eckley and Hintelman Citation2006).
These previous studies occurred in waterbodies where biogeochemical processes, not horizontal advection, influence anoxia or Hg transport. However, moderately sized or large reservoirs tend to be constructed on sizeable rivers that can influence advection in these reservoirs through variable inflow hydrology and resulting effects on circulation. For example, rivers draining extensively cultivated land exhibit rapid departures from and returns to base flow when storms occur and thus will alter residence time (RT) of water in their reservoirs significantly over a year, especially if they are minimally regulated (Kalff Citation2002). Rivers also supply reservoirs with sediment loads that vary in volume and depositional location as flow rate varies (Thornton Citation1990). Moreover, inflows from major tributaries in sizeable reservoirs often plunge to depths that vary seasonally depending on inflow density, limnetic density profiles, and stratification (Johnson and Merritt Citation1979). In temperate latitudes, rivers with temperatures not influenced by snow can create overflow and underflow currents in spring and autumn, respectively (Johnson and Merritt Citation1979). Such longitudinal circulation affects RT at specific depths and can combine with vertical circulation to drive dissolved oxygen (DO) dynamics (LaBounty and Burns Citation2007, Marcé et al. Citation2008) or nutrient transport (Matzinger et al. Citation2007, Baldwin et al. Citation2008). Although variations in RT and DO can affect Hg chemistry (e.g., Eckley and Hintelman Citation2006), previous work has not studied whether reservoirs with notable inflow hydrology or circulation patterns show the same Hg transformation and transport as do natural lakes affected mainly by vertical circulation.
This research examined the seasonal variation of water-column Hg and MeHg concentrations across Grand Lake, Oklahoma. In addition to characterizing the spatiotemporal variation of these chemicals, this study sought to explore the influences of 2 independent variables: river inflows, which could be expected to increase in winter and spring following storms and decrease to base flow in summer and autumn; and reservoir circulation, which was expected to typify that of a warm temperate lake while also including a spring and summer overflow current from large tributaries. This study assessed 2 main hypotheses. First, summertime isolation of bottom water from the atmosphere due to low flows, stratification, and overflow currents leads to the highest yearly concentrations of Hg and MeHg because these hydrologic and limnologic conditions favor anoxia in bottom waters and because anoxia promotes enrichment of Hg species and conversion of water-column Hg to MeHg. Second, elevated inflows and vertically mixed conditions during winter and spring lead to decreased concentrations of Hg species because of decreased RT and flushing of accumulated Hg species out of the reservoir.
This study focused on Grand Lake because this moderate-sized, eutrophic reservoir receives nutrient pollution that makes summertime hypolimnetic anoxia probable (OWRB Citation2007). Furthermore, non-negligible Hg concentrations could be expected because 4 coal-fired power plants, which are known to emit Hg, are located ≤100 km away (US EIA 2013, US EPA 2013), and a substantial fraction of local atmospheric emissions are deposited near point sources due to the short atmospheric residence time of Hg(II)(g) (Selin Citation2009). Finally, this reservoir is a major recreational fishery where fish consumption by local anglers accounts for the majority of their dietary Hg exposure (Dong et al. Citation2015), so understanding Hg dynamics in Grand Lake aids understanding risks of human exposure.
Study area
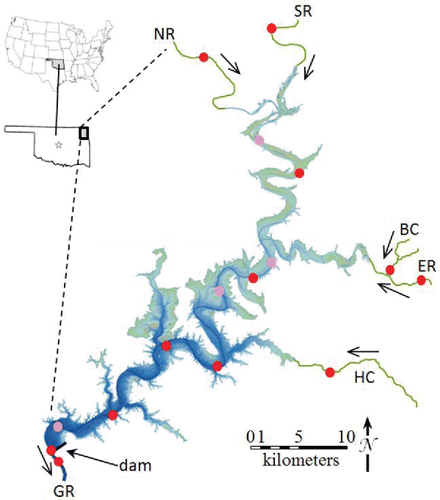
Grand Lake is formed by Pensacola Dam (). It is fed primarily by the Neosho River and the Spring River in northeast Oklahoma, which enter from the northwest and north, respectively, and the Elk River, which enters from the east ∼25 km downstream of the confluence of the Neosho River and the Spring River. Together, these and the minor tributaries of the reservoir drain a 26,700 km2 watershed (US ACE 2015a). Before it was submerged, the confluence of the Neosho River and the Spring River formed the Grand River, which is now considered to originate from the dam. Grand Lake is >80 km long, usually 36 m deep at the dam (depth at the dam ranges from 35 m during management drawdowns to 39 m during floods) and 12 m deep where the Elk River arm meets the thalweg. Water level varies <1 m throughout the year except when the reservoir detains floodwater, which induces increased releases via dam spillways during and following flood events until the water level is back to pre-flood levels. Except when detaining floodwater, the volume of the reservoir is 1900–2000 gigaliters (GL). Upstream, only the Neosho River is regulated. On this river, the flood control pool of John Redmond Lake in Kansas stores up to 9% of the annual flow of the Grand River by regulating flow in 29% of the Grand Lake watershed (US ACE 2015b). This minimal regulation of Grand Lake tributaries leads to large variations in inflows to Grand Lake. Penstocks of the dam, which are used for all releases except during floods, are 4 m tall screened openings centered 16 m below the water surface and located at the southwestern end of the dam.
Methods
Water measurements and sample collection
Volumetric flow data for the Grand River and 5 gauged tributaries of Grand Lake, the Neosho River, the Spring River, the Elk River, Honey Creek, and Buffalo Creek, were retrieved from the US Geological Survey (Citation2013) for 1 December 2000 until 30 November 2011. Water levels of Grand Lake were downloaded from the US ACE (2015a) for 1 December 2010 until 30 November 2011.
Vertical profiles of temperature (T), specific conductance (SC), and DO were measured with a Hydrolab MS5 multiparameter sonde (Hach, Loveland, CO) at 1 m depth intervals during sampling excursions on 8–11 December in 2010 and 25 February–3 March, 4–11 May, 11–19 August, and 16–17 November in 2011. Single-cast profiles were collected at 13 locations in the thalweg of Grand Lake, the Neosho River, the Spring River, and the Grand River <500 m below the dam (, Supplementary Table S1). During each excursion, T and SC were measured at the Elk River, Buffalo Creek, and Honey Creek (); these shallow, turbulently flowing creeks were assumed to be oxic at all times. Total suspended sediment (TSS) was measured in water samples during excursions from February to November. Water samples for TSS and other analytes (discussed later) were collected at 4–5 thalweg locations and each inflow/outflow location during each excursion. At each location, samples were collected at 1–4 depths that always included the surface mixed layer (SML) and, if ≥2 samples were collected, a deep sample <1 m from the sediment–water interface (SWI). Samples were pumped through silicone tubing and collected in Teflon bottles cleaned with 5% trace-metal grade hydrochloric acid in a class-100 clean bench and stored with dilute acid solution until the start of the sampling excursion. Bottles were always kept in 2 resealable plastic bags in a dark cooler; they were handled using clean-hands-dirty-hands techniques. Water samples were filtered either within 24 h in a class-100 clean bench (Dec–May) or immediately inline (Aug–Nov) through acid-washed 0.45 μm polyethersulfone membranes. They were then acidified with trace-metal-grade hydrochloric acid within 24 h. Field blanks and occasional field duplicates verified the low background concentrations of analytes and reproducibility of field protocols.
Sample analysis
Two analytical methods of Hg species were used. First, for samples collected in December 2010, samples were analyzed by the author for total mercury and monomethylmercury in filtered water (HgTf and MeHgf, respectively) by methods described elsewhere (Balcom et al. Citation2008, Hammerschmidt and Fitzgerald Citation2010). Sample collection did not permit measurement of particulate Hg species. For HgTf, water samples were digested with bromine monochloride and reduced with stannous chloride before quantification by gold-amalgamation cold-vapor atomic fluorescence spectroscopy (CVAFS). The detection limit for this method was 20 pg HgT/L (calculated as 3 times the standard deviation of matrix spike replicates; Balcom et al. Citation2008), and the expanded analytical uncertainty was 20 pg HgT/L (calculated by multiplying the standard deviation of matrix spike replicates by 3.2, after Ellison and Williams Citation2012). MeHgf samples were measured using a similar purge-and-trap method after direct ethylation with sodium tetraethylborate (Hammerschmidt and Fitzgerald Citation2010). This method detection limit was 20 pg MeHg/L and the expanded analytical uncertainty was 20 pg MeHg/L. In both of these analyses, method blanks and matrix spikes (of Hg2+ and MeHg, respectively) assured analytical quality. Matrix spikes involved adding a solution diluted from a certified stock solution to both distilled water and previously digested, reduced, and purged Grand Lake water. In each case, analyses of samples did not occur until method blanks were repeatedly below detection limits and matrix spikes returned concentrations within 5% of stated concentrations. Measurements were calibrated with a calibration curve created with Hg0(g) that had volatilized from ACS-grade Hg(l) in a closed vessel.
The second analytical method, used for samples from 2011, involved sending samples away to The Trace Element Analysis Laboratory of the Dartmouth College Toxic Metals Superfund Research Program. There, samples were analyzed for Hg(II)f and MeHgf by a purge-and-trap procedure and inductively coupled plasma mass spectrometry (ICP-MS) following Taylor et al. (Citation2011). The reported detection limit for this method was 3 pg/L, which is also taken as the expanded analytical uncertainty. This method used an internal standard that ensured matrix effects did not bias reported concentrations. Although this method is optimized for MeHgf, its usefulness for Hg(II)f was verified by demonstrating a linear relationship between the sum of MeHgf and Hg(II)f measured by ICP-MS and HgTf measured by CVAFS in 56 samples collected across 3 sampling excursions. Thus, for samples collected in 2011, HgTf is reported here as the sum of the 2 ICP-MS measurements because the internal standard used in this method increased reliability of these data.
Data summarization and analysis
Elemental fluxes were calculated for each sampling excursion by multiplying the average flow of days when sampling occurred by the concentrations of HgTf and MeHgf measured in samples collected from tributaries and the Grand River below the dam. When concentrations were below detection limit (BDL), half the detection limit was used for the summation of tributary inputs that enabled this calculation. The analytical uncertainties for the Hg species measurements were carried through this calculation to determine an uncertainty for calculated fluxes. These uncertainties varied due to varying river flow rates.
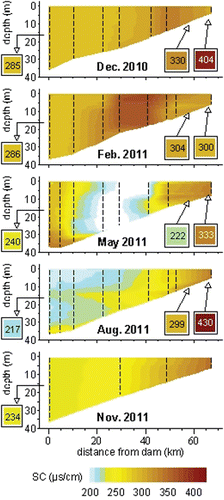
Contour plots for circulation parameters (i.e., T and SC) and trace-metal analytes were created from measurements at discrete depths and distances from the dam using Tecplot 360, which interpolates using a triangulation algorithm (Tecplot, Inc., Bellevue, WA). For Hg species, it was necessary to interpolate vertically using linear modeling based on circulation parameters before allowing Tecplot to interpolate longitudinally between sampling locations. Vertical interpolation was not necessary for T, SC, or DO because these were measured at regular depth intervals (usually 1 m). Creation of contour plots used all available data.
Differences in concentrations of Hg species between different groups of samples (e.g., those from separate sampling excursions, which occur during different inflow rates, those at different depths, those from different parts of the reservoir, or those with different DO concentrations) were evaluated through a series of ANOVA analyses and Student's t-tests. Linear regression was used to assess the suitability of TSS as a predictor variable for concentrations of Hg species and the suitability of HgTf as a predictor for MeHgf. The ratio of MeHgf to HgTf, which has been used to examine methylation activities in other studies (e.g., Suchanek et al. Citation2008a), was calculated, expressed as a percentage, and analyzed by ANOVA to determine its relationship to sampling excursion and depth.
Results
Temperature, specific conductance, and dissolved oxygen
In December 2010, the reservoir was vertically mixed, oxygenated, and warmer near the dam (SC in ; T ranged longitudinally from 5–12 C, Supplementary Fig. S1; DO >8 mg/L, Supplementary Fig. S2). During the February–March excursion, longitudinal variation in SC (), which is generally decreased in floodwater (Pellerin et al. Citation2007, Schemel and Cox Citation2007), indicated that floodwater (described later) reached to a point 45 km upstream of the dam (stream locations henceforth referred to as “km-x”) during that sampling excursion. The water column was well-mixed and oxygenated (Supplementary Fig. S1 and S2).
Table 1 Average daily inflow and outflow statistics (in m3/s) during this study.
Stratification was observed in May; near the dam, T decreased <1 C from a surface water T of 15.4 C in a surface mixed layer that extended to 28 m, and then it decreased rapidly and nearly linearly to a minimum of 11.6 C at the sediment surface (37 m depth; Supplementary Fig. S1). Near the dam, DO was 3–6 mg/L below 30 m depth and near saturation otherwise (Supplementary Fig. S2). The combination of stratification, shallow currents through the reservoir, and releases via spillways and the 14–18 m-deep penstock openings implied that large, springtime, storm-induced inflows (described later) did not interact with deep water, which would remain in place from the onset of stratification in mid-spring until autumn overturn in late October (described later). Low SC values between km-15 and km-35 in May indicate the position of floodwater during that sampling excursion ().
Summertime inflows entered as an overflow current until ∼1 July (S. Ziara, Grand River Dam Authority, unpubl. data) and then as an interflow current at 13–15 m depth (), which likely isolated both bottom waters and the SML from longitudinal flow. During summer, consistent and intense surface heating led to stratification and an SML 8–11 m thick (Supplementary Fig. S1). Water below the SML was anoxic (Supplementary Fig. S2), including the interflow current, which became anoxic almost immediately after it plunged beneath the SML in the upper region of the reservoir. Autumn overturn led to complete vertical mixing and oxygenation by mid-November (; Supplementary Fig. S1 and S2).
Reservoir hydrology
From December 2010 to November 2011, the Neosho River, the Spring River, and the Elk River contributed 75% of the water that was released from the dam (). Other gauged tributaries were <5% each, and a qualitative assessment indicated that all ungauged tributaries are comparable to or smaller than Honey Creek, which is gauged and contributed ∼1% of dam releases during this study (data not shown). This study occurred during low-flow conditions relative to the preceding 9 years, which were each evaluated from 1 December to 30 November to match the study period. Median flows during the study period were 35 m3/s, and the interquartile range (IQR) was 18–135 m3/s. The range of medians in the preceding 9 years was 10–250 m3/s (mean = 118 m3/s); the median flow of the study period was the third-lowest median flow of this 10-year period, equivalent to the 31st percentile of the preceding 9 years, and the IQR of the study period was equivalent to the range defined by the 17th and 61st percentiles of the preceding 9 years. Although large storm-driven flows did occur, total inflows were lower than in the previous 9 years and, consequently, so were dam releases. Drinking water withdrawals from Grand Lake are small, and no information is available regarding groundwater exchange.
At the beginning of this study, inflows to Grand Lake during winter were <30 m3/s and thus below the average base inflow of the previous 9 years. Between the December and February–March sampling excursions, 260 GL entered the reservoir. These low inflows were interrupted by higher flows brought by small storms between mid-February and mid-April (most total inflows ranged from 85 to 490 m3/s), the first of which coincided with the sampling excursion at that time and brought 290 GL to Grand Lake (). The volume of water brought to the reservoir by low winter inflows and the late-February storm was 29% of the volume of water in the reservoir during the December sampling excursion. The series of small storms that began in late February increased flows and brought a volume of water equal to 60% of the volume of the reservoir between the onset of these storms and the first large storm of the spring, which occurred in April. Circulation between the thalweg of the reservoir and its coves has not been described, but, if incomplete, then >29% and >60% of the thalweg water would have been replaced during early winter and late winter, respectively.
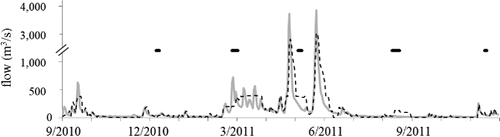
This April storm and another in late May (between which the May excursion occurred) raised total daily average inflows to >550 m3/s for 5 and 7 days, respectively, with 1-day peaks >3700 m3/s. These storms each brought 1300 GL to the reservoir via its gauged tributaries. These large inflows entered a stratified reservoir, and the volumes of water brought by the 2 large spring storms were each 76% of the volume of Grand Lake at or above the depth of the penstocks. Dam releases tracked inflows closely, remaining elevated in late winter and spring (i.e., Feb–May) and peaking to release the large inflows in April and May, although elevated dam releases persisted for multiple weeks to discharge flood water.
Following these storms, inflows and dam releases in summer and autumn 2011 (i.e., late May through the end of the study in Nov) were generally <30 m3/s during an unusually hot and dry summer. Only 210 GL entered Grand Lake between the late May storm and the August sampling excursion, implying a ∼10% replacement of water during the summer. Dam releases were elevated above inflows in late summer to decrease water level by 1 m to meet management objectives. Inflows were 200 GL between the August and November excursions, <11% of the reservoir volume.
Suspended sediment
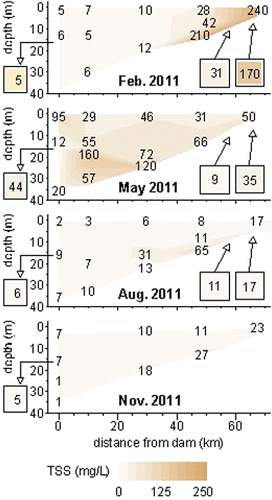
The IQR of the recorded TSS concentrations was 7–34 mg/L. Concentrations were highest near the main inflow in February (240 mg/L) and 20–30 m at ∼km-15 in May (160 mg/L; ), values probably driven by river inflow events. When flows were low in August and November, TSS was highest in the bottom water at km-48.5 (65 mg/L and 27 mg/L, respectively, as compared to an IQR of 5–18 mg/L across the entire reservoir during these excursions), suggesting that this region, in which depth first exceeds 14 m, is the main area of sedimentation at base flow. In addition to sedimentation at km-48.5, large inflows (i.e., from major storms like those in Apr and May) frequently carry suspended sediment to the face of the dam, where sedimentation occurs when these currents are arrested (S. Hembree, Grand River Dam Authority, pers. comm.). Thus, episodic sedimentation probably also occurred near the dam during the study period, although no such events were captured by the sampling of this study.
Concentrations and fluxes of mercury species
In Grand Lake and its major tributaries, the maximum concentration of HgTf ([HgTf]) was 3.93 ng/L, 78 of 81 observations were <2 ng/L, and the IQR was 0.29–1.04 ng/L. Below the dam, concentrations ranged from 0.09 to 1.73 ng/L. In Grand Lake, maximum concentration of MeHgf [MeHgf] was ≤0.62 ng/L, and the IQR was 0.01–0.08 ng/L.
Flux of Hg species (i.e., export via the Grand River subtracted from loadings via gauged tributaries) varied seasonally (). As storm water arrived at the reservoir in February–March, fluxes were 64,000 mg/d of HgTf and 10,000 mg/d of MeHgf. In May, sustained high outflows that passed floodwater downstream were accompanied by export of 21,000 mg/d of HgTf and 960 mg/d of MeHgf. In August, calculation of flux of Hg species was not possible due to dam operations (see Discussion). When flows were low in December and November, fluxes of Hg species were 1–2 orders of magnitude lower than in February–March and May.
Table 2 Fluxa of water (megaliters/day) and Hg species (mg/d) during sampling excursions.
Spatiotemporal variation of Hg species
In December, [HgTf] ranged from 0.28 to 0.85 ng/L with deep-water samples higher than surface-water samples (t-test, P < 0.05) and bottom-water maxima at km-0.2 and km-48.5 (). No meaningful spatial trends existed for [MeHgf], which was mostly BDL and otherwise ≤0.06 ng/L ().
![Figure 5 Contour plots of total mercury [HgT] in filtered water samples (in ng/L) collected in Grand Lake during this study. Other details are as in Figure 4.](/cms/asset/9856b1fb-de2c-493c-9083-927fa5768d4d/ulrm_a_1133740_f0005_oc.gif)
![Figure 6 Contour plots of methylmercury [MeHg] in filtered water samples (in ng/L) collected in Grand Lake during this study. BDL = below detection limit. Other details are as in Figure 4.](/cms/asset/c5b8df00-2792-4766-a648-201bb3f23a24/ulrm_a_1133740_f0006_oc.gif)
When inflows increased, concentrations of both Hg species also increased. In February–March, the inflow from the Neosho River and the Spring River contained 1.14 ng/L of HgTf and 0.18 ng/L of MeHgf; these concentrations were 1.39 ng/L and 0.29 ng/L, respectively, at km-67.5, 1.3 and 3.2 times the maximum [HgTf] and [MeHgf] observed in December, respectively. Near the dam, concentrations were not significantly different from those in December (t-test, P > 0.1). For both species, bottom-water concentrations significantly exceeded those of surface waters at each location across the reservoir ( and ; t-test, P < 0.05). In May, minimal [HgTf] was measured in old, deep water near the dam and in the inflow region and was significantly lower than in the rest of the reservoir (t-test, P < 0.05). Between km-0 and km-35 in May, [HgTf] had a maximum >1.5 ng/L that coincided with the TSS maximum (). Unlike [HgTf], [MeHgf] showed little spatial variation in May, ranging from 0.06 to 0.12 ng/L, with a maximum at the km-10 TSS maximum ().
In August, [HgTf] in the inflow region was highest in Grand Lake at 1.80 ng/L (). Fed by HgTf-rich water from the Neosho–Spring tributary, which reached 1.91 ng/L in the Neosho River, 2.05 ng/L in the Spring River, and 3.93 ng/L at the bottom of the riverine zone at km-75 (Table S2), the interflow current appeared as a tongue of high-HgTf and low-MeHgf water extending to km-35. This inflow water was significantly higher in HgTf (t-test, P < 0.01) and insignificantly lower in MeHgf (t-test, P > 0.1) than the rest of the reservoir. Maximal [MeHgf] was observed in bottom waters at km-0.2 (0.62 ng/L) and km-48.5 (0.32 ng/L), values 4.6 and 2.3 times higher than the maximum [MeHgf] in the rest of the reservoir. Deep water between these sites and other depths in the water column ranged in [MeHgf] from BDL to 0.1 ng/L (). Below the dam in August, [HgTf] and [MeHgf] were 1.73 and 0.55 ng/L, respectively, notably higher than at 16 m deep at km-0.2 (i.e., immediately in front of the penstocks that release water downstream; values there were 0.93 ng/L and BDL, respectively).
In November, [HgTf] and [MeHgf] were low and minimally variant across Grand Lake. Maximum [HgTf] was 0.40 ng/L near the dam; values of [MeHgf] were ≤0.03 ng/L with insignificant spatial variation ( and ). Along with the preceding December, the samples collected in November contained the lowest [HgTf] and [MeHgf] in this study.
Significant differences were observed in both [HgTf] (ANOVA, P < 0.0001) and [MeHgf] (ANOVA, P < 0.005) when comparing all locations in the reservoir across sampling excursions. These analyses indicated that [HgTf] measured in August was significantly higher than that measured in all other sampling excursions. Across Grand Lake, [HgTf] was similar in February–March and May, and, due to the significant longitudinal variation in these months (see earlier), it was not statistically distinguishable from December. May and December [HgTf] were significantly higher than those of November (t-test, P < 0.005). Concentrations of MeHgf in samples collected across the reservoir in February–March, May, and August were significantly higher than the similar sets from December and November (t-test, P < 0.05) and statistically indistinguishable from each other. No significant differences occurred in either [HgTf] or [MeHgf] (ANOVA, P > 0.1) when samples were grouped according to depth, inflows, and outflows.
Samples from water with DO concentration <4 mg/L were significantly higher in [HgTf] (t-test, P < 0.0005) but not [MeHgf] (t-test, P > 0.1), consistent with observation of elevated [MeHgf] in only some anoxic bottom water samples collected from the August excursion. Concentration of TSS in water samples explained only 11% of the variance of either [HgTf] or [MeHgf] (i.e., the R2 value from linear regression was 0.11). In December and February–March, [HgTf] explained >40% of the variance in [MeHgf], and in May, [HgTf] explained >55% of the varience in [MeHgf], but no predictive relationship existed between these variables in August and November.
The IQR of the percentage of HgTf that was MeHgf (“%MeHgf”) was 4–16%; of all samples, 13 had a %MeHgf >20%. Most of these high-%MeHgf samples occurred in the MeHgf-rich inflows of February–March; the others occurred in bottom water at km-0.2 and km-48.5 in August. In February–March, %MeHgf was significantly higher than in all other months, and in December, %MeHgf was significantly lower than in all other months (ANOVA, P < 0.01). There were no significant differences when samples were sorted based on depth in the water column or inflows and outflows (ANOVA, P > 0.5).
Discussion
Hydrology and circulation
Grand Lake exhibited the vertical circulation of a eutrophic, warm, temperate lake. This led to abundant DO between autumn overturn and the onset of stratification in spring. Overlaid on this pattern were seasonally varying river inflows. Notably, the large water exchanges that occurred following the large storms in April and May imply that, aside from deep water near the dam, thalweg water was completely replaced both between the February–March and May sampling excursions and again between the May and August sampling excursions. Because these large inflows entered a stratified water column, however, circulation data indicate that deep water near the dam remained in place from winter through the spring and summer until autumn overturn because it had been trapped at depth by stratification and thus was unaffected by spring inflows. The small inflows between the August and November sampling excursions imply that these excursions largely measured the same water.
Circulation data from this study show that a mid-continent reservoir that does not receive an appreciable amount of its inflows from snowmelt can undergo large variation in RT throughout the year based on varying river inflow rates. This finding implies that if a water quality impairment occurs during drought, dilution, dispersion by water currents, or passage downstream are unlikely to help lake managers resolve the issue. Although dispersion by wind may be possible, this research was beyond the scope of this study. Due to a high flushing rate during times of high inflows, this hydrological picture also suggests that the effects of in-lake water quality impairments or in-lake water-quality management activities may be short-lived during a stormy season. Additionally, the rapid consumption of DO in the river inflow augments existing evidence of habitat limitation for fish during summer stratification.
Mercury and methylmercury
In autumn in Grand Lake, concentrations of Hgf species were low overall and spatial variation was minimal in a vertically mixed and calm reservoir, presenting a convenient starting point for conceptualizing seasonal Hgf variation. Large river inflows during late winter and spring were a major influence on raising concentrations of Hg species and %MeHg in filtered samples across the reservoir. In summer, enrichment of MeHgf and increase of %MeHgf within 1 m of the SWI at km-0.2 and km-48.5 between May (0.07 and 0.06 ng/L, respectively) and August (0.62 and 0.32 ng/L, respectively) led to the highest [MeHgf] in this study. Not only was MeHgf flux into or out of Grand Lake negligible during August, but deep water was also isolated during spring and summer by overflow and interflow currents. Thus, unlike in spring, this enrichment cannot be due to advection and therefore must be biogeochemical. These data suggest that enrichment of MeHgf can vary spatially at the SWI of a reservoir, representing a departure from previous studies in natural lakes where only single locations were investigated. The locations of elevated [MeHgf] in anoxic August bottom water coincide with the 2 locations of maximum sedimentation in Grand Lake, suggesting that higher levels of [MeHgf] may be due to reservoir circulation and its effect on sedimentation patterns. These observations resemble those in another mid-continent reservoir where MeHg concentrations were elevated in reservoir arms with higher dissolved organic carbon in porewater, creating spatially distinct regions of elevated MeHg that led to similar spatial patterns in fish (Becker et al. Citation2011). These observations indicate to reservoir managers that the processes leading to MeHg enrichment in reservoirs may be more complex than those that enrich MeHg in simple lakes (e.g., pothole lakes with small inflows) and that notable spatial variability is possible.
After the water column had turned over in autumn, concentrations of both Hgf species were vertically invariant and significantly lower than in summer. The general similarity between low concentrations observed in Grand Lake in November 2011 and December 2010 suggests that this reservoir-wide decrease in dissolved Hgf concentrations may be a yearly event tied to autumn overturn. Mass balance calculations indicate that the masses of HgTf and MeHgf in the entire water column were 77% and 87% lower, respectively, in November than in August. Water exchange between these sampling excursions was much too low to explain these reductions. Transport out the dam can be eliminated as a possible explanation for this loss of Hgf species from the reservoir water column, suggesting that autumn overturn coincides with an in-lake loss mechanism for Hgf species, and that Grand Lake sequesters or loses to the atmosphere a notable fraction of the Hgf that enters it each year. This finding strongly suggests that Grand Lake provides some protection from watershed-derived Hg contamination of downstream reservoirs (i.e., Lake Hudson, Fort Gibson Lake, and others).
Observations in this study show that, overall throughout the year, elevated river flows brought significant loads of HgTf and MeHgf to Grand Lake. When river flows were lower, biogeochemical processes related to summertime stratification and autumn overturn influenced HgTf and MeHgf. Thus, Hg enrichment and sequestration of Hg species in this reservoir was subject to both allochthonous and autochthonous influences throughout the year. Although all plausible hydrologic scenarios were not observed and sampling 5 times over 12 months might not cover all yearly changes in Hg species in this reservoir, the major features of this seasonal cycle may well occur yearly in Grand Lake because they depend on predictable independent variables such as spring rainstorms, summer stratification, and autumn overturn.
At Grand Lake, increased river inflows in spring seem to elevate [Hgf] in the upper 30 m of the thalweg (i.e., the water affected by large spring inflows), but other studies attribute increases in concentrations of aqueous Hg species in lakes and reservoirs to increased water level (Sorensen et al. Citation2005, Mast and Krabbenhoft Citation2010). The large storm that preceded by 12 days the May sampling of the middle of Grand Lake led to a peak water level 2.67 m above normal. Thus, elevated concentrations could be due to HgTf mobilized from temporarily inundated shoreline regions, which then and moved to the thalweg as the floodwater was released out the dam. Although shoreline inundation also increases [MeHgf] in water columns (Sorensen et al. Citation2005, Mast and Krabbenhoft Citation2010), no MeHgf enrichment was observed in May, and therefore changing water level is a poor explanation for HgTf enrichment in this study. Possible scenarios exist that involve release of HgTf and release or production of MeHgf along inundated shorelines and subsequent removal of only MeHgf. However, MeHgf production followed by demethylation should result in varying [MeHgf] with depth due to demethylation by sunlight (Hammerschmidt and Fitzgerald Citation2010), and this trend was not observed. Production of MeHgf followed by biotic uptake would require biomass that was not observed in May. Additionally, shoreline-based enrichment HgTf and MeHgf followed by dilution by flows from minor tributaries would affect both Hg species and is thus an implausible explanation for elevated [HgTf] alone. Thus, elevated [HgTf] observed in May most likely originated from the river inflows, not from shoreline inundation.
In August, elevated [HgTf] and [MeHgf] below Pensacola Dam relative to that of water immediately upstream of the penstocks was likely not representative of transport and transformation of Hg species derived from the watershed and Grand Lake. In the 10 days before the August excursion, releases from the dam ranged from 12 to 65 m3/s (median = 30 m3/s), yet in the 19 days preceding that period, flows were significantly lower (t-test, P < 0.0005), ranging from 0 to 18 m3/s (median = 6.8 m3/s). During this 19-day period, minimal dam releases maintained DO between 6.4 and 8.4 mg/L in the river, but, when release volumes occasionally decreased substantially, DO immediately decreased to <4.6 mg/L (Phillips Citation2014). Biogeochemical MeHg production requires anoxia (Gilmour et al. Citation1992, Kerin et al. Citation2006), and therefore a decrease to nonzero DO does not necessarily imply changes in MeHg methylation. However, these manipulations of DO imply that the biogeochemical environment of the Grand River was different than that of the water on the upstream end of the penstocks and that it could have been changing rapidly, perhaps affecting Hg cycling and solubility immediately below the dam. This event might relate to the difference in our measurements above and below the dam in August, and it also precludes use of these Grand River data to calculate a flux for Hg species through the reservoir during this time because the riverine measurement does not allow discrimination between Hg species derived from dam releases and those mobilized from biogeochemical processes in riparian areas near this sampling site.
Many-lake surveys that report Hg species in filtered samples are uncommon. One survey of 23 northern Wisconsin lakes that receive Hg primarily from atmospheric deposition reported a range of 0.23–4.50 ng/L and a median of 0.71 ng/L for dissolved HgT. Dissolved MeHg ranged from 0.012 to 0.83 ng/L with a median of 0.05 ng/L (Watras et al. Citation1995). These ranges are similar to those of Hg species measured in this study, implying that, despite its proximity to potential sources (i.e., power plants), Grand Lake was not enriched in Hgf species relative to remote lakes that receive Hg from atmospheric deposition. Previous work suggests Hgf is a minority fraction of Hg in whole water samples and that spatiotemporal variation of particulate Hg is distinct from that of Hg in filtered samples and governed by processes that control particle transport and settling (Suchanek et al. Citation2008b). Thus, whole-water Hg concentrations are likely higher than those reported here, and trends in that variable may conform to the movement of particles in Grand Lake.
Other work indicates that Hg levels in the tissue of Grand Lake fish are also relatively low (Dong et al. Citation2015). Although a rigorous model of Hg uptake across the lacustrine food web is necessary to conclusively link water column Hg species to fish tissue Hg burden, data from the present study indicate that MeHg enrichment occurs in anoxic deep water, which is likely poor habitat for phytoplankton and fish. This finding implies that the bioaccessibilty of MeHg may be elevated primarily following flood inputs to the reservoir, when Hg species, especially MeHg, are in an oxic portion of the water column.
In addition to food web modeling, future work might focus on a mechanistic explanation of the observed association between sedimentation and elevated concentrations of MeHgf in Grand Lake. Water-column methylation has been observed in bottom waters of other lakes (Watras et al. Citation1995, 2005, Eckley and Hintelman Citation2006). Methylation of Hg(II) requires sulfate (Gilmour et al. Citation1992) or Fe(III) reduction (Kerin et al. Citation2006), but methylation by sulfate reduction is more commonly observed in natural environments (e.g., Pizarro-Barraza et al. Citation2014). Data from the present study indicate that Hg(II) is in sufficient supply to allow Hg methylation, and Grand Lake is known to be high in DOC (an electron donor) and sulfate (OWRB Citation2007). However, nitrate, which is also significantly elevated in Grand Lake (OWRB Citation2007, Citation2009), has been observed to limit methylation activity by preventing sulfate reduction (Todorova et al. Citation2009). Thus, one possible mechanism for elevated [MeHgf] in association with settling particles is that settling sediment provides sufficient reducing power to initiate sulfate reduction and, consequently, Hgf methylation in specific regions of the reservoir. Another possibility is that elevated nitrate prevents sulfate reduction in all parts of the reservoir and MeHgf enrichment results from desorption from settling particles. A third potential mechanism is the production of MeHgf in sediment pore water and subsequent diffusion to overlying water. Obviously, any of these mechanisms are speculative given present understanding of Grand Lake, but one or more could be used by reservoir managers to form the bases of useful hypotheses that focus investment of future research resources.
Acknowledgments
This study was enabled by the generous logistical, laboratory, and personnel support of the Grand River Dam Authority, specifically Darrell Townsend, Sam Ziara, Jacklyn Jaggars, Scott Cox, and Sean Allred. Steve Nikolai (Oklahoma State University) and Lance Phillips (Oklahoma Water Resources Board) shared important ancillary data. Mollie Thurman and Emily Estes (Harvard) and Olenka Forde (Quest University Canada) provided essential sampling support, and Prentiss Balcom, Rob Mason, Roni Ortiz, Kati Gosnell, and Brian DiMento (UConn), Brian Jackson, Arthur Baker, and Vivien Taylor (Dartmouth) provided essential assistance with mercury measurements. Rebecca Jim, Earl Hatley (L.E.A.D. Agency), Laurel Schaider, Elsie Sunderland, Jenny Fisher, Anne Sorenson, and Bess Corbitt (Harvard) provided background information and helpful discussion. Jim Shine (Harvard) provided essential support in all aspects of this project. Associate Editor Thomas James (South Florida Water Management District) and several anonymous reviewers made valuable suggestions to the manuscript.
Funding
This project was funded by a French Environmental Fellowship granted to the author through the Harvard University Center for the Environment and by a gift from the Akatsuka Orchid Company, Ltd.
Supplementary Materials
Supplemental data for this article can be accessed on the publisher's website. Table S1 provides geographical details of each sampling location, and Table S2 provides concentrations of chemical analytes in all samples collected in this study. Figures S1 and S2 provide contour plots of T and DO, respectively, measured seasonally in Grand Lake during this study.
ULRM_A_1133740_Supplement.docx
Download MS Word (262.2 KB)References
- Balcom PH, Hammerschmidt CR, Fitzgerald WF, Lamborg CH, O’Connor JS. 2008. Seasonal distributions and cycling of mercury and methylmercury in the waters of New York/New Jersey Harbor Estuary. Mar Chem. 109:1–17.
- Baldwin DS, Gigney H, Wilson JS, Watson G, Boulding AN. 2008. Drivers of water quality in a large water storage reservoir during a period of extreme drawdown. Water Res. 42:4711–4724.
- Becker JC, Groeger AW, Nowlin WH, Chumchal MM, Hahn D. 2011. Spatial variability in the speciation and bioaccumulation of mercury in an arid subtropical reservoir ecosystem. Environ Toxicol Chem. 30:2300–2311.
- Chevalier G, Dumont C, Langlois C, Penn A. 1997. Mercury in northern Québec: role of the mercury agreement and status of research and monitoring. Water Air Soil Pollut. 97:75–84.
- Dong Z, Jim RC, Hatley EL, Backus ASN, Shine JP, Spengler JD, Schaider LA. 2015. A longitudinal study of mercury exposure associated with consumption of freshwater fish from a reservoir in rural south central USA. Environ Res. 136:155–162. http://dx.doi.org/10.1016/j.envres.2014.09.029.
- Eckley CS, Hintelmann H. 2006. Determination of mercury methylation potentials in the water column of lakes across Canada. Sci Total Environ. 368:111–125.
- Ellison SLR, Williams A., editors. 2012. Eurachem/CITAC guide: quantifying uncertainty in analytical measurements, 3rd ed. ISBN 978-0-948926-30-3. Available from: http://www.eurachem.org
- Gilmour CC, Henry EA, Mitchell R. 1992. Sulfate stimulation of mercury methylation in freshwater sediments. Environ Sci Technol. 26:2281–2287.
- Hammerschmidt CR, Fitzgerald WF. 2010. Iron-mediated photochemical decomposition of methylmercury in an Arctic Alaskan lake. Environ Sci Technol. 44:6138–6143.
- Johnson NM, Merritt DH. 1979. Convective and advective circulation of Lake Powell, Utah-Arizona, during 1972–1975. Wateer Resour Res. 15:873–884.
- Kalff J. 2002. Limnology: inland water ecosystems. Upper Saddle River (NJ): Prentice Hall.
- Kerin EJ, Gilmour CC, Roden E, Suzuki MT, Coates JD, Mason RP. 2006. Mercury methylation by dissimilatory iron-reducing bacteria. Appl Environ Microbiol. 72:7919–7921.
- LaBounty JF, Burns NM. 2007. Long term increases in oxygen depletion in the bottom waters of Boulder Basin, Lake Mead, Nevada-Arizona, USA. Lake Reserv Manage. 23:69–82.
- Marcé R, Moreno-Ostos E, Armengol J. 2008. The role of river inputs on the hypolimnetic chemistry of a productive reservoir: implications for management of anoxic and total phosphorus internal loading. Lake Reserv Manage. 24:87–98.
- Mason RP, Reinfelder JR, Morel FMM. 1995. Bioaccumulation of mercury and methylmercury. Water Air Soil Pollut. 80:915–921.
- Mast MA, Krabbenhoft DP. 2010. Comparison of mercury in water, bottom sediment, and zooplankton in two front range reservoirs in Colorado, 2008-09. US Geological Survey Scientific Investigations Report 2010-5037.
- Matzinger A, Pieters R, Ashley KI, Lawrence GA, Wüest A. 2007. Effects of impoundment on nutrient availability and productivity in lakes. Limnol Oceanogr. 52:2629–2640.
- Morel FMM, Kraepiel AML, Amyot M. 1998. The chemical cycle and bioaccumulation of mercury. Ann Rev Ecol Sys. 29:543–566.
- [OWRB] Oklahoma Water Resources Board. 2007. Segregating water quality degradation of Grand Lake between tributaries and land use features. Available from: http://www.owrb.ok.gov/studies/reports/reports_pdf/GrandLakeTribReport-v1-2a.pdf
- [OWRB] Oklahoma Water Resources Board. 2009. 2008–2009 Oklahoma Lakes Report. Available from: http://www.owrb.ok.gov/quality/monitoring/bump/pdf_bump/Current/Lakes/2009LakesReport.pdf
- Patterson MJ, Rudd JWM, St. Louis VL. 1998. Increases in total and methylmercury in zooplankton following flooding of a peatland reservoir. Environ Sci Technol. 32:3868–3874.
- Pellerin BA, Wollbeim WM, Feng X, Vörösmarty CJ. 2007. The application of electrical conductivity as a tracer for hydrograph separation in urban catchments. Hydrolog Process. doi:10.1002/hyp.6786
- Phillips L. 2014. Adaptive management for low dissolved oxygen in Grand and Hudson lake tailraces. Presentation at 34th International Symposium of the North American Lake Management Society, Tampa, FL.
- Pizarro-Barraza C, Gustin MS, Peacock M, Miller M. 2014. Evidence for sites of methylmercury formation in a flowing water system: Impact of anthropogenic barriers and water management. Sci Total Environ. 478:58–69.
- Schemel LE, Cox MH. 2007. Floodwater chemistry in the Yolo Bypass during winter and spring 1998. US Geological Survey Open-File Report 2007-1025.
- Selch TM, Hoagstrom CW, Weimer EJ, Duehr JP, Chipps S. 2007. Influence of fluctuating water levels on mercury concentrations in adult walleye. Bull Environ Contam Toxicol 79:36–40.
- Selin NE. 2009. Global biogeochemical cycling of mercury: a review. Ann Rev Environ Resour. 34:43–63.
- Sellers P, Kelly CA, Rudd JWM. 2001. Fluxes of methylmercury to the water column of a drainage lake: the relative importance of internal and external sources. Limnol Oceanogr. 46:623–631.
- Sorensen JA, Kallemeyn LW, Sydor M. 2005. Relationship between mercury accumulation in young-of-the-year yellow perch and water-level fluctuations. Environ Sci Technol. 39:9237–9243.
- Suchanek TH, Eagles-Smith CA, Harner EJ. 2008a. Is Clear Lake methylmercury distribution decoupled from bulk mercury loading?. Ecol Appl. 18:A107–A127.
- Suchanek TH, Eagles-Smith CA, Slotton DG, Harner EJ, Adam DP. 2008b. Mercury in abiotic matrices of Clear Lake, California: human health and ecotoxicological implication. Ecol Appl. 18:A128–A157.
- Taylor VF, Carter A, Davies C, Jackson BP. 2011. Trace-level automated mercury speciation analysis. Anal Method. 3:1143–1148.
- Thornton KW. 1990. Perspectives on reservoir limnology. In: Thornton KW, Kimmel BL, Payne FE, editors. Reservoir limnology: ecological perspectives. New York (NY): Wiley.
- Todorova SG, Driscoll CT, Matthews DA, Effler SW, Hines ME, Henry EA. 2009. Evidence for regulation of monomethyl mercury by nitrate in a seasonally stratified, eutrophic lake. Environ Sci Technol. 43:6572–6578.
- [US ACE] US Army Corps of Engineers. 2015a. PENO2: Grand Lake O’ the Cherokees, Pensacola Dam. Available from: http://www.swt-wc.usace.army.mil/pens.lakepage.html
- [US ACE] US Army Corps of Engineers. 2015b. JRLK1: John Redmond Lake. Available from: http://www.swt-wc.usace.army.mil/JOHN.lakepage.html
- US Geological Survey. 2013. USGS current water data for Oklahoma. Available from: http://waterdata.usgs.gov/ok/nwis/rt
- [US EIA] United States Energy Information Administration. 2013. US States – US Energy Information Administration. Available from: http://www.eia.gov/state
- [US EPA] United Stated Environmental Protection Agency. 2013. Basic Information | Mercury | Available from: http://www.epa.gov/hg/about.htm
- Watras CJ, Bloom NS, Claas SA, Morrison KA, Gilmour CC, Craig SR. 1995. Methylmercury production in the anoxic hypolimnion of a dimictic seepage lake. Water Air Soil Pollut. 80:735–745.
- Watras CJ, Morrison KA, Kent A, Price N, Regnell O, Eckley C, Hintelmann H, Hubacher T. 2005. Sources of methylmercury to a wetland-dominated lake in northern Wisconsin. Environ Sci Technol. 39:4747–4758.