
ABSTRACT
James WF. 2017. Diffusive phosphorus fluxes in relation to the sediment phosphorus profile in Big Traverse Bay, Lake of the Woods. Lake Reserv Manage. 33: 360–368.
The role of sediment diffusive phosphorus (P) flux in the P economy and cyanobacteria blooms in Lake of the Woods (LOW) is needed to establish total maximum daily load requirements. I quantified aerobic and anaerobic diffusive P fluxes as a function of temperature to estimate annual internal P loading in Big Traverse Bay of LOW. Replicate cores were collected seasonally and incubated at 5, 11, 18, and 25 C for rate determination. In addition, a sediment core collected in February 2015 was sectioned to analyze sediment P fractions and characterize P burial. Aerobic and anaerobic diffusive P fluxes varied nonlinearly with temperature. Rates were lowest under aerobic conditions, ranging between 0.05 and 0.36 mg/m2/d, and much higher under anaerobic conditions, ranging between 0.77 and 16.78 mg/m2/d, at 5 and 25 C, respectively. The annual diffusive P flux contribution to Big Traverse was 38 and 1172 mg/m2/yr under aerobic and anaerobic conditions, respectively, based on mean monthly bottom temperatures in 2015. The sediment vertical P profile exhibited a distinct surface maximum, suggesting an imbalance between gross deposition and burial. Assuming a constant sedimentation rate, potential annual internal P loading was higher at 246 mg/m2/yr compared to the annual aerobic diffusive P flux, suggesting anaerobic diffusive P flux and other unmeasured internal P loading processes contributed to the P budget. Low P burial efficiency and maintenance of a surface P bulge may be due to cyanobacteria-mediated biological uptake of sediment P, recycling, and redeposition to the sediment surface.
Diffusive phosphorus (P) flux from sediment may play a role in driving cyanobacterial blooms in Lake of the Woods (LOW) and needs to be examined in developing a Total Maximum Daily Load (TMDL) target. Previous research in LOW (James Citation2017) indicated that aerobic diffusive P fluxes from sediment were low to moderate at 0.2–0.6 mg/m2/d while anaerobic diffusive P fluxes were much higher at 8.3–12.5 mg/m2/d at summer temperatures (20 C). However, it is unknown how these diffusive fluxes compare to tributary P loading in the overall P budget of LOW. This research provided insight into important knowledge gaps in the P budget and contributed to empirical modeling efforts of LOW by assessing the variation in aerobic and anaerobic diffusive P fluxes in Big Traverse Bay as a function of temperature.
Big Traverse is the largest bay in the LOW system () with a 1286 km2 area, 9307 × 106 m3 volume, and a relatively shallow mean depth of 7.2 m. The bay is mesotrophic (Carlson TSI-TP = 56, TSI-CHLa = 52, and TSI-SD = 54); summer means are 36 µg/L total P, 8.8 µg/L chlorophyll, and 1.1 m Secchi transparency (Anderson J, Minnesota Pollution Control Agency, Duluth, Minnesota, USA, pers. comm.). The Rainy River supplies 75% of the watershed P load (568 T/yr; Hargan et al. Citation2011) to LOW. However, up to 36% of the LOW P budget is not accounted for and may represent unmeasured internal P loading (LOW Water Sustainability Foundation Citation2014). Empirical relationships between diffusive P flux and temperature are needed to better estimate an annual internal P loading and predict temperature-related changes in diffusive P flux related to climate change.
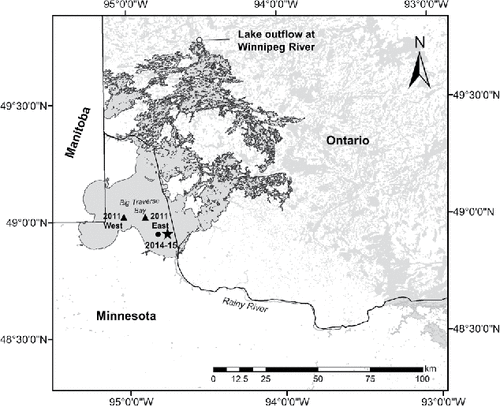
Figure 1. Sediment sampling station location in Big Traverse Bay, Lake of the Woods, Minnesota, USA. Star represents the sampling station location in the present study while triangles denote station sampling in Big Traverse Bay in 2011. The black dot represents the location of the vertical thermistor array in 2015 (Edlund M and Heathcote A, St. Croix Watershed Research Station, Science Museum of Minnesota, unpubl. data).
Additionally, vertical variations in the concentration of biologically labile sediment P fractions (i.e., loosely bound, iron-bound, and labile organic P fractions that are active in internal P loading) can provide important information regarding ecosystem balances between P sedimentation, eventual burial, and removal from recycling (Mooseman et al. Citation2006, Hupfer and Lewandowski Citation2008). For instance, Carey and Rydin (Citation2011) contrasted vertical P distribution in sediments of oligotrophic versus eutrophic systems and found that a peak in sediment P occurred at the sediment surface in eutrophic lakes, suggesting that P burial and diagenetic processes were less than gross P sedimentation. Rydin et al. (Citation2011) indicated that this surface P bulge represented potential internal P loading that is released back to the water column. Thus, analysis of vertical variations in P fractions in the sediment column can provide important additional information on annual internal P loading that can be compared with measurements of laboratory-derived diffusive P fluxes. The goals of this research were to determine (1) seasonal and temperature-related variations in diffusive P fluxes and (2) vertical variations in mobile P concentrations in the sediment column to better understand the role of diffusive flux in internal P loading and the P economy of Big Traverse Bay.
Methods
Sediment sampling procedures and locations
Intact sediment cores (∼30 cm in length) were collected from an established limnological station (Minnesota Pollution Control Agency) in the eastern basin of Big Traverse Bay (48.92182 N, −94.72825 W, 9.5 km north of the Rainy River Mouth) in July and late August 2014, and February and May 2015, to determine seasonal and temperature-related diffusive P fluxes (). Thus, 48 sediment cores were collected at this station for diffusive P flux determination. While this location may not represent sediment characteristics in the entire basin, the goal was to develop statistical relationships between diffusive P flux and temperature. Sediment distribution and vertical variations in sediment chemistry may be relatively homogeneous due to frequent polymixis, resuspension, and redeposition throughout the basin (Hilton et al. Citation1986). An additional core was retrieved at the same sampling station in February 2015 to examine vertical sediment characteristics. A gravity coring device (Aquatic Research Instruments; Hope, Idaho) equipped with an acrylic core liner (6.5 cm inside diameter and 50 cm length) was used to collect sediment. Cores were immediately stoppered, covered to prevent light exposure, and transported vertically on ice to the laboratory for sectioning and processing within 24–36 h. Station locations sampled for summer diffusive P flux determination in 2011 are shown in for comparison (James Citation2017). Big Traverse East and West 2011 were located 18.3 and 26.9 km from the 2014–2015 sampling station, respectively.
Gross diffusive phosphorus flux determination
Methods for determining gross diffusive P flux from intact sediment cores followed James et al. (Citation1995). Twelve replicate cores were collected on each date for rate determination. In the laboratory, sediment cores were carefully drained of overlying water and the upper 10 cm section was extruded intact to a smaller acrylic core liner (6.5 cm diameter and 20 cm height). The additional lake water collected at the sampling location in Big Traverse Bay was filtered through a glass fiber filter (Gelman A-E, <2 µm nominal pore size) and 300 mL siphoned onto the sediment contained in the small acrylic core liner without causing sediment resuspension. The sediment incubation systems were placed in a darkened environmental chamber and incubated for up to 23 d at a seasonally appropriate temperature, depending on collection date. Incubation temperatures were 18 C for July 2014, 25 C for late August 2014, 5 C for February 2015, and 11 C for May 2015. The oxidation–reduction environment in the overlying water of each system was controlled by gently bubbling air (oxic or aerobic) or nitrogen (anoxic or anaerobic) through an air stone placed just above the sediment surface. Bubbling action ensured complete mixing of the water column but did not disrupt the sediment.
Water samples for soluble reactive phosphorus (SRP) were collected from the center of each sediment incubation system using an acid-washed syringe and immediately filtered through a 0.45 µm membrane syringe filter. Samples were collected daily for the first 5–8 d, then at 2–3 d intervals thereafter. The water volume (10 mL) removed from each system during sampling was replaced by addition of filtered lake water preadjusted to the proper temperature and oxidation–reduction condition. These volumes were accurately measured to account for dilution effects. The concentration of SRP in the replacement filtered lake water (near detection limits) was factored into the dilution. SRP was determined colorimetrically on a UV-VIS spectrophotometer (Lambda 25, Perkin-Elmer Corporation; Waltham, Massachusetts) using the ascorbic acid method (APHA Citation2005). The cuvette path length was 1 cm and detection limit for SRP was 0.005 mg/L. Rates of diffusive P flux (mg/m2/d) were calculated over the linear change in P mass versus time using regression analysis (see Appendix).
A ln–ln regression relationship was developed between diffusive P flux and incubation temperature to predict aerobic or anaerobic diffusive P flux as a function of in situ bottom temperature for purposes of estimating an annual internal P loading from bottom sediments (SAS Citation1994). Water temperature above the sediment–water interface (∼0.5 m from sediment) was obtained from vertical thermistor arrays deployed in Big Traverse Bay near the sediment coring station (48.9209 N, −94.7958 W) during summer 2015 (Edlund M and Heathcote A, St. Croix Watershed Research Station, Science Museum of Minnesota, unpubl. data). Monthly mean bottom temperature was used to estimate annual diffusive P flux.
Sediment vertical profiles
The sediment core collected in February 2015 was sectioned at 1 cm intervals over the upper 6 cm, 2 cm intervals between 6 and 10 cm, 2.5 cm intervals between 10 and 20 cm, and 5 cm intervals between 20 and 30 cm. A known volume of sediment was dried at 105 C to determine moisture content and sediment wet and dry bulk density, and then burned at 550 C to determine loss-on-ignition organic matter (Avnimelech et al. Citation2001, Håkanson and Jansson Citation2002). The sequential P fractionation method of Psenner and Puckso (Citation1988) was used to determine ammonium chloride–extractable P (loosely bound P), bicarbonate dithionite–extractable P (iron-bound P), sodium hydroxide–extractable P (aluminum-bound P), and hydrochloric acid–extractable P (calcium-bound P). A subsample of the sodium hydroxide extract was digested with potassium persulfate to measure nonreactive sodium hydroxide–extractable P (Psenner and Puckso Citation1988). Labile organic P was calculated as the difference between reactive and nonreactive sodium hydroxide–extractable P. Additional sediment was dried and ground to determine total P (Andersen Citation1976, Ostrofsky Citation2012a).
The loosely bound and iron-bound P fractions are readily mobilized at the sediment–water interface because of anaerobic conditions that lead to desorption of P from sediment and diffusion into the overlying water column (Mortimer Citation1971, Holdren and Armstrong Citation1980, Boström et al. Citation1982, Boström Citation1984, Nürnberg Citation1988). The sum of the loosely bound and iron-bound P fraction represents redox-sensitive P (i.e., the P fraction that is active in P release under anaerobic and reducing conditions; redox-P). In addition, labile organic P can be converted to soluble P via bacterial mineralization (Reitzel et al. Citation2007) or hydrolysis of bacterial polyphosphates to soluble phosphate under anaerobic conditions (Gächter et al. Citation1988, Gächter and Meyer Citation1993, Hupfer et al. Citation1995). The sum of redox-P and labile organic P collectively represent biologically labile P. This fraction is active in recycling pathways that result in exchanges of phosphate from the sediment to the overlying water column and potential assimilation by algae.
Using an approach like that described in Rydin et al. (Citation2011), an annual gross internal P loading rate was approximated as the difference between the surface and buried P concentration multiplied by a recent annual sedimentation rate of 660 g/m2/yr (Edlund et al. Citation2017). It was assumed that the sedimentation rate has been approximately constant over the upper 5 cm sediment depth. Annual gross P deposition was estimated as the sediment P concentration in the upper 1 cm (i.e., newly deposited P) multiplied by the annual sedimentation rate (mg P deposited/m2/yr). The sediment depth below which P concentrations were constant due to burial and cessation of diagenetic transformation (i.e., stabilization depth, Rydin et al. Citation2011) was determined by visual inspection to estimate an annual P burial rate. The annual P burial rate was calculated as the mean sediment P concentration below this stabilization depth (∼6 cm) multiplied by the annual deposition rate (mg P buried/m2/yr). Phosphorus burial efficiency was calculated as annual P burial divided by annual gross P deposition times 100. Annual gross internal P loading was estimated as gross P deposition minus P burial.
Results and discussion
Variations in diffusive phosphorus flux as a function of temperature
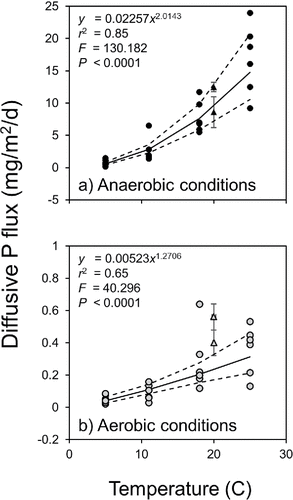
Mean diffusive P fluxes were an order of magnitude higher under anaerobic versus aerobic conditions (). Under summer temperature conditions (i.e., 18–25 C), mean anaerobic diffusive P fluxes ranged between 7.78 mg/m2/d (±1.00 SE) at 18 C in July 2014 and 16.78 mg/m2/d (±2.20 SE) at 25 C in August 2014 (). By comparison, summer aerobic diffusive P fluxes ranged between 0.28 mg/m2/d (±0.07 SE) and 0.36 mg/m2/d (±0.06 SE) on those dates (). In addition, fluxes varied nonlinearly as a function of temperature (). The mean diffusive P flux at the lowest experimental temperature of 5 C was only 0.05 mg/m2/d (±0.01 SE) and 0.77 mg/m2/d (±0.13 SE) under aerobic and anaerobic conditions, respectively. Diffusive P fluxes measured at two other stations in Big Traverse Bay in 2011 at 20 C (James Citation2017) are shown for comparison (). There was some variation between summer aerobic P fluxes determined in 2011 versus 2014. In particular, 2011 aerobic P fluxes at 20 C were higher compared to the 2014 temperature–P flux trend, suggesting possible spatial variation that needs to be considered in future studies. Mean anaerobic P fluxes measured at 20 C in Big Traverse Bay in 2011 (James Citation2017) fell near the regression line and were comparable to 2014 rate determinations. Redox-P concentrations in the upper 10 cm sediment layer were similar among stations (2011 East = 0.24 mg/g, 2011 West = 0.22 mg/g, 2014 = 0.20 mg/g) and did not explain the variation in aerobic diffusive P fluxes. Labile organic P concentrations were also similar among stations at 0.12 mg/g. Perhaps variation in bacterial metabolic processes explained the higher aerobic diffusive P fluxes in 2011 versus 2014.
Figure 2. Variations in mean (±1 standard error, n = 6) diffusive phosphorus (P) flux under (a) anaerobic and (b) aerobic conditions versus collection date and temperature.
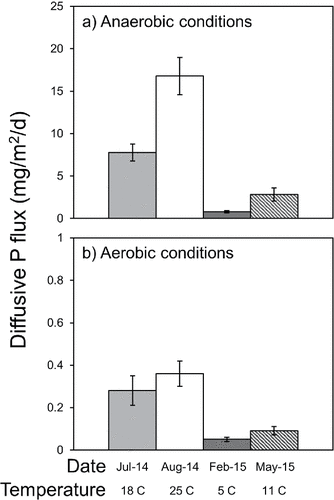
Figure 3. Variations in (a) anaerobic (black circles) and (b) aerobic diffusive phosphorus fluxes (gray circles) versus temperature (n = 6 for each temperature). Dotted lines denote the 95% confidence intervals while the solid line represents the regression line (SAS Citation1994). Black and gray triangles denote diffusive phosphorus fluxes determined from Big Traverse Bay east and west stations in 2011.
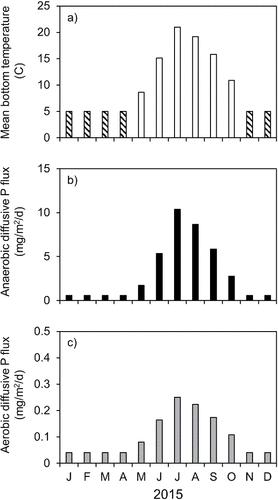
Mean monthly bottom temperature exceeded 20 C and 19 C in July and August 2015, respectively (). Predicted mean monthly diffusive P flux during those months approached 0.3 mg/m2/d and 10 mg/m2/d under aerobic and anaerobic conditions, respectively. The predicted annual aerobic diffusive P flux was ∼0.11 mg/m2/d or 38 mg/m2/yr. The predicted annual anaerobic P diffusive flux rate was 3.2 mg/m2/d or 1171 mg/m2/yr.
Figure 4. Variations in (a) mean monthly bottom temperature ∼0.5 m above the sediment surface and predicted monthly (b) anaerobic and (c) aerobic diffusive P flux estimated from the regression equations presented in . Striped columns denote indirectly estimated bottom temperature based on historic vertical profiles.
Phosphorus deposition, burial, and gross internal P loading
Modest concentration maxima in redox-P, biologically labile P, and total P were observed in the upper 5 cm layer of the sediment core collected in February 2015 (). Concentrations of these constituents declined rapidly to a more constant baseline below a depth of ∼6 cm (). This vertical profile suggested the buildup of potentially mobile P in the upper sediment layer in excess of diagenesis and burial, a pattern typical for eutrophic lake sediments (Carey and Rydin Citation2011, Rydin et al. Citation2011, Malmaeus et al. Citation2012). In contrast, more biologically inert aluminum-bound and calcium-bound P concentrations were relatively constant with sediment depth over the upper 30 cm sediment profile and did not reflect the surface layer mobile P pattern ().
Figure 5. Vertical variations in sediment phosphorus (P) fractions from a sediment core collected in Big Traverse Bay in February 2015. Redox-sensitive P (i.e., redox-P) is the sum of loosely bound and iron-bound P fractions and biologically labile P (i.e., bio-labile P) is the sum of redox-P and labile organic P. Vertical dashed lines denote the mean buried P concentration below the 6 cm sediment depth.
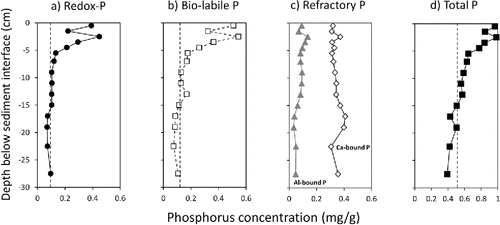
Mean buried redox-P, biologically labile P, and total P concentrations below the 6 cm depth were 0.098 mg/g, 0.124 mg/g, and 0.524 mg/g, respectively (). In contrast, concentrations of these constituents in the upper 1 cm layer were much higher at 0.391 mg/g, 0.509 mg/g, and 0.964 mg/g, respectively. Possible reasons for the development of a surface P concentration bulge in Big Traverse Bay sediment included (1) recent increases in watershed P loading; (2) internal P loading, assimilation as cyanobacterial organic P, deposition back to the sediment, breakdown, and release to iron oxyhydroxides (Fe∼(OOH)); (3) microbial storage as poly-P and release to Fe∼(OOH); and (4) limited capacity and binding sites to retain and bury P (Carignan and Flett Citation1981; Hupfer et al. Citation1995, Citation2007, Citation2008; Gächter et al. Citation1988; Gächter and Meyer Citation1993; Carey and Rydin Citation2011; Rydin et al. Citation2011; Ostrofsky Citation2012b). In the case of Big Traverse Bay, watershed P loading has declined over a period of decades (Hargan et al. Citation2011), so the other mechanisms likely contributed to the vertical P concentration pattern in sediments.
Rydin et al. (Citation2011) suggested that positive differences between surface and buried P concentrations represented an imbalance between gross deposition and burial, the difference of which reflected a long-term average annual internal P loading rate. In effect, the occurrence of concentration maxima in the surface sediment layer provided further indirect evidence that modest internal P loading was likely occurring in Big Traverse Bay despite long-term declines in watershed P loading. Annual internal P loading ranged between 193 mg/m2/yr (0.53 mg/m2/d) for redox-P, 254 mg/m2/yr (0.70 mg/m2/d) for biologically labile P, and 291 mg/m2/yr (0.80 mg/m2/d) for total P ().
Table 1. Estimation of annual long-term internal phosphorus (P) loading from a sediment core collected in Big Traverse Bay in February, 2015, modified from Rydin et al. (Citation2011) as the difference between surface and buried P multiplied by an average sedimentation rate of 660 g/m2/yr.
Possible mechanisms of internal phosphorus loading to Big Traverse Bay
While information on the anoxic factor in Big Traverse Bay will be needed to calculate an annual gross internal P loading rate from diffusive P flux, it was clear that the sediment vertical P profile rate mean of 246 mg/m2/yr was well above the independently estimated annual aerobic diffusive P flux of 38 mg/m2/yr measured at the same station (). While the annual anaerobic diffusive P flux estimate was substantial, Big Traverse Bay probably rarely exhibits bottom anoxia due to frequent polymixis. Thus, aerobic or oxic conditions at the sediment–water interface may mostly regulate diffusive P flux. However, a few periods of bottom anoxia and anaerobic diffusive P flux in the summer could result in a much higher annual diffusive P flux rate. More information is clearly needed to approximate an annual diffuse P flux.
Table 2. A comparison of ranges (minimum, mean, maximum) in annual internal phosphorus (P) loading from large, shallow, polymictic systems in Northern USA and Canada versus Big Traverse Bay, Lake of the Woods. “Partial net” internal P load refers to mass P balance approaches that include some deposition of internal P loads back to the sediment while “gross” internal P load includes only P flux from the sediment into the water column (Nürnberg Citation2009).
Interestingly, annual gross internal P loading in Big Traverse Bay, estimated from the vertical P profile, fell well within ranges reported for other mesotrophic to eutrophic large, shallow, polymictic lakes (). When compared with Rainy River P loading (568 T/yr; Hargan et al. Citation2011), the mean annual internal P loading estimate from the sediment vertical P profile (316 T/yr) represented 36% of the combined P load to Big Traverse Bay. Thus, internal P loading was an important component of the Big Traverse Bay P budget, despite relatively low annual aerobic diffusive P flux.
Nonetheless, annual internal P loading differences suggested that aerobic diffusive P flux only partly explained unaccounted-for internal P loading in the P budget and that other mechanisms need to be identified. James (Citation2017) suggested that equilibrium phosphate exchanges were probably minor during sediment resuspension due to a high linear absorption coefficient and nearly undetectable equilibrium P concentration between sediment and water. Although not measured, intermittent bottom anoxia during temporary stratification may drive much higher anaerobic P flux at times in Big Traverse Bay. However, iron oxyhydroxide formation and P binding during water column mixing and reaeration periods would likely reduce P availability for cyanobacteria uptake. Indeed, sediment Fe:P ratios were high (James Citation2017). If sediment Fe is not removed from reaction by S or organic matter, a high ratio of released Fe relative to P would ensure sequestration by colloidal iron oxyhydroxide and removal back to the sediment (Gunnars et al. Citation2002, Hoffman et al. Citation2013, Kleeburg et al. Citation2013).
Another potential mechanism that might explain the discrepancy between aerobic diffusive P flux and the vertical P profile rate is biological uptake by vertically migrating cyanobacteria or by recently germinated akinetes or spores residing in the sediment. For instance, Chen et al. (Citation2009) and Binding et al. (Citation2011) identified Aphanizomenon flos-aquae blooms in southern bays of LOW, known to form akinetes. Certain cyanobacteria can vertically migrate downward to the sediment interface at night, assimilate P derived from either sediment diffusive flux or the sediment P pool, and move back into the euphotic zone during the day (Barbiero and Welch Citation1992, Barbiero and Kann Citation1994). Recently germinated akinetes or spores residing in the sediment may assimilate sediment P in excess of growth requirements (i.e., luxury uptake), inoculate the water column during optimal conditions, and develop extensive blooms under otherwise P-limited circumstances (Istvanovics et al. Citation1993, Citation2000; Pettersson et al. Citation1993; Perakis et al. Citation1996; Cottingham et al. Citation2015). In both uptake scenarios, eventual cyanobacteria bloom crash, deposition of organic P back to the sediment (versus flushed from the system), breakdown, and readsorption of PO4 onto Fe∼(OOH) over decades could provide a positive internal P recycling feedback loop that maintains a surface sediment P concentration bulge with low P burial despite watershed loading reduction efforts. Indeed, redox-P and biologically labile P burial efficiency under steady-state assumptions was poor in Big Traverse Bay at only ∼25% (), suggesting the possibility that cyanobacteria-mediated biological uptake and internal P recycling may account for some of the unaccounted for internal P load and also play a role in regulating sediment P burial.
Acknowledgments
I gratefully acknowledge J. Bauer and T. Knudsen (University of Wisconsin – Stout), M. Hirst (Lake of the Woods Soil and Water Conservation District), and P. Talmadge (Minnesota DNR) for field sampling support and laboratory analyses. I also thank J. Anderson and N. Baratono (Minnesota Pollution Control Agency); M. Edlund, D. Engstrom, A. Heathecote, and S. Shottler (St. Croix Watershed Research Station – Science Museum of Minnesota); and B. Wilson and G. Kramer (RESPEC Consulting and Services, Inc.) for insightful discussions on Lake of the Woods P budget. Funding was provided by the Minnesota Pollution Control Agency.
References
- Andersen JM. 1976. An ignition method for determination of total phosphorus in lake sediments. Water Res. 10:329–331.
- [APHA] American Public Health Association. 2005. Standard methods for the examination of water and wastewater 21st ed. Washington (DC).
- Avnimelech Y, Ritvo G, Meijer LE, Kochba M. 2001. Water content, organic carbon and dry bulk density in flooded sediments. Aquat Eng. 25:25–33.
- Barbiero RP, Kann J. 1994. The importance of benthic recruitment to the population development of Aphanizomenon flos-aquae and internal loading in a shallow lake. J Plankton Res. 16:1581–1588.
- Barbiero RP, Welch EB. 1992. Contribution of benthic blue-green algal recruitment to lake populations and phosphorus translocation. Freshwater Biol. 27:249–260.
- Binding CE, Greenberg TA, Jerome JH, Bukata RP, Letourneau G. 2011. An assessment of MERIS algal products during an intense bloom in Lake of the Woods. J Plankton Res. 33:793–806.
- Boström B, Jansson M, Forsberg C. 1982. Phosphorus release from lake sediments. Arch Hydrobiol Beih Ergebn Limnol. 18:5–59.
- Boström B. 1984. Potential mobility of phosphorus in different types of lake sediments. Int Revue Ges Hydrobiol. 69:457–474.
- Carey CC, Rydin E. 2011. Lake trophic status can be determined by the depth distribution of sediment phosphorus. Limnol Oceangr. 56:2051–2063.
- Carignan R, Flett RJ. 1981. Postdepositional mobility of phosphorus in lake sediments. Limnol Oceanogr. 26:361–366.
- Chen H, Burke JM, Mosindy T, Fedorak PM, Prepas EE. 2009. Cyanobacteria and microcystin-LR in a complex lake system representing a range in trophic status: Lake of the Woods, Ontario. J Plankton Res. 31:993–1008.
- Cottingham KL, Ewing HA, Greer ML, Carey CC, Weathers KC. 2015. Cyanobacteria as biological drivers of lake nitrogen and phosphorus cycling. Ecosphere. 6:1–19.
- Edlund MB, Schottler SP, Reavie ED, Engstrom DR, Baratono NG, Leavitt PR, Heathcote AJ, Wilson B, Paterson AM. 2017. Historical phosphorus dynamics in Lake of the Woods (USA–Canada) — does legacy phosphorus still affect the southern basin? Lake Reserv Manage. 33: 386–402.
- Gächter R, Meyer JS, Mares A. 1988. Contribution of bacteria to release and fixation of phosphorus in lake sediments. Limnol Oceanogr. 33:1542–1558.
- Gächter R, Meyer JS. 1993. The role of microorganisms in mobilization and fixation of phosphorus in sediments. Hydrobiologia. 253:103–121.
- Gunnars A, Blomqvist S, Johansson P, Anderson C. 2002. Formation of Fe(III) oxyhydroxide colloids in freshwater and brackish seawater, with incorporation of phosphate and calcium. Geochim Cosmochim Acta. 66:745–758.
- Håkanson L, Jansson M. 2002. Principles of lake sedimentology Caldwell (NJ): Blackburn Press.
- Hargan KE, Paterson AM, Dillon PJ. 2011. A total phosphorus budget for the Lake of the Woods and Rainy River catchment. J Great Lakes Res. 37:753–763.
- Hilton J, Lishman JP, Allen PV. 1986. The dominant processes of sediment distribution and focusing in a small, eutrophic, monomictic lake. Limnol Oceanogr. 31:125–133.
- Hoffman AR, Armstrong DE, Lathrop RC. 2013. Influences of phosphorus scavenging by iron in contrasting dimictic lakes. Can J Fish Aquat Sci. 70:941–952.
- Holdren GC, Armstrong DE. 1980. Factors affecting phosphorus release from intact lake sediment cores. Environ Sci Tech. 14:79–87.
- Hupfer M, Gächter R, Giovanoli R. 1995. Transformation of phosphorus species in settling seston and during early sediment diagenesis. Aquat Sci. 57:305–324.
- Hupfer M, Gloess S, Grossart HP. 2007. Polyphosphate-accumulating microorganisms in aquatic sediments. Aquat Microb Ecol. 47:299–311.
- Hupfer M, Glöss S, Schmieder P, Grossart HP. 2008. Methods for detection and quantification of polyphosphate and polyphosphate accumulating microorganisms in aquatic sediments. Int Rev Hydrobiol. 93:1–30.
- Hupfer M, Lewandowski J. 2008. Oxygen controls the phosphorus release from lake sediments – a long-lasting paradigm in limnology. Internat Rev Hydrobiol. 93:415–432.
- Istvanovics V, Pettersson K, Rodrigo MA, Pierson D, Padisak J, Colom W. 1993. Gloeotrichia echinulata, a colonial cyanobacterium with a unique phosphorus uptake and life strategy. J Plankton Res. 15:531–552.
- Istvanovics V, Shafik HM, Presing M, Juhos S. 2000. Growth and phosphate uptake kinetics of the cyanobacterium, Cylindrospermopsis raciborskii (Cyanophyceae) in throughflow cultures. Freshwater Biol. 43:257–275.
- James WF. 2017. Internal phosphorus loading contributions from deposited and resuspended sediment to the Lake of the Woods. Lake Reserv Manage, 33:347–359.
- James WF, Barko JW, Eakin HL. 1995. Internal phosphorus loading in Lake Pepin, Upper Mississippi River. J Freshwat Ecol. 10:269–276.
- Kleeburg A, Herzog C, Hupfer M. 2013. Redox sensitivity of iron in phosphorus binding does not impede lake restoration. Water Res. 47:1491–1502.
- LOW Water Sustainability Foundation. 2014. Rainy-Lake of the Woods. State of the Basin Report. 2nd Ed. http://ijc.org/files/publications/R-LoW_SOBR_2014_web-res.compressed.pdf
- Malmaeus JM, Rydin E, Jonsson P, Lindgren D, Karlsson OM. 2012. Estimating the amount of mobile phosphorus in Baltic coastal soft sediments of central Sweden. Boreal Environ Res. 17:425–436.
- Matisoff G, Kaltenberg EM, Steely RL, Hummel SK, Seo J, Gibbons K, Bridgeman TB, Seo Y, Behbahana M, James WF, et al. 2016. Internal loading of phosphorus in western Lake Erie. J Great Lakes Res. 42:775–788.
- Mooseman L, Gächter R, Müller B, Wüest A. 2006. Is phosphorus retention in autochthonous lake sediments controlled by oxygen or phosphorus? Limnol Oceanogr. 51:763–771.
- Mortimer CH. 1971. Chemical exchanges between sediments and water in the Great Lakes—speculations on probable regulatory mechanisms. Limnol Oceanogr. 16:387–404.
- North RL, Johansson J, Vandergucht DM, Doig LE, Liber K, Lindenschmidt K-E, Baulch H, Hudson JJ. 2015. Evidence for internal phosphorus loading in a large prairie reservoir (Lake Diefenbaker, Saskatchewan). J Great Lakes Res. 41:91–99.
- Nürnberg GK. 1988. Prediction of phosphorus release rates from total and reductant-soluble phosphorus in anoxic lake sediments. Can J Fish Aquat Sci. 45:453–462.
- Nürnberg GK. 2009. Assessing internal phosphorus load – problems to be solved. Lake Reserv Manage. 25:419–432.
- Nürnberg GK, LaZerte BD. 2016. More than 20 sources of estimated Table A1. internal phosphorus loading in polymictic, eutrophic Lake Winnipeg, Manitoba. J Great Lakes Res. 42:18–27.
- Nürnberg GK, LaZerte BD, Loh PS, Molot LA. 2013. Quantification of internal phosphorus load in a large, partially polymictic and mesotrophic Lake Simcoe, Ontario. J Great Lakes Res. 39:271–279.
- Ostrofsky ML. 2012a. Determination of total phosphorus in lake sediments. Hydrobiologia. 696:199–203.
- Ostrofsky ML. 2012b. Differential post-depositional mobility of phosphorus species in lake sediments. J Paleolimnol. 48:559–569.
- Perakis SS, Welch EB, Jacoby JM. 1996. Sediment-to-water blue-green algal recruitment in response to alum and environmental factors. Hydrobiologia. 318:165–177.
- Pettersson K, Herlitz E, Istvanovics V. 1993. The role of Gloeotrichia echinulata in the transfer of phosphorus from sediments to water in Lake Erken. Hydrobiologia. 253:123–129.
- Psenner R, Puckso R. 1988. Phosphorus fractionation: Advantages and limits of the method for the study of sediment P origins and interactions. Arch Hydrobiol Biel Erg Limnol. 30:43–59.
- Reitzel K, Ahlgren J, DeBradandere H, Waldebäck M, Gogoll A, Tranvik L, Rydin E. 2007. Degradation rates of organic phosphorus in lake sediment. Biogeochemistry. 82:15–28.
- Rydin E, Malmaeus JM, Karlsson OM, Jonsson P. 2011. Phosphorus release from coastal Baltic Sea sediments as estimated from sediment profiles. Est Coast Shelf Sci. 92:111–117.
- [SAS] Statistical Analysis System. 1994. SAS/STAT Users Guide. Version 6 4th edition. Cary (NC): SAS Institute.
Appendix
Table A1. Replicate diffusive phosphorus (P) flux regression analysis for various dates. r2 = coefficient of determination, CI = confidence interval, SE = standard error of the mean.
