
ABSTRACT
McDaniel T, Pascoe T. 2017. Applying the reference condition approach to Lake of the Woods: sediment and benthic invertebrate community assessment for lake-wide management. Lake Reserv Manage. 33:452–471.
Lake of the Woods (LOW) is a large, international lake recently designated as impaired by the State of Minnesota due to excess nutrients and nuisance algal blooms. Concerns regarding the impacts of eutrophication have prompted the need for management tools to help to defines areas of ecosystem impairment and to monitor changes in trophic status. The goal of this study was to assess areas of potential anthropogenic impacts in LOW using a benthic macro-invertebrate reference condition approach model and identify factors correlating with these impacts. We also sought to provide baseline information on sediment chemistry prior to the initiation of increased mining activity in the basin. A Canadian Aquatic Biomonitoring Network (CABIN) reference model was developed for LOW to compare the benthic community structure at a number of potentially stressed or impaired sites. Concentrations of both nutrients and metals in sediments at many sites in LOW exceeded Ontario provincial and Canadian federal effect levels for aquatic life. The benthic community at some locations was found to be divergent from reference sites, with substantial reductions in diversity and abundance associated with stress to the benthic community. As expected, benthic invertebrate diversity appeared to be most affected at sites that were deep, thermally stratified and high in nutrients thus making them prone to hypoxia. Benthic diversity was also negatively associated with higher concentrations of metals such as lead and arsenic. The CABIN approach can provide a useful tool in lake management for the identification of stressed sites.
Concerns regarding the impacts of eutrophication to freshwater lakes is well documented world-wide and is considered likely to be exacerbated by concurrent climate warming (Jones and Brett, Citation2014). Cultural eutrophication is well known in areas of intense anthropogenic influence such as run-off from urban areas of high population density or areas of intense agriculture however there is some debate regarding the extent and direction of eutrophication in natural lakes in North America, particularly those that appear to experience minimal anthropogenic stressors (Smith et al. Citation2014). Eutrophication in lakes often results in an increase in algal biomass and ultimately to potentially harmful algal blooms. In deep lakes that experience thermal stratification, detritus from excess algal blooms can lead to depletion of oxygen in the hypolimnion and benthic zones which can be detrimental to benthic organisms.
The benthic zone is an important component of the lake ecosystem (Vadeboncoeur et al. Citation2002). Sediments act as an important sink for many of the compounds delivered to lakes from the watershed. In general, lake sediments are the repository of organic matter from the biota in the watershed and of inorganic matter from the weathering of soil and rocks. They are also a sink for the deposition for contaminants, such as metals. In particular, in eutrophic lakes sediments can be an important source of internal loading as nutrients, particularly phosphorus, cycle between sediments and overlying waters (James Citation2017a). The sediments and overlying water layers are home to an important biological community. Within this larger community, macroinvertebrates were monitored as indicator organisms of ecosystem health. Benthic macroinvertebrates have a number of characteristics which make them ideal indicator organisms (Rosenberg and Resh Citation1993). They are common in lakes and streams and form an important part of the aquatic ecosystem, moving energy through the aquatic food web and on to the terrestrial food web (Vadeboncoeur et al. Citation2002). Many species are relatively long lived so changes in the community may reflect cumulative or intermittent stressors that could be missed during instantaneous sampling. They are relatively sedentary and so reflect local conditions, and inhabit bottom substrates, so are exposed directly to sediment contaminants.
There is a need to develop management tools to define areas of ecosystem impairment in lakes (Reynoldson et al. Citation1995, USEPA Citation1994). The Canadian Aquatic Biomonitoring Network (CABIN) is an integrated, national, network for collecting, managing, assessing and distributing information on the biological condition and biodiversity of aquatic ecosystems in Canada, led by Environment and Climate Change Canada (ECCC) (https://www.ec.gc.ca/rcba-cabin/). The approach complements traditional stressor-based physical and chemical water quality monitoring by providing an effect-based indicator of the biological integrity of a water body. The CABIN experimental design is based on the reference condition approach (RCA), whereby potential impaired sites are compared to a large group of minimally impacted reference sites. CABIN employs the Benthic Assessment of SedimenT method (BEAST) to build a predictive bio assessment model based on the benthic invertebrate community at minimally impacted reference sites (Bailey et al. Citation2004, Reece and Richardson Citation2000). Once developed, the reference model can be used to assess potentially impacted sites to assess their degree of impairment, relative to the reference baseline. It can also be used to track temporal changes in the benthic community in response to factors such as climate change or remediation efforts. Although commonly used for stream assessments this method has also been utilized successfully to characterize the benthic community in the Great Lakes (Reynoldson et al. Citation1995). Nevertheless the application of this method to large lakes is challenging. Unlike in stream assessments where each site may be independent catchment, sites within a single lake are not truly independent from one another. It is also often difficult to identify reference sites in a large lake environment where there is typically some exposure to anthropogenic impacts.
The goals of this study were to characterize the sediment and benthic macro-invertebrate community of a large lake in a relatively remote area, where concerns regarding eutrophication and increased algal blooms have been identified, and to identify areas of impairment. The primary aim was the production of a CABIN reference model to successfully assess areas of impacts to the benthic community. This model can act as a tool to facilitate effective adaptive management at the watershed level. We also sought to explore some of the factors contributing towards impairment in the benthic community of large lakes and identify specific areas of impairment in the lake. Another goal was to provide baseline information on sediment chemistry, with a particular focus on metal concentrations, prior to the initiation of increased mining activity.
Study site
Lake of the Woods (49.0610° N, 94.8475° W) is a large lake located on the borders of Ontario, Manitoba, Canada and Minnesota, USA. It is situated in an area of relatively low population density and only 2% of the watershed is agricultural (Clark and Sellers Citation2014). Currently there is little to moderate industrial activity in the basin however early in the previous century LOW was the site of a gold boom (Beard and Garratt Citation1976, Bruce Citation1932) and throughout much of the last 70 years there were two active pulp mills on the Rainy River, the main tributary to LOW. One mill is currently closed and the other has greatly improved water treatment and reduced production however it is still a major source of nutrients. More recently, LOW has become a major tourist destination for American and Canadian visitors, providing hunting, fishing, and recreational activities to thousands of people every year. The expansion of both industry and settlement has impacted the LOW, and the protection of the unique physical and ecological characteristics of such an important area has become an important issue for the watershed and the people who live there (Clark and Sellers Citation2014, IJC Citation2012). Recently, evidence has suggested that water quality has begun to decline in LOW, and there are reports back as far as the 1960s that suggest the decline began much earlier, (IJC Citation1963, Summers et al. Citation2012). Associated with this is a perception that noxious and potentially toxic cyanobacterial blooms on the lake have increased in both scale and severity (Clark and Sellers Citation2014). LOW was recently designated as impaired by the state of Minnesota due to excess phosphorus and nuisance algal blooms (Clark and Sellers Citation2014). An assessment of phosphorus loading has suggested that sediments may be a significant internal source of phosphorus to the lake (Hadash Citation2010). There is also a concern that an increase in mining in the LOW watershed will lead to downstream contamination of water and sediment.
Concerns regarding the decline in environmental quality in LOW prompted the need for management tools to monitor impacts of eutrophication to the ecosystem and assess changes to mitigative actions. In response to these concerns, ECCC undertook work in Lake of the Woods in 2008 to characterize the sediment chemistry and benthic community and examine potential impacts of environmental degradation (Pascoe et al Citation2014).
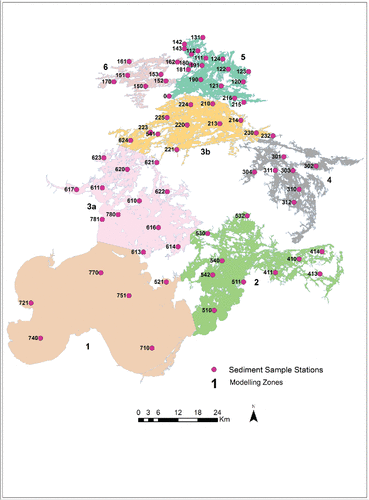
Straddling both the prairie and the boreal eco-zone LOW is hydrologically complex consisting of large, shallow basins to the south and smaller, deep basins in the north. A hydrological model developed by ECCC divides the lake into 6 sub-basins, sediment sampling sites were distributed throughout the lake to better characterize these sub-basins (Zhang et al. Citation2013, ). Surficial sediments were sampled at 72 sites on LOW during the second and third week of September from 2008 to 2010 and 2012 to 2014. Sites were primarily located offshore (average depth 11.5 m, average distance to shore 898 m), often situated near the center of sub-basins in depositional zones (appendix Table A.1). Most sites were sampled in a single year only but 5 stations were sampled up to six times to assess temporal variation.
Figure 1. Locations of benthic sampling sites and lake basins on Lake of the Woods from 2008 to 2014. Inset shows sites in the northern basin of the lake near Kenora, ON.
Materials and methods
Sample collections and analysis
Methods for sampling sediments and benthic invertebrates follow the open water protocol developed by ECCC/CABIN for assessing the benthic invertebrate community in large lakes (Reynoldson et al. Citation1995). Briefly, Sediment was collected using a 38 cm × 38 cm × 46 cm mini-box core and sub-sampled for the analysis of physical traits, chemistry and benthic invertebrates. One box core was taken per site, except where sites were sampled in multiple years. To sample benthic invertebrates, five separate mini-cores were sub-sampled from the main core using 10 cm acrylic cylinders (internal diameter 6.6 cm). Cylinders were inserted into the top portion of the core before the surrounding water was drained away to avoid disturbing the uppermost layer of sediment. Each of the five mini-cores was considered to be a replicate sample unit. Individual mini-cores were preserved with 200 ml of 10% buffered formalin for later processing. Benthic invertebrate samples were sent to laboratories certified under the Society of Freshwater Taxonomic Certification Program (http://www.sfstcp.com/) for identification. The laboratory used for the initial 2008 samples was LCA Environmental Consultants (Grimsby, ON), while samples from the remaining 5 years were processed by Ecoanalysts Inc, (Moscow, ID). Taxanomic lists were comparable between laboratories. Samples were fully sorted and identified to the lowest taxonomic level. For QA/QC purposes 10% of samples were sent to the CABIN national taxonomist for verification of identification and sorting efficiency (Environment Canada Citation2014). Samples must fulfill the criteria of 95% accuracy for both identification and sorting efficiency. Four samples from 2013–14 failed the criteria for sorting efficiency so all samples from these years were returned to the taxonomic laboratory for re-sorting and identification. Subsequent QA/QC confirmed that sorting efficiency and identification accuracy for all years then exceeded 95%.
Approximately 1 L of the remaining top layer of sediment from the box core, at each site, was collected with a polyethylene scoop, to an approximate depth of 5 cm, homogenized in a glass pan and sub-sampled for the analysis of grain size and sediment chemistry. A 400 ml sample of sediment was placed in a 500 ml PCE jar for the analysis of nutrients and metals. For grain size analysis a 100 ml of sediment was sampled into a 100 ml PCE jar. For nutrients, metals and grain size analysis sediment samples were first freeze dried. At a subset of 5 sites, distributed throughout the lake (ECCC basins 1, 2, 3a, 5), a 125 mL sample of sediment was placed in environmentally cleaned glass jars for the analysis of polycyclic aromatic hydrocarbons (PAHs) and polychlorinated biphenyls (PCBs). Physical chemical parameters (pH, turbidity, dissolved oxygen (DO), temperature, specific conductivity) of water overlying the sediment were measured using a YSI 6600 sonde prior to sediment sampling. A vertical profile of temperature from surface to bottom was conducted to determine the presence or absence of a thermocline.
Grain size analysis was performed using a Horiba high-performance laser diffraction analyzer by the sedimentology laboratory of the Canada Centre for Inland Waters, ECCC using standard methods (Segal et al. Citation2009). Sediment was analyzed for PAHs and PCBs at the National Laboratory for Environmental Testing using standard methods (Environment Canada Citation1997). Analysis of metals, nutrients and organic matter in sediment was conducted by Caduceon Environmental Laboratories. Most metal species were analyzed according to US EPA method 6010 using inductively coupled plasma atomic emission spectrometry (USEPA Citation2007) with the exception of antimony and arsenic which were measured using US EPA method 6020 for inductively coupled plasma mass spectrometry (USEPA Citation1998). Nutrients (total Kjeldahl nitrogen and total phosphorus) were measured using method MOEE 3367. Organic matter, as estimated by loss on ignition at 550 C, was measured using Agriculture Canada method 84-045 (Agriculture Canada Citation1984).
Statistical analysis
Concentrations of metals and nutrients in the sediment were compared between basins in LOW. Data sets for some metal compounds such as antimony and arsenic included non-detects with multiple lower detection limits so comparisons of means were conducted using a generalized Wilcoxon test for multiple detection limits using the Nada package in R (Lee Citation2015) according to the methods of Helsel (Citation2012).
Site comparisons of metal concentrations may be influenced by sediment composition, as metals are differentially associated with components of the sediments. Normalizing metal concentrations by examining the relationship between metal concentrations and organic matter can help to distinguish outlier sites, where concentrations are higher than expected and may be the result of anthropogenic impacts (Kersten and Smedes Citation2002). Total metal concentrations are also often normalized with aluminum, because geological weathering normally results in a fairly consistent ratio between metal species and aluminum for a given rock structure and is not normally associated with anthropogenic inputs (Schropp et al. Citation1990). Concentrations of metals in the sediments were regressed with both aluminum and organic matter, measured as loss on ignition, using a linear regression. Outlier sites were identified as falling outside the 95% prediction for the regression. Note that although this procedure was used to identify outlier sites all spatial comparisons and correlations with biological endpoints used raw, non-normalized metals data.
Concentrations of metals and nutrients in the sediments were compared to Ontario provincial and Canadian federal aquatic sediment quality guidelines. Four sets of guidelines were used for comparison. Sediment metal concentrations were compared to the Canada Council for Ministers of the Environment (CCME)'s interim sediment quality guidelines (ISQG) and probable effect level (PEL) concentrations for the protection of aquatic life (CCME Citation2002). Sediment nutrient and metal concentrations were compared to Ontario provincial guidelines for the protection of aquatic life at both a low effect level (LEL) and severe effect levels (SEL) (MOECC Citation1993). A sediment quality index value was calculated for each site using each of the 4 sets of guidelines using the CCME's Sediment Quality Index (SeQI) calculator, variables are listed in (CCME Citation2007). SeQI scores ranged from 1 – 100 with 100 indicating no guideline exceedances. These indexes provide an overall picture of the degree of impairment in sediment chemistry based on the frequency and amplitude of guideline exceedances for a number of compounds. SeQI scores for low effect guidelines provide an indication of occasional effects to the benthic community (CCME Citation2002) SeQI scores for probable and severe effect levels provide an indication of pronounced disturbance of the benthic community (Grapentine et al. Citation2002).
Typically, several years of data are required to generate an adequate reference model for the benthic community, opening up the potential for temporal variation and annual effects. Seventy two sites were sampled over a 3 year period. Five of these sites were sampled in multiple years to assess temporal variation in community parameters. It was important to account for differences attributed to between-year effects before data were combined. An analysis of variance (ANOVA) was used to test for differences between sites and between years for percent dominant family (Dom), Ephemeroptera-Plecoptera-Tricoptera taxa (EPT), Shannon-Wiener diversity, Simpsons evenness, abundance and total number of families, for the five repeated sites.
The BEAST approach was used to identify groups of suitable reference sites to which potential test sites were compared (Reynoldson et al. Citation1997). The identification of pristine reference sites was a challenge as most sites on Lake of the Woods are exposed to the impact of algal blooms at one time or another. In addition, it was known that the baseline concentrations of metals in nearby surficial lake sediments in the geographic area are high in comparison to provincial and federal guidelines (Felix Citation2005, Dyer et al. Citation2006). The BEAST approach advocates the use of minimally impacted reference sites. In this case since the majority of sites were expected to exceed one or more provincial or federal guideline the decision was made to choose those that exceeded the fewest. Least impacted sites were defined as having an average SeQI value of greater than 70. This cut off was based on the distribution of SeQI values. It is important to note that during the construction of the reference model sediment nutrient and metal concentrations were not included as potential predictor variables. Only environmental variables that were considered removed from anthropogenic impact in the lake such as depth and distance from shore were chosen.
A reference model was constructed using family-level abundance data (Reynoldson et al. Citation1997). Sites visited in multiple years were retained in the modeling to include temporal variation; this represented 25% of observations. Family level abundance data were converted to a resemblance matrix using Bray Curtis similarity in Primer (version 6.113/2007, PRIMER-E, Plymouth) after first undergoing a fourth root transformation. A hierarchical cluster analysis was performed on the biological data to group reference sites using flexible Unweighted Pair-Group arithMetric Averaging (UPGMA) and used to classify reference sites into groups. Non-metric multidimensional scaling was used to characterize the benthic composition of reference groups. Following classification of sites based on the structure of the biological community a forward step-wise discriminant function analysis (DFA) of habitat variables was used to characterize the habitat for each of the reference groups.
The benthic community at test sites was compared to a reference bio assessment model using BEAST (Reynoldson et al. Citation1995). Habitat data at each test site was used to classify each test site to the reference group which it most resembled, using the above DFA model. The community structure of test sites were then compared to the associated reference group through ordination using non-metric multidimensional scaling (NMDS).Test sites were classified as non-divergent (ND) if they were within the 90% probability ellipse of the appropriate reference group, mildly divergent (MD) if they were between the 90 and 99% probability ellipse, divergent (D) if they were between the 99 and the 99.9% probability ellipse and severely divergent (SD) if they were outside the 99.9% probability ellipse.
The habitat and community characteristics of test and reference sites were examined in order to assess the degree of impairment and explore factors that might contribute towards this. Biological indexes can provide a measure of community health. We compared the percent dominant taxa, the number of EPT individuals, Shannon Wiener diversity, Simpson's evenness, total abundance and the total number of taxa amongst reference and test sites using an ANOVA. We examined the relationship between these biological indices and sediment chemistry, specifically the degree of sediment guideline exceedances, by correlating each biological index to the average sediment quality index using a Pearson correlation. A partial least square analysis was used to relate habitat variables to these biological indices in Statistica. Although correlational in nature, we also used multi-variate techniques to explore which habitat variables appear to have had the most impact in structuring the benthic community. To further explore whether sediment chemistry results matched up with the BEAST analysis any habitat sediment chemistry parameters found to correlate with benthic biological indices in the Partial Least Square model were compared using a one way ANOVA between test reference groups identified in the BEAST analysis. The BEST routine in Primer was used to relate the rank similarities in the community matrix with that of the habitat matrix for all benthic sites. Due to the large number of candidate habitat variables the BVSTEP stepwise procedure in Primer was employed to determine which habitat variables best explained community structure.
For parametric statistical tests such as ANOVAs and Partial Least Squares, variables were transformed if they failed to meet the assumptions of homogeneity of variance.
Results
Sediment chemistry
The main goal of sediment sampling in LOW was to characterize sediment chemistry and the benthic macroinvertebrate community. For this reason, we targeted areas with substrates suitable for sampling with a mini-box core; typically soft mud and silt found in depositional zones. Since a specific substrate type was selectively sampled we cannot make general conclusions about all substrate types present in LOW. Based on grain size analysis, benthic sites were heavily dominated by silt () although a few sites had a higher proportion of gravel and sand. On average the sediment was composed of 20% organic matter as indicated by Loss on Ignition (LOI) (). Sediment was analyzed from 5 sites for PCBs and PAHs, and all were below the detection limits for these compounds. For this reason no further testing for these compounds were conducted on the remaining samples.
Table 1. Particle size and composition of sediment for benthic invertebrate sites on Lake of the Woods. Particle size is in microns.
Table 2. Sediment concentrations of metals, nutrients and minerals by LOW basin.
In contrast to levels of PCBs and PAHs, levels of metals in LOW sediments were well above detection limits and in many cases exceeded sediment quality guidelines. Metal concentrations between major basins in LOW were compared; average concentrations by basin are found in . In general, concentrations of many metals were lower in the more shallow southern basins 1, 2, 3a and highest in the deeper northern basins 3b, 4, 5 and 6. Specifically concentrations of antimony were significantly higher in the northern basins of zone 5 (Kenora Bay) and 6 (Clearwater Bay). Cadmium was lowest in zone 4 (Sabaskong Bay), and chromium concentrations were lowest in zone 6 (Big Traverse). Copper concentrations were highest in zone 6 and lowest in zone 1. Lead concentrations were significantly lower in the southern zones 1 and 2. Mercury concentrations were highest in zone 5, this was mostly driven by one site adjacent to an old gold mine. Strontium was significantly higher in zone 6, 3 and 3a and lowest in zone 5 and 1.
In LOW sediments, loss on ignition (LOI) was positively correlated with concentrations of arsenic (r = 0.31, P = 0.008), chromium (r = 0.52, P < 0.0001), cobalt (r = 0.28, P = 0.017), copper (r = 0.06, P < 0.0001), iron (r = 0.43, P < 0.0001), lead (r = 0.47, P < 0.0001), nickel (r = 0.47, P < 0.0001), strontium (r = 0.58, P < 0.0001), vanadium (r = 0.49, P < 0.0001), yttrium (r = 0.51, P < 0.0001) and zinc (r = 0.54, P < 0.0001). Sites 303, 310 (Whitefish Bay), 180 (Poplar Bay) and 161 (Deception Bay) stood out as having higher than expected concentrations of arsenic based on the 95% prediction limits of the regression between LOI and arsenic concentrations (). Similarly site 302 (Whitefish Bay) had higher than expected concentrations of copper (), site 303 (Whitefish Bay) had higher than expected concentrations of nickel, and site 131 (Kenora Harbor) had higher than expected concentrations of lead in relation to organic matter.
Figure 2. a. Regression of arsenic and LOI (organic matter) concentrations in sediment. b. Regression of titanium and aluminum. c. Regression of iron and aluminum concentrations. d. Regression of nickel and aluminum. e. Regression of copper and LOI. Dotted lines represent the 95% prediction limit of the regression.
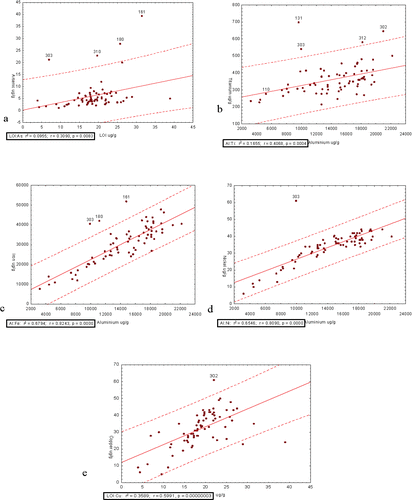
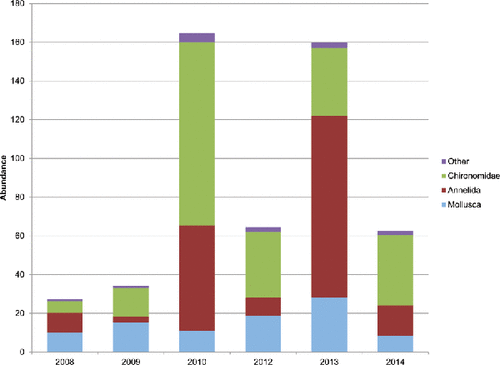
Figure 3. Average number of benthic macro invertebrates per core as classified by major taxonomic group from 5 temporally replicated sites from Lake of the Woods (n = 42) from 2008 to 2010.
Aluminum concentrations were positively associated with metal concentrations with r > 0.4 for barium, chromium, cobalt, copper, iron, lead, nickel, strontium, titanium, vanadium, yttrium and zinc (P < 0.001). Deviations from this relationship with aluminum were seen at sites180 and 303 for barium; 303 for cobalt; 303, 180 and 161 for iron (); 303 for nickel (); 521, 617 and 161 for strontium; 131, 302, 303 and 3012 for titanium (); and 303, 180 (Poplar Bay) and 190 for vanadium.
Concentrations of metals in aquatic sediments of LOW were found to exceed a number of provincial and federal guidelines for the protection of aquatic life at the low effect, probable and severe effect levels (). More than 80% of sites exceeded provincial lowest effect levels (LEL) for the protection of the benthic ecosystem for chromium, copper, manganese and nickel. Concentrations of lead and arsenic also exceed provincial LELs for a moderate (26%) number of sites. Seven percent of sites exceeded federal probable effect levels for arsenic and one site (161 Deception Bay) exceeded provincial severe effect levels. One site, 124 near Sultana Island, exceeded probable and severe effect levels for mercury. Eighty-two percent of sites on the lake have ferric oxide concentrations that exceed the province of Ontario's severe effect level guideline and slightly less than half of the sites exceeded severe effect guidelines for manganese.
Table 3. Exceedences in Ontario and Canadian sediment quality guidelines for the protection of aquatic life at the LEL and SEL levels and the percentage of sites that exceed these guidelines. Also shown are SeQI scores based on the four sets of guidelines.
Concentrations of calcium and magnesium in the sediments varied significantly by LOW basin, being highest in Big Traverse (1) and lowest in the northern most basin near Kenora (5) (). Concentrations of sodium were significantly higher in basins S3b, S4 (Whitefish) and S6 (Clearwater). Total organic carbon (TOC) by weight ranged from 0.8% to 26% in aquatic sediment.
Not surprisingly, nutrient concentrations in the surficial sediments of LOW were also elevated. Concentrations of total Kjeldahl nitrogen (TKN) ranged from 560 to 15 200 µg/g, exceeding provincial aquatic sediment quality guidelines LELs at all LOW sites. Concentrations were highest in Clearwater Bay (6) and lowest in Big Traverse (1). Total phosphorus concentrations in surficial sediments in LOW ranged from 652 – 6,420 µg/g but did not differ significantly between LOW basins. All sites exceeded provincial LELs for phosphorus of 600 µg/g and five sites: 122 (Bigstone Bay), 180 (Poplar Bay), 161 (Deception Bay), 190, and 310 (Whitefish Bay) exceeded provincial SELs.
Four sediment quality index values were calculated for each site based on the 2 sets of provincial and 2 sets of federal guidelines. The average SeQI for the lake was given for each of the 4 sets of guidelines. The SeQI for federal CCME guidelines for the protection of aquatic life was 81 and for federal severe effect levels was 99. Federal guideline exceedances were based only on concentrations of metals. SeQI value for provincial LELs was 42.4 and the 89.2 for SELs. For these calculations guidelines for nutrients and additional metal species were included.
Benthic macro-invertebrate community analysis
Temporal effects
Amongst temporally replicated sites there were no significant differences in any of the parameters between years whereas all parameters with the exception of Dominance were significantly different between sites (). While not statistically significant abundance appeared to be higher in 2010 and 2013 with Chironomids and Annelids (Naididae and Tubificinae) contributing to this increase ().
Table 4. Results of analysis of variance of benthic community indexes for site and year effects for five temporally replicated sites.
BEAST analysis
The following twelve sites with an average SeQI of under 70 were identified as potentially impaired or tests sites (120, 122, 124, 150, 161, 180, 210, 220, 224, 302, 303 and 310). The remaining sites were classified a priori as reference sites based on a SeQI of over 70.
Reference sites were classified into three groups during UPGMA analysis of community structure main groups identified as a, d and e (). Group a consisted of 20 samples from the southern-most portion of the lake, larger reference group d consisted of 49 samples throughout LOW and included more eastern sites, the smallest group, e, consisted of 11 samples mostly in the middle of the lake in the main flow of water. Most temporally replicated sites were consistently classified within the same reference grouping but temporally replicated sites 610 and 710 were originally classified in group e in 2008–9 but were classified as belonging to group d in subsequent years. Group a was characterized by a higher proportion of Glossiphoniidae, Leptoceridae, Valvatidae, and Hydrobidae and Group d was differentiated by higher abundances of Chaoboridae, Naididae, and Pisidiidae (). Group e was differentiated by higher abundances of Ephemeridae, and lower abundances of most other major families in comparison to the other two reference groups.
Figure 4. a. Cluster analysis of the benthic invertebrate composition of 84 reference sites. b. Multi-dimensional scaling of the benthic community of the two reference groups, with vectors indicating Pearson correlations with families greater than R = 0.4.
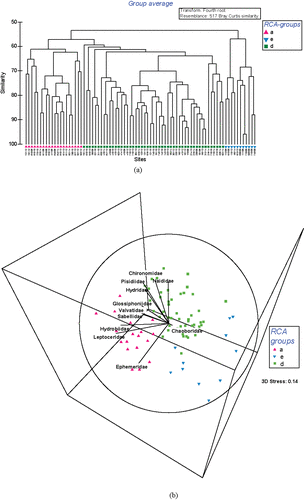
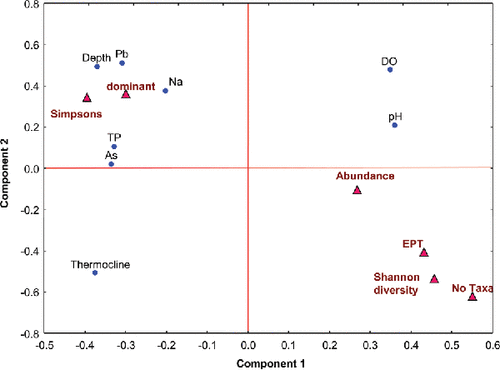
Figure 5. Factor loading for Partial Least Squares (PLS) analysis of benthic indexes number of EPT taxa and total number of taxa.
The final DFA model included four independent variables: depth (F = 8.4, p = 0.0005), percentage of sand (F = 7.4, p = 0.0011), distance from shore (F = 4.1, p = 0.0217) and longitude (F = 4.0, p = 0.023). Overall the model was successful in classifying sites based on their benthic community groupings, misclassifying only 21% of sites. The classification error rate was 4 out of 20 sites or 20% for Group a, 5 out of 49 sites or 10% for Group d and 8 out of 11 sites or 70% for Group e. In general, Group a consisted of shallow, sandy sites in the southern end of the lake. Group d consisted of silty sites, closer to shore and more to the east while Group e consisted of deeper, sandy sites.
The reference model was then used to evaluate test sites to determine the degree of impairment, if any at these sites. Test sites were sometimes sampled in multiple years to see if the degree of impairment changed. The last two digits of the site name indicate the year of collection. Test sites were classified as being more similar to either group a or group d, no test sites were similar to group e. Six of the test sites were within the 90% probability ellipse for their respective reference group and were classified as non-divergent (ND) or not impaired: 122–12, 150–13, 210–08 and 210–09, 224–14, 302–13 and 303–12. Four test sites were considered mildly divergent (MD): 124–12 (Sultana Island), 150 (−08, −10,−14), 161-13 (Deception Bay), and 310–12 (Whitefish Bay). Four test sites were classified as divergent (D): 120–08 (Bigstone Bay), 180-10 (Poplar Bay), 220-08 and 310-08 (Whitefish Bay). Only one test site was classified as highly divergent, which was 180–08 (Poplar Bay) (HD). It is interesting to note that the majority of divergent and highly divergent sites were from 2008.
We examined benthic metrics at both test and reference sites to assess the degree of impairment. In general, Shannon-Wiener diversity was low at all sites, being close to 1, with diversity and total number of taxa being significantly higher in reference Group a than at all other sites (F = 10.04, p < 0.0001). Diversity dropped at divergent sites and was significantly lower at the highly divergent (HD) site, which consisted of only one family. On average more than 50% of each sample was dominated by one taxon (at the family level) for both reference groups (). This is not unexpected as most of these samples were taken outside of the littoral zone, typically in the middle of the basin, and diversity was not expected to be high. Ephemeroptera, Plecoptera, Trichoptera (EPT) were not seen at any potential test sites although they were present to some degree in reference groups, with significantly higher numbers in reference Group e (F = 9.57, p < 0.0001). Simpsons evenness was similar for most groups with the exclusion of the most divergent site (HD) which again consisted of individuals of only one family. Abundance was higher in reference Groups a and d, but abundance in reference Group e was similar to test sites with the exception of the highly divergent site, where abundance was significantly lower than at all other sites (F = 15.15, p < 0.0001). In general the benthic community at the divergent site 180-08 (Poplar Bay) appeared to be the most impacted, as compared with reference sites. Divergent (D) sites showed some degree of impairment as indicated by a lack of EPT taxa and a reduction in overall abundance.
Table 5. Benthic metrics for two main reference groups and test sites, shown beside the appropriate reference group.
Table 6. Mean habitat characteristics of three reference groups, a, d and e as well as Non-Divergent (ND) test sites, Mildly Divergent (MD) test sites, Divergent (Div) test sites and Severely Divergent (SD) test sites.
In order to determine if there was a relationship between the degree of impairment to sediment quality and the health of the benthic community, we correlated the average SeQI value at each site to a number of benthic indices. The SeQI was positively correlated with the number of EPT taxa at each site (r = 0.44, p < 0.0001), Shannon Weiner diversity (r = 0.339, p = 0.001), the number of taxa (r = 0.448, p < 0.0001) and negatively correlated with Simpsons Evenness (r = −0.32, p = 0.001).
In order to help determine which environmental factors were the most important in structuring the benthic community in LOW, a partial least squares analysis was performed to determine which environmental variables accounted for the most variation in benthic invertebrate metrics. Metrics included the number of EPT taxa and total number of taxa. There was one significant component to the model which explained 36% of the variance in the combined indexes (R2x = 0.57, R2y = 0.36, λ = 8.72). Depth, and sediment concentrations of total phosphorus, sodium, arsenic and lead and the presence of a thermocline were positively correlated with a high Simpsons Evenness, and % dominant taxa and negatively correlated with abundance, number of EPT individuals, diversity measures. High concentrations of dissolved oxygen and pH were positively associated with abundance, diversity measures, and number of EPT individuals ().
Those parameters which were found to be significantly correlated with benthic metrics in the partial least squared analysis were further explored to see if they corresponded to the results of the BEAST analysis. An examination of habitat characteristics amongst the BEAST site groupings revealed a strong effect of depth. Reference group a was significantly shallower than other sites, while the HD, Divergent and ND groups were significantly deeper (F = 18.04, p < 0.0001), reference groups d and e were slightly deeper (). Dissolved oxygen was on average high at reference sites but was depressed at divergent sites (D), with the highly divergent site showed signs of anoxia (F = 6.14, p < 0.0001). Interestingly DO was also depressed at non divergent sites (ND) although the benthic community at these sites showed no degree of impairment. Similarly pH was highest at reference sites, and significantly lower at test sites, particularly the divergent and highly divergent sites (F = 7.93, p < 0.0001). Sediment chemistry, particularly chemicals of concern such as total phosphorus, lead and arsenic, also corresponded with the results of the BEAST analysis. Arsenic concentrations were significantly higher at the Highly Divergent and Divergent site groupings, somewhat lower at the Non-Divergent and Mildly Divergent test sites and significantly lower at reference sites (F = 14.7, p < 0.0001). Total phosphorus concentrations followed the same patterns (F = 16.73, p < 0.0001). Lead concentrations were significantly higher at all four test site groupings, particularly the Divergent group, and significantly lower at the three reference groupings (F = 12.14, p < 0.0001). Interestingly sediment sodium concentrations also varied significantly amongst groups, being significantly higher at Highly Divergent and Divergent sites and lowers at Mildly Divergent sites and reference groups d and a, while reference group e had intermediate concentrations of sodium. (F = 5.23, p = 0.0001).
While indexes can help to summarize complex community data into one variable, more information is retained in the original community structure. We examined which environmental variables were most correlated with NMDS community composition scores at each site using the BEST routine in Primer. The model with the best fit had a correlation of 0.50 and was significant within 1%. The variables that best correlated with community structure were site depth, and sediment chemistry parameters aluminum, arsenic, calcium and sodium concentrations.
Discussion
Sediment chemistry
Prior to the onset of metal mining activity directly upstream of LOW we felt it was important to document background concentrations of sediment chemistry, particularly metals. This was deemed especially relevant as reports indicated that background concentrations of metals were high in other local lakes but little or no sediment chemistry data existed for the majority of LOW. Sediment chemistry can also be an important factor structuring the benthic community. In the following section we also identify specific areas of high nutrient and metals concentrations in the lake that may lead to impairment of the benthic community.
The sediment at most of our LOW sites was dominated by silt and high organic carbon. This is may be partially due to our pre-selection for substrates soft enough to allow box coring. Locations with a high percentage of fine particles such as silt likely represent areas of sediment accumulation where water velocity slows and fine suspended sediment particles are deposited to the sediments below. High TOC content in LOW sediments may be reflective of organic matter from algal blooms given the wide distribution.
Concentrations of PCBs and PAHs were below detection limits in the subset of five sediment samples tested. This was expected given the lack of industrial sources of PCBs and PAHs in the LOW basin. There is some biological data to corroborate this; it was reported that concentrations of PCBs were found to be low in bald eagle populations on LOW (Donaldson et al. Citation1999).
In contrast to PCBs and PAHs, concentrations of metals appeared elevated, often exceeding provincial and federal guidelines including, in some cases, exceeding probable and severe effect levels. While safety factors are built into guideline estimates, concentrations that exceed these can potentially indicate harmful impacts to the benthic ecosystem.
Mercury is a compound of interest in the LOW watershed, as in many northern areas. With the exception of a few outlier sites, sediment mercury concentrations were fairly uniform throughout LOW and were generally below federal and provincial guideline concentrations. A small number of sites showed elevated mercury concentrations, particularly site 124 near Sultana Island which exceeded federal severe effect levels. It should be noted that fish consumption advisories are in effect for fish in this basin based on their mercury burdens (MOECC Citation2015). Concentrations of arsenic were spatially heterogeneous, with a small number of sites exceeded federal sediment quality guideline probable effect levels of 17 mg/kg (CCME Citation2002) and exceeded provincial severe effect levels at 1 site in Deception Bay (161). Concentrations above severe effect levels are expected to have an impact on the benthic community.
While the source of elevated concentrations of some metals in LOW sediments cannot be precisely known we suspect that much of this is the result of natural geological weathering with the exception of some outlier sites. Metals are deposited in lake sediments via natural geochemical processes such as sediment deposition from weathering of rocks, especially in areas naturally high in metal ores such as the LOW watershed. Previous reports indicate that metal concentrations in the sediments of lakes in the nearby vicinity are high. In 2000, the Ontario Geological Survey initiated lake sediment sampling in the Kenora district for ore- associated metals such as arsenic, chromium, copper and lead (Dyer et al. Citation2006, Felix Citation2005). For the majority of compounds concentrations of metals in sediments of LOW were slightly higher or similar to those found in the sediments of nearby lakes. Interestingly, concentrations of manganese and lead in LOW sediments were above average for the Kenora area exceeding highly anomalous 98 percentiles for lake sediments in the Kenora area as determined by the Ontario Geological Survey.
We wished to determine if there were sites in the lake that stood out as having higher than expected concentrations of metals indicative of anthropogenic stressors. Most sites fit within the predicted 95% intervals with aluminum and were consistent with geological weathering. However we detected a number of outlier sites after normalization with both organic matter and aluminum including sites in Kenora Harbor (131), Deception Bay (161), Poplar Bay (180), Whitefish Bay (302, 303, 310, 312), the Northwest Angle (617), and Big Island (521) in the south east of LOW which may be indicative of elevated concentrations as the result of anthropogenic inputs.
Anthropogenic sources of metals may include heavy industry, mining and smelting. Aerial deposition from industrial processes and coal burning can disperse metals for large distances and is a known source of mercury in the basin (Swain et al. Citation1992) Two outlier sites (Deception Bay 161, and Kenora Harbor 131) are located adjacent to busy harbors and marinas; a potential anthropogenic source of metals. We speculate that high concentrations of metals at some of the outlier sites may also be a legacy of historic mining. While most contemporary mining operations in the basin are in the exploratory or development phase, there is an extensive mining history in the basin. This includes the former Steep Rock Mine, a large iron ore mine from the WWII era from which there was an accidental release of a large volume of suspended sediments to the Seine River in 1951 (Sowa et al. Citation2001). Historically, the northeastern region of LOW near Rat Portage (now Kenora), Bigstone Bay and Whitefish Bay was the site of active gold mining near the turn of the last century (Bruce Citation1932, Beard and Garratt Citation1976). Several of the outlier sites were located near former goldmines including Whitefish Bay (sites 303, 310) which was home to the Regina Mine and Poplar Bay (180) which was home to the Minerva gold mine both potential sources of arsenic from tailings (Beard and Garratt Citation1976, Davies and Smith Citation1988). Several gold mines were also located in the vicinity of Bigstone Bay (site 120) including Keewatin, Herman, Bull Dog and the largest, the Winnipeg Consolidated, which is immediately adjacent to sampling site 120 in Bigstone Bay. Some mines, such as the Sultana Mine, had on-site stamping mills, where mercury (quicksilver) was used in extractions. Site 124, the site with the highest levels of mercury, was located adjacent to the small island the Sultana mine was located on.
Recently, there has been an increase in the exploration and development of gold deposits and sulphate-rich ores in the basin in both Canada and the United States and mining activity is expected to increase. The impact that this new mining activity will have on the basin is yet to be determined, but continued monitoring is prudent. The concentrations presented in this paper form a baseline for metal concentrations in the sediments prior to the initiation of new mining activities in the basin.
High concentrations of nutrients in LOW sediments were not unexpected for such a productive lake. Excess biotic production such as during cyanobacterial blooms results in the deposition of nutrients into the sediment from dead biotic material. The largest external source of phosphorus into the system is expected to be from the fallout of suspended sediments and materials transported from the Rainy River and other tributaries. As the LOW phosphorus budget indicates, considerably more phosphorus enters the lake than leaves via the Winnipeg River, with the remainder eventually sequestering in the sediments (Hargan et al. Citation2011). It is not known whether the main source of legacy phosphorus in the sediments is from natural or anthropogenic sources; however, in the past, concentrations of phosphorus and waste from the paper industry and municipal sewage were much higher in the Rainy River than at present, and much of this historic input likely still resides in the lake sediments (Edlund et al. Citation2017). Elevated nutrient concentrations in the sediments have important consequences for nutrient cycling and nutrient loading models for LOW. Internal loading of phosphorus from sediments may be an important part of the phosphorus load to the water column in LOW (James Citation2017a,Citationb, Edlund et al. Citation2017).
Elevated concentrations of nutrients and metals in surficial sediments at some sites in LOW may have implications for the health of the benthic community. Exceedances of provincial and federal sediment quality guidelines do not necessarily indicate that the sediments themselves pose a toxicological threat as the toxicity of metals is highly dependent upon their biological availability however exceedances above the PEL and SEL levels do define concentrations where adverse effects are more likely to occur with frequency (CCME Citation2002). To determine if sediments at these sites and others represent a risk to the benthic community, it was necessary to look at the benthic community structure itself.
Benthic macro-invertebrates
The goal was to produce a CABIN reference model to characterize the benthic community of the lake at reference sites and to use this to assess test sites for potential impairment. For a benthic model to be robust it is important to capture temporal variation as communities undergo fluctuations from year to year. This was demonstrated by the fact that two of the temporally replicated sites were classified in different reference groups in different years. In order to build a reference model based on spatial location it is important to determine that the variance between sites is greater than the temporal variance within sites. We were able to confirm that this was the case for LOW by showing that the variance in a set of 6 benthic metrics within a set of temporally replicated sites was non-significant while variance between sites was.
A preliminary CABIN model was developed to characterize the benthic community of groups of reference sites on LOW and successfully used to assess 12 candidate test sites over multiple years for impairment to the biological community. Of these sites four (180 (Poplar Bay), 120 (Bigstone Bay), 220 and 310 (Whitefish Bay)) were identified as significantly impaired at the divergent or highly divergent level in at least one year. Three test sites (124-12 (Sultana), 161-13 (Deception Bay) and 150) were identified as mildly divergent suggesting limited or mild impairment while five test sites were not impaired. Biological indexes also indicated impairment at the four divergent and highly divergent sites. Indicators of diversity and abundance were lowest at the divergent and highly divergent sites although reference group e also had relatively low abundance and diversity. The number of EPT individuals was significantly higher at reference sites, with none being found at test sites. Simpson's evenness and percent dominant taxa were significantly higher at the highly divergent site, but this is because only one taxa was found at this site.
While a preliminary CABIN model was successfully developed and utilized some adjustments could be made that would likely improve the model. The assignment of reference sites to reference groups based on community structure was sub-optimal. Site clustering showed a high degree of chaining and the results of the DFA showed a high degree of error in classifying one reference group (e), which had a low sample size. A larger number of reference sites may help to better define reference Group e. A more pressing concern is that some of the differences in community structure between reference groups and test sites are possibly confounded by differences in depth. On average test sites were significantly deeper than reference sites, with the exception of mildly divergent sites which were similar to reference sites, and depth tended to increase with the category of divergence with highly divergent sites being the deepest. Although not an anthropogenic stressor, depth is known to be important in structuring the benthic community. Dissolved oxygen and pH followed a similar pattern with depth and was lowest at the non-divergent, divergent and highly divergent test sites. These factors are also likely correlated with depth and the presence of a thermocline, more common at deep sites. It should be noted that reference groups do include some deep sites, particularly reference Groups d and e. Also, not all deep test sites were impaired; five test sites were shown not to be impaired despite the fact that they were both relatively deep, and experienced some degree of hypoxia. That being said the model would definitely benefit from the inclusion of more reference sites with greater depth. It is important to retain the ability to compare candidate test sites which are deep and undergo thermal stratification as they are the most likely to be susceptible to hypoxia in eutrophic lakes.
Although exploratory in nature, both multivariate analysis of the influence of environmental factors on the benthic community indicated that several environmental variables were correlated with the benthic community structure including physical factors such as depth and the presence or absence of a thermocline, and chemical factors such as metals (arsenic and lead), nutrient (total phosphorus) and mineral (sodium and calcium) concentrations. It was not possible to determine precisely which environmental variables in each multivariate component were responsible for the variation in benthic metrics, as many were highly correlated with each other. For instance, DO and metal concentrations were often negatively correlated at our benthic sites. At some deep stratified sites both low oxygen and high metal concentrations may be having a negative impact on the benthic community making it difficult to distinguish which stressors are actually driving changes in the benthic community.
While this remains true some of the sediment chemistry variables identified in the multivariate analysis were further explored using univariate tests to determine if there was a relationship between the results of the BEAST analysis and individual sediment chemistry parameters lead, arsenic, sodium and phosphorus. There was good correspondence between sites identified as impaired in the BEAST analysis and higher sediment concentrations of all four of these parameters. As mentioned above the toxicity of metals, such as lead and arsenic, are highly dependent on the speciation of these metals and whether or not they are sorbed to particles (Van Griethuysen et al. Citation2004). Trace metals tend to bind to clay and organic material making them biologically unavailable (Koelmans Citation1998). Normalization of arsenic concentrations with organic matter, as represented by loss on ignition, identified sites which deviated from this relationship and where arsenic concentrations may have been more available to the biota. Three of these four sites (161, 180 and 310) were assessed as impaired during the BEAST analysis when compared to the reference model. Arsenic was significantly higher at divergent and highly divergent sites. Similarly sediment concentrations of lead were significantly higher at all four test site groupings as compared to reference sites. Total phosphorus was significantly higher at test sites as compared to reference sites, particularly at the highly divergent site. Sodium concentrations were significantly higher at divergent and highly divergent sites. Benthic structure was also correlated with calcium concentrations in the sediment. Calcium has been demonstrated to reduce the bioavailability of metals in the sediment to macroinvertebrates and this may explain why it was identified as significantly correlated to the NMDS benthic community axes in the BEST analysis (Van Hattum et al. Citation1991).
Further evidence of the impact of sediment chemistry on the benthic community in Lake of the Woods were the positive correlations between the average SeQI and several benthic indexes such as the number of number of EPT individuals, Shannon Wiener Diversity and number of taxa at each site. Higher SeQI values indicate higher sediment quality or a reduced number of sediment guideline exceedances so in general sites with fewer sediment guideline exceedances had higher benthic diversity, and more EPT individuals. Although correlative in nature this suggests that SeQI may be a useful preliminary measure for predicting impacts to the benthic community. So far all of the evidence provided here to suggest sediment chemistry is impacting the benthic community is correlational in nature. Another line of evidence could be provided by sediment exposures to benthic organisms in the laboratory, where other confounding factors such as depth and dissolved oxygen could be controlled. This is a possible avenue of exploration for future work.
In addition to sediment chemistry impacts of eutrophication are suspected to be one of the main causes of impairment to the benthic community. Both multivariate analyses point to impairment of the benthic community in association with deep basins, which are thermally stratified and prone to low DO concentrations. This is not uncommon in eutrophic water bodies where excessive productivity is linked with hypoxic conditions in the hypolimnion. Benthic structural community changes from excessive productivity may be partially mediated by changes in food availability and tolerance to hypoxia (Kotta et al. Citation2007). However, although abundance is expected to initially increase with increasing food availability, benthic invertebrate diversity is expected to decrease, particularly as DO concentrations decline. Nutrient status in LOW ranged from mesotrophic to eutrophic depending on the area and season, as indicated by phosphorus concentrations (Pascoe et al. Citation2014). Notably phosphorus was significantly higher at test sites in Lake of the Woods, particularly divergent and highly divergent sites and was negatively associated with some benthic metrics in the PLS analysis. Some deep, isolated embayments such as Poplar Bay (180) and Bigstone Bay (120) were prone to both high nutrients and low DO concentrations while several other deep water sites did not show the same degree of hypoxia or impairment to the benthic community, although most of them also undergo some form of thermal stratification. Isolated embayments like these may be more susceptible to hypoxia because they are sheltered and outside of the main flow of water in the lake, leading to longer and more stable periods of stratification and allowing a build-up of nutrients.
Paleolimnological evidence suggests that some of the trends seen in the benthic invertebrate community may be related to changes in climate, particularly in regards to enhancing the impacts of eutrophication. Surveys of Chironomid and Chaoborus remains in Poplar Bay (180) suggest that substantial declines in hypolimnetic oxygen in Poplar Bay may have started in the 1970s preceding much of the cottage development, although development may be an additional stressor on the benthic community (Summers et al. Citation2012). Certainly, if average annual temperatures continue to increase on LOW, the extent and duration of thermal stratification and subsequent hypoxia in the hypolimnion will only become more extensive, placing additional stress on the benthic community. The establishment of this current CABIN reference model for LOW should allow managers to track subsequent temporal changes in the benthic community of the lake that might be expected in response to factors such as climate change, or as a measure of success against mitigation measures to reduce nutrient loadings and harmful algal blooms. Monitoring for climate change may involve intermittent monitoring of a set of key reference sites over a long time period, perhaps once every five years. Reference sites suitable for this type of monitoring may be those located in deeper basins which do not currently undergo hypoxia but where oxygen concentrations may be expected to drop in the future as climate warms. Conversely in order to track the efficacy of mitigation measures a set of impaired sites could be monitored over time to see if the benthic community at these sites moves towards the reference condition.
Conclusions
A reference model was developed for the offshore benthic community of LOW using the reference condition approach. The CABIN reference model can now be used to assess potentially test sites to assess their degree of impairment, relative to the reference baseline, as we have demonstrated here. At a small number of sites, the invertebrate community appeared to be impaired. In general factors associated with benthic impairment included depth, low dissolved oxygen and elevated concentrations of some sediment contaminants, such as arsenic, aluminum and sodium. While the reference model will continue to be tested and refined it is hoped that future studies will be able to use it to assess new potential test sites. It can also be used to track temporal changes in the benthic community in response to factors such as climate change or remediation efforts. In this way the model can then be used to facilitate effective adaptive management at the watershed level.
Concentrations of metals and nutrients in the sediments of LOW appeared elevated, often exceeding provincial and federal guidelines for the protection of aquatic life. While the source of these elevated metal concentrations is unclear we identified some outlier sites that deviated from normal weathering and deposition patterns and which appeared to be impaired. We trust that the information on sediment metal concentrations will form a useful basis for background levels prior to the establishment of new mining operations in the basin.
Supplemental_Information.pdf
Download PDF (52.6 KB)Acknowledgments
This work would not have been possible without the hard work and excellent technical expertise of Jeffrey Hanna and Benoit Lalonde during many years of field collections. We thank Lee Grapentine for comments and suggestions. Funding was provided by Environment and Climate Change Canada's Lake Winnipeg Basin Initiative 1 and 2.
Related Research Data
References
- Agriculture Canada. 1984. Loss of ignition in analytical methods manual 1984. Ottawa (ON): Land Resource Research Institute, LRRI Contribution. 84–30.
- Bailey RC, Norris RH, Reynoldson TB. 2004. Bioassessment of freshwater ecosystems using the reference condition approach. Boston, MA: Kluwer Academic Publishers.
- Beard RC, Garratt G. 1976. Gold deposits of the Kenora-Fort Frances area: districts of the Kenora and Rainy River. Ontario Divisions of Mines, Mineral Deposits Circular. MDC 16.
- Bruce EL. 1932. Gold deposits of Kenora and Rainy River districts. Toronto (ON): Province of Ontario Department of Mines.
- [CCME] Canadian Council of Ministers of the Environment. 2002. Canadian sediment quality guidelines for the protection of aquatic life. Updated. In: Canadian environmental quality guidelines, 1999. Winnipeg (MB): Canadian Council of Ministers of the Environment.
- [CCME] Canadian Council of Ministers of the Environment. 2007. Sediment Quality Index Calculator. Available online at www.ccme.ca/
- Clark BJ, Sellers TJ. 2014. Rainy-Lake of the Woods state of the basin report, 2nd ed. Kenora (ON): Lake of the Woods Water Sustainability Foundation.
- Davies JC, Smith PM. 1988. The geological setting of gold occurrences in the Lake of the Woods area, Ontario Geological Survey Open File Report 5695. 381 pp.
- Donaldson GM, Shutt JL, Hunter P. 1999. Organochlorine contamination in bald eagle eggs and nestlings from the Canadian Great Lakes. Arch Environ Contam Toxicol. 36:70–80.
- Dyer RD, Ravnass C, Felix VE, Russell DF. 2006. Kakagi Lake area lake sediment geochemical survey, Northwestern Ontario. Ontario Geological Survey, Open File Report 6186.
- Edlund M., Schottler SP, Reavie ED, Engstrom DR, Baratono NG, Leavitt PR, Heathcote AJ, Wilson B, Paterson AM. 2017. Historical phosphorus dynamics in Lake of the Woods (USA – Canada)—does legacy phosphorus still affect the southern basin? Lake Reserv Manag. 33:386–402.
- Environment Canada. 1997. Manual of analytical methods volume 3, Organics. Burlington (ON): The National Laboratory for Environmental Testing (NLET).
- Environment Canada. 2014. CABIN Laboratory Methods: Processing, taxonomy and quality control of benthic macroinvertebrate samples. Ottawa (ON): Department of Environment.
- Felix VE. 2005. Eagle Lake area high-density regional lake sediment and water geochemical survey, Northwestern Ontario. Toronto (ON): Ontario Geological Survey, Open File Report 6104.
- Grapentine L, Marvin C, Painter S. 2002. Initial development and evaluation of a sediment quality index for the Great Lakes region. Human and Ecolog. Risk. Assess. 8:1549–1567.
- Hadash J. 2010. Assessment of total phosphorus loading in the US portion of Lake of the Woods. St. Cloud (MN): St. Cloud State University.
- Hargan KE, Paterson AM, Dillon PJ. 2011. A total phosphorus budget for the Lake of the Woods and the Rainy River catchment. J Great Lakes Res. 37:753–763.
- Helsel DR. 2012. Statistics for censored environmental data using Minitab and R. 2nd ed. New York (NY): John Wiley and Sons.
- [IJC] International Joint Commission. 1963. Pollution of international boundary waters: Summary report of the advisory board on water pollution Rainy River and Lake of the Woods to the International Joint Commission United States and Canada. 1960–1962 Investigations. Washington (DC): International Joint Commission.
- [IJC] International Joint Commission. 2012. Report to the governments of the United States and Canada on bi-national water management of the Lake of the Woods and Rainy River watershed. Washington (DC): International Joint Commission.
- Lee L. 2015. NADA: Nondetects and data analysis for environmental data-R package version 2010.
- James W. 2017a. Internal phosphorus loading contributions from deposited and resuspended sediment to the Lake of the Woods. Lake Reserv Manag. 33:347–359.
- James W. 2017b. Diffusive phosphorus fluxes in relation to the sediment phosphorus profile in Big Traverse Bay, Lake of the Woods. Lake Reserv Manag. 33:360–368.
- Jones J, Brett MT. 2014. Lake nutrients, eutrophication and climate change. In Global Environmental Change. Springer Science. pp. 273–279.
- Kersten MK, Smedes F. 2002. Normalization procedures for sediment contaminants in spatial and temporal monitoring- a critical review. J. Environ. Monit. 4:109–115.
- Koelmans AA. 1998. Geochemistry of suspended and settling solids in two freshwater lakes. Hydrobiologia. 364:15–29.
- Kotta J, Lauringson V, Kotta I. 2007. Response of zoobenthic communities to changing eutrophication in the northern Baltic Sea. Hydrobiologia. 193:97–108.
- [MOECC] Ministry of the Environment and Climate Change. 1993. Guidelines for the protection and management of aquatic sediment quality in Ontario. Toronto: OMOE. ON.
- [MOECC] Ministry of the Environment and Climate Change. 2015. Guide to eating Ontario fish 2015–2016. Toronto (ON): Queens Press.
- Pascoe T, McDaniel T, Watson S, Yerubandi R, Binding C, Zhang W, Greenberg T. 2014. Environment Canada's Lake of the Woods science initiative 2008–2011. Ottawa (ON): Department of the Environment.
- Reece PF, Richardson JS. 2000. Biomonitoring with the reference condition approach for the detection of aquatic ecosystems at risk. In: Darling IM, editor. Proceedings of a conference on the biology and management of species and habitats at risk. Kamloops B.C., 15–19 Feb, 1999. Vol. 2. Victoria (BC): British Columbia Ministry of Environment, Lands and Parks.
- Reynoldson TB, Norris RH, Resh VH, Day KE, Rosenberg DM. 1997. The reference condition: a comparison of multimetric and multivariate approaches to assess water-quality impairment using benthic macroinvertebrates. J N Am Benthol Soc. 16:833–852.
- Reynoldson TB, Bailey RC, Day KE, Norris RH. 1995. Biological guidelines for freshwater sediments based on a Benthic Assessment of SedimenT (the BEAST) using a multivariate approach for predicting biological state. Austral J Ecol. 20:198–219.
- Rosenberg DM, Resh VH (Eds.). 1993. Freshwater Biomonitoring and Benthic Macroinvertebrates. New York. NY: Chapman and Hall.
- Schropp SJ, Lewis FG, Windom HL, Ryan JD. 1990. Interpretation of metal concentrations in estuarine sediments of Florida using aluminum as a reference element. Estuaries. 13:227–235.
- Segal E, Shouse PJ, Bradford SA, Skaggs TH, Corwin, DL. 2009. Measuring particle size distribution using laser diffraction: implications for predicting soil hydraulic properties. Soil Sci. 174:639–645.
- Smith VH, Dodds WK, Havens KE, Engstrom DR, Paerl HW, Moss B, Likens GE. 2014. Comment: cultural eutrophication of natural lakes in the United States is real and widespread. Limnol. Oceanogr. 59:2217–2225.
- Sowa VA, Adamson RB, Chow AW. 2001. Water management of the steep rock iron mines at Atikokan, Ontario during construction, operations, and after mine abandonment. In: Proceedings of the 25th annual British Columbia mine reclamation symposium. Campbell River (BC): Technical and Research Committee on Reclamation. pp. 104–115.
- Summers JC, Ruhland KM, Kurkek J, Quinlan R, Paterson AM, Smol JP. 2012. Multiple stressor effects on water quality in Poplar Bay, Lake of the Woods, Canada: a midge-based assessment of hypolimnetic oxygen conditions over the last two centuries. J Limnol. 71:34–44.
- Swain EB, Engstrom DR, Brigham ME, Henning TA, Brezonik PL. 1992. Increasing rates of atmospheric mercury deposition in midcontinental North America. Science. 257:784–787.
- [USEPA] US Environmental Protection Agency. 1994. Assessment and remediation of contaminated sediments (ARCS) program. Great Lakes National Office. Chicago, Illinois: EPA 905/B-94/002.
- [USEPA] US Environmental Protection Agency. 1998. Method 6020 A (SW-846): Inductively Coupled Plasma-Mass Spectrometry, Revision 1. Washington (DC): United States Environmental Protection Agency.
- [USEPA] US Environmental Protection Agency. 2007. Method 6010 C (SW-846): Inductively Coupled Plasma-Atomic Emission Spectrometry, Revision 3. Washington (DC): United States Environmental Protection Agency.
- Vadeboncoeur Y, Vander Zanden J, Lodge DM. 2002. Putting the lake back together: reintegrating benthic pathways into lake food web models. Bioscience. 52:44–54.
- Van Griethuysen C, Van Baren J, Peeters ETH, Koelmans AA. 2004. Trace metal availability and effects on benthic community structure in floodplain lakes. Environ Toxicol Chem. 23:668–681.
- Van Hattum B, Van Straalen NM, Govers H. 1991. Abiotic and biotic factors influencing in-situ trace metal levels in macroinvertebrates in freshwater ecosystems. Environ Toxicol Chem. 10:275–292.
- Zhang W, Watson SB, Rao YR, Kling HJ. 2013. A linked hydrodynamic water quality and algal biomass model for a large, multi-basin lake: A working management tool. Ecolog. Modelling. 269:37–50.