
Abstract
Miranda L, Bull L, Colvin M, Hubbard W, Pugh L. 2018. Segmentation of Mississippi’s natural and artificial lakes. Lake Reserv Manage. 34:376–391.
Segmentations divide a diverse resource into groups, or segments, based on distinctive attributes that may respond similarly to management actions. A 4-way segmentation based on lake origin (natural or artificial) and size (small or large) was constructed for Mississippi lakes using a 30 yr data set. We aimed to document elements distinguishing these segments to understand relationships among them and to seek insight into lake management that may be apparent at the segment scale but not at the lake scale. Analyses pinpointed differences among the 4 segments relative to nutrient levels, fish assemblage composition, fishery characteristics, angler catch, and fishery management objectives. In general, most artificial lakes were eutrophic, varied widely relative to species composition depending on whether they impounded small or large rivers, their fish assemblages could be heavily influenced by stocking, provided principally centrarchid fisheries, and the management focus was on angler harvest. Most natural lakes were hypereutrophic, included higher species richness, provided a greater diversity of fisheries, and the management focus was on fish populations and habitat. Fishing success was similar across segments. The group-wise differences substantiate the segmentation and bring into focus a new level of concepts not typically relevant when considering lakes in isolation, such as issues about lake quantities, similarities, and geographical distributions. The segmentation represents the framework needed for considering lakes as parts of a larger and interactive management system.
A central challenge in the administration of freshwater fisheries is managing numerous lakes via small staffs and shrinking operating budgets. Collectively, inland lakes provide important fisheries but are often fragmented into hundreds of geographically dispersed systems with diverse size and accessibility. Consequently, some lakes may go unmanaged, some may be managed with sparse information, and some managed through statewide blanket regulations—all the while personnel and funds are prioritized for high-profile lakes.
One way to address the complexity of managing a large lake resource is to segment it. A segmentation divides a diverse resource into groups, or segments, based on distinctive attributes (Fisher Citation1997). The segments are composed of lakes with similar characteristics (e.g., physicochemistry, fish assemblages, angler orientation) that are expected to respond similarly to management actions. Segmentation can make it easier to identify actions likely to achieve management objectives, and can reduce the risk of ineffective management actions (Connelly et al. Citation2000, Duarte et al. Citation2009). When a resource is segmented based on key characteristics, and management actions are customized to those characteristics, the likelihood of achieving management objectives increases relative to generically applying actions across all lakes. Segmentation can also be used to develop a management strategy, including objectives and actions, for lakes with no or limited monitoring data. Lastly, segmentation can heighten awareness about freshwater resources at a scale larger than the single lake, and provide insight into management objectives and actions that emerge only when the lakes are organized at the segment scale.
Segmentations of freshwater systems have been developed based on various system-specific attributes. These include trophic status (Jones and Knowlton Citation1993), limnological features (Emmons et al. Citation1999), fish assemblages (Tonn and Magnuson Citation1982, Dolman Citation1990, Gassner et al. Citation2005), recreational fisheries (Miranda Citation1999), and landscape features (Soranno et al. Citation2010, Krogman and Miranda Citation2015). In streams and rivers, segmentations have relied on aspects such as hierarchy (Strahler Citation1952), morphology (Rosgen Citation1994), watershed (Frissell et al. Citation1986), fish habitat (Modde et al. Citation1991), and fish assemblages (Fieseler and Wolter Citation2006, Lyons et al. Citation2009). The variables used to define segments depend on the application goal, but any number of segmentation approaches can be useful.
Commonly, lake segmentations are developed intuitively based on lake origin and size. A typical origin dichotomy is the natural vs. artificial split. This split has been applied by various authors to study lake characteristics (e.g., Canfield and Bachman Citation1981, Jones et al. Citation2008) and by the U.S. Environmental Protection Agency to target sample lakes in their recurrent National Lake Assessment (Peck et al. Citation2013). Natural lakes originate from various sources including glaciation, tectonics, earthquakes, wind, dissolution of limestone, and meandering rivers. Artificial lakes are reservoirs constructed for hydropower, flood control, navigation, and water supply, most commonly achieved by building a dam across a river. A second gradient is size (Downing et al. Citation2006, McDonald et al. Citation2012). Both natural and artificial lakes range widely in surface area, and often exhibit right-skewed distributions with few large lakes and many small ones (Lehner and Döll Citation2004).
Segmentation based on lake origin and size has also been applied in Mississippi, first casually, and subsequently through protocol starting in 1986 (MDWC Citation1986). Natural lakes in the state are mostly abandoned channels of meandering rivers (i.e., oxbow lakes) that may range in age from less than 100 yr old to thousands of years old (Miranda Citation2016). Artificial lakes are reservoirs less than 100 yr old constructed mostly for flood control, navigation, and recreation. Oxbow lakes associated with the Mississippi River, whether within or outside its levees, tend to be larger than those of smaller river systems, creating a bimodal oxbow lake size distribution. Conversely, the distribution of reservoir areas is right skewed and continuous, with few large reservoirs and many small ones, requiring an arbitrary partitioning into small and large (defined in the Methods section).
We aimed to document and compare nutrient levels, fish assemblages, fisheries, and management objectives distinguishing segments of Mississippi lakes. This information can help to better understand the relationships among lake segments, their fish assemblages, and the fisheries they provide. Such understanding may contribute to enhanced lake conservation and management. We also sought to gain new insight into lake management that may only emerge when considering lakes at the broader scale supported by segmentation. While the following data and segmentation attributes are specific to Mississippi lakes, we suggest that the results are of broader interest because formally or informally many environmental protection and fish conservation agencies segment their lake resources in some manner.
Study site
Extending over 500 km north from the Gulf of Mexico and over 250 km east from the Mississippi River, the State of Mississippi encompasses an area of 125,500 km2. The state includes several river basins with diverse lentic systems (Ross Citation2001). To the west, the floodplain of the Mississippi River, now mostly disconnected by levees constructed to contain flooding, is a relatively flat area decreasing in elevation at a rate of about 0.2 m/km in a southward direction, and land use is primarily row-crop agriculture. The region includes hundreds of natural lakes left behind by migration of contemporary rivers including the Mississippi and Yazoo, as well as prehistoric rivers including the Ohio and distributaries of the Mississippi (Saucier Citation1994). Building reservoirs in this region is usually not feasible because of the flat terrain, although minor dams are often installed to maintain or increase water levels in natural lakes. To the east, the terrain is hilly, and land use is a mixture of row-crop agriculture and forestry. Lakes are mostly artificial, constructed by damming tributaries to the Yazoo and Tombigbee rivers. To the south, hills are smaller, land use is largely forestry, and the major rivers including the Pearl and Pascagoula are mostly free-flowing. In these southern basins, lakes are principally abandoned channels of the major river systems and small reservoirs constructed in minor tributaries.
Given this geography, lakes have distinct distributions within Mississippi (). Natural lakes occur mostly in the west along the original Mississippi River floodplain, with exceptions in other major river basins including the Tombigbee, Pearl, and Pascagoula. Natural lakes associated with the Mississippi River are mostly large (85% are >100 ha; herein referred to as large natural lakes), whereas those associated with other rivers are mostly small (80% are <100 ha; small natural lakes). Artificial lakes have been constructed statewide except in the floodplain of the Mississippi River, and include both large (arbitrarily defined as those >100 ha; 25% of reservoirs) and small (4–100 ha; 75% of reservoirs). The Mississippi Department of Wildlife, Fisheries, and Parks (MDWFP) oversees more than 270 public lakes >4 ha encompassing more than 120,000 ha ().
Figure 1. Geographic distribution of Mississippi lakes relative to lake origin (natural or artificial) and size (smaller or larger than 100 ha, but see more precise definition in text). Only lakes ≥4 ha accessible to the public and monitored by MDWFP are shown.
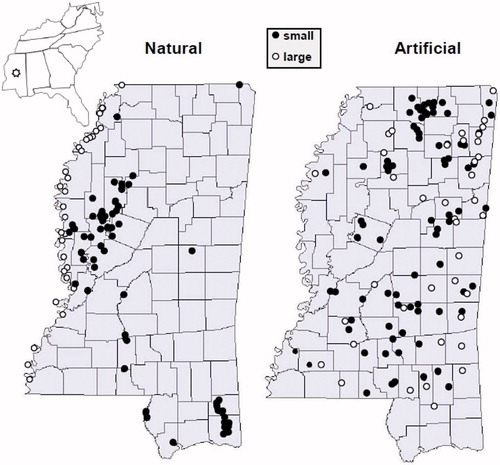
Table 1. Number and area of lakes overseen by the Mississippi Department of Wildlife, Fisheries and Parks, partitioned according to segments.
Databases
To assess MDWFP's lake segmentation, we used a 30 yr database compiled by MDWFP, supplemented with an external database facilitated by the Mississippi Department of Environmental Quality (MDEQ). Segmentation consisted of large (Mississippi River) and small (all other rivers) natural lakes, and large (>100 ha) and small (4–100 ha) artificial lakes. Five sets of metrics were considered to assess the lake segmentation including metrics descriptive of nutrients, fish assemblage composition, angler catch, fishery characteristics, and fishery management objectives. The databases included several years of data for most lakes, and some lakes were sampled annually or nearly so because of their prominence as state water resources. Interannual differences within lakes occur and are caused by natural environmental fluctuations, by shifts in attitudes of resource users, and by periodic management actions such as stocking and harvest regulations (Miranda et al. Citation2017a). These temporal shifts and management actions obscured dissimilarities among lakes and hindered recognition of distinctions but were not investigated.
Our analyses included 20–40% of Mississippi lakes, depending on the specific set of metrics. The nutrients set included 86 lakes (). Each lake was sampled more than once, an average of 3.5 yr, ranging from 2 to 9 yr. The fish assemblage composition set included 104 lakes. Each lake included an average 8.2 collections (defined below), ranging from 4 to 30 collections. The number of samples taken per electrofishing collection averaged 9.3 and varied from 3 to 38. The angler catch and fishery characteristics sets included 58 lakes. Each lake was surveyed an average 6.9 seasons, ranging from 2 to 17 seasons. The number of parties interviewed per season averaged 127.8 and varied from 12 to 800. The fishery management objectives set represented 79 lakes. Across metrics sets, 59% of the lakes were represented in all 5 sets.
Table 2. Metrics descriptive of nutrients, fish assemblage composition, angler catch, fishery characteristics, and management objectives applied to assess the lake segmentation.
Nutrients
Nutrients and associated metrics () were surveyed by the MDEQ during statewide monitoring conducted in 2001–2009 following guidelines provided by USEPA (1997) and summarized by MDEQ (2010). Water samples were collected within 1 m below the surface near the deepest point in each lake. Many of the deeper lakes (e.g., large oxbows and large reservoirs) stratify vertically, but the extent of stratification can vary among years. Only data collected in either June or July were included in this analysis; this period represents the warmest and driest in the state, insulating lakes from large runoff events, and resulting in intense algal production and occasional extreme water quality conditions. Metrics descriptive of essential nutrients, metrics that are affected by nutrients, and metrics that influence the effects of nutrients were considered ().
Fish assemblage composition
The MDWFP has conducted standardized electrofishing surveys in fall since 1986 following methods described in Miranda (Citation2005) and Miranda and Boxrucker (Citation2009). There have been changes in electrofishing equipment and personnel, but electrofishing protocols and sampling design have remained consistent. A collection consisted of multiple samples lasting 0.08–0.62 h each taken within a 1–2 week period mostly along shorelines of lakes at sites selected at random (simple and stratified random sampling designs were applied). Because of MDWFP’s Fisheries Division focus on gamefish management, collections were limited to species of the families Centrarchidae, Ictaluridae, and Moronidae. Fish collected were identified to species level and counted to estimate relative abundance in terms of catch per hour of electrofishing effort.
Angler catch and fishery characteristics metrics
Access creel surveys to sample complete fishing trips were implemented following methodology in Miranda (Citation2005). Surveys are conducted during 3 consecutive spring months (Mar–May or Apr–Jun) when fishing effort in Mississippi lakes is normally highest. Surveys last 4–6 h during sample days selected at random within the sample months, or at random from week and weekend day strata. Data collected included fishing effort (hours fished × number in party), taxa targeted, aggregate weight harvested, number harvested, and number of fish released according to major taxa groups. The number of fish released was an estimate made by the party when solicited by the creel clerk. Species composition in the catch was expressed as percentages, and various metrics descriptive of the fisheries were estimated (). All lakes included in the study are open to fishing by the public. Many lakes were stocked with one or more species, often multiple times over the 30 yr study period, and were managed with creel limits, length limits, or both. Any effect of these management activities could not be parceled out and is part of the observed variability.
Fishery management objectives
The MDWFP uses results from fish assemblage and angler monitoring programs, along with informal onsite surveys of fish habitat and facilities, to develop lake-specific management plans. Management plans establish long-term management direction, including a vision and a protocol for the management of a lake. The plan identifies management objectives and actions implemented to achieve these objectives. Objectives usually address identified problems and impairments associated with fish assemblages, fish habitat, facilities, and the angling public. We reviewed lake management plans to construct a lake-by-objective matrix. This matrix summarized each objective as present (1) or absent (0) on a by-lake basis. The average of the 0/1 values according to objective represented the proportion of lakes where the objective was applied.
Data analyses
We focused our analyses on testing the null hypothesis of no differences in multivariate location among lake segments. This hypothesis was tested with a permutation multivariate analysis of variance (perMANOVA). The perMANOVA is a distance-based procedure analogous to conventional parametric multivariate analysis of variance but does not make assumptions about data distribution, although it does assume independence of samples and homogeneity of dispersion among variables (Anderson Citation2001). The perMANOVA tested if the centroids (i.e., multivariate mean) differed among lake segments. Separate analyses were applied to each of the 5 sets of metrics.
If the perMANOVA detected differences among lake segments, further analyses were conducted to evaluate (1) which segments differed, (2) which metrics discriminated best among segments, and (3) what percentage of the lakes were correctly allocated to each segment by the discriminating metrics (a goodness-of-fit diagnostic; Anderson et al. Citation2008). To identify which segments differed we conducted pairwise perMANOVA comparisons among segments. To identify which metrics discriminated among segments we applied a canonical analysis of principal coordinates (CAP; Anderson and Willis Citation2003). CAP is an ordination procedure suitable for identifying axes through a multivariate cloud that best separate among a priori groups (e.g., the segments). Once CAP axes were identified, Spearman rank correlations between metrics and CAP axes scores suggested metrics that discriminated among segments.
The perMANOVA and CAP were applied to similarity matrices constructed for each of the 5 sets of metrics. The Bray–Curtis distance coefficient was applied to the fish assemblage composition and the angler catch sets, the Euclidean distance coefficient was applied to the nutrients and the fishery characteristics sets, and the Jaccard distance coefficient to the presence/absence fishery management objectives set. Prior to computation of distance coefficients, all catch rates in the fish assemblage set were log(x + 1) transformed to reduce skewness, thereby satisfying the assumption of homogeneity of dispersion; all percentages in the angler catch and fishery characteristics sets were square-root transformed; and selected metrics were log(x + 1) transformed in the nutrients set prior to normalizing all metrics by z-scores. Analyses were conducted with the PERMANOVA + add-on package for PRIMER version 7 (Anderson et al. Citation2008, Clarke and Gorley Citation2015). All tests relied on 999 permutations to assess statistical significance with a pseudo-F test and P ≤ 0.05.
Results and discussion
Nutrients
Differences in nutrient levels among lake segments were evident (pseudo-F = 14.8; P < 0.01). Pairwise tests indicated that differences between small and large artificial lakes were not statistically significant (P > 0.05), but that artificial lakes differed from natural lakes, and that small and large natural lakes had statistically different nutrient levels.
The CAP ordination correctly classified 70.2% of the lakes. Axis 1 separated artificial lakes from natural lakes (). Natural lakes typically had higher nutrient levels than artificial lakes including total nitrogen and total phosphorus leading to higher biological production as suggested by elevated levels of chlorophyll a, total organic carbon, and chemical oxygen demand. An exception was levels of total inorganic nitrogen, which were high in some artificial lakes and similar to levels measured in large natural lakes. Increased aquatic production contributed to high total suspended solids and reduced Secchi transparency in natural lakes.
Figure 2. Ordination of nutrients and associated metrics recorded in Mississippi lakes relative to lake origin and size. The filled symbols represent lakes, and the vectors identify the direction of correlations of a metric relative to axes 1 and 2; vector length identifies the relative strength of correlations. Only metrics with Spearman’s rank correlation ≥0.3 are shown.
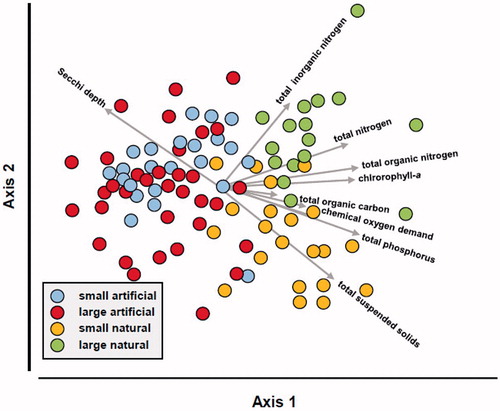
Axis 2 separated between sizes of natural lakes (). Overall large natural lakes had higher nitrogen levels, chlorophyll a, and Secchi transparency than small natural lakes, but similar levels of total phosphorus, total organic carbon, and chemical oxygen demand. Small natural lakes had high levels of total suspended solids. Most of the small natural lakes included in this analysis occur within the Yazoo River Basin, a region with extensive agricultural runoff. These lakes are also shallow, facilitating turbidity originated by the stirring of sediment via wave action and fish feeding (Breukelaar et al. Citation1994). These silt-derived suspended solids can, in turn, limit algal production below potential.
High levels of total inorganic nitrogen was an attribute shared by large natural lakes, many small artificial lakes, and some large artificial lakes (upper half of ). We suspect the high levels on the large natural lakes originate from residues of agricultural fertilizers transported by the Mississippi River for lakes within the mainstem levees (Meade Citation1995) or local agriculture in the Mississippi Alluvial Valley for lakes outside the levees. A similar effect has been reported in oxbow lakes adjacent to the Missouri River, with reduced connectivity accompanied by rapid loss of dissolved N and P fractions (Knowlton and Jones Citation1997). Conversely, elevated levels in small artificial lakes likely reflect periodic fertilizer applications made directly to the lake as part of nutrient enrichment programs (Reeves and Harders Citation1983). Close inspection of the ordination revealed that the large artificial lakes with elevated total inorganic nitrogen represent reservoirs not much larger than 100 ha with existing nutrient enrichment programs or forestry/agricultural operations in their watersheds.
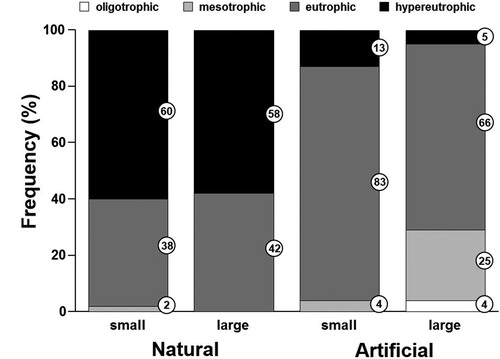
Total phosphorus, total nitrogen, and chlorophyll a have been used to assign trophic status to lakes and reservoirs. According to limits identified by Jones et al. (Citation2008) for these 3 metrics, oligotrophic lakes are rare in Mississippi (). Most artificial lakes are eutrophic. Natural lakes are more evenly split between eutrophic and hypereutrophic, but most were hypereutrophic in our study area and also upstream in the Missouri River (Knowlton and Jones Citation1997).
Figure 3. Percentage distribution of Mississippi lakes relative to trophic state (Jones and Knowlton Citation1993) and according to lake origin and size.
Fish assemblage composition
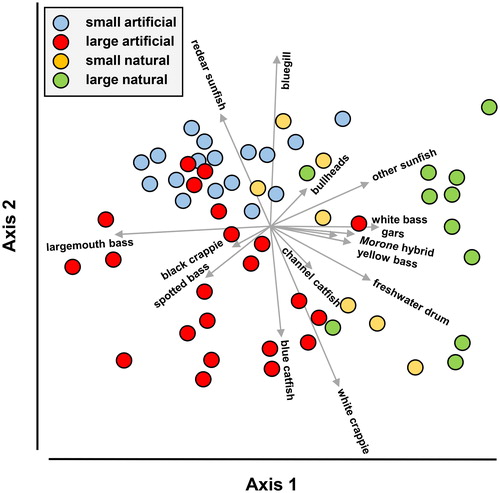
Eleven of the species targeted by MDWFP during electrofishing surveys were included in analyses (). Other species were collected but in low densities including 3 species of Ameiurus, Ictalurus furcatus, and 3 species of Lepomis. Of those included in the analysis, bluegill (Lepomis macrochirus; 48%), largemouth bass (Micropterus salmoides; 34%), and redear sunfish (L. microlophus; 5%) were the most abundant. The perMANOVA indicated fish assemblages differed among lake segments (pseudo-F = 10.8; P < 0.01). Pairwise tests further indicated that all 4 lake segments differed (P < 0.05).
The CAP ordination correctly classified 70.6% of the lakes. Axis 1 represented a gradient from small artificial lakes, to large artificial lakes, to natural lakes; axis 2 further separated natural lakes (). The ordination illustrated a large overlap in fish assemblages among lake segments, with large artificial lakes taking a central position in the ordination. This centrality in ordination space suggests a diversity of large reservoirs, some with fish assemblages similar to small reservoirs, many to small oxbow lakes, and a few to large oxbow lakes.
Figure 4. Ordination of fish assemblages recorded in Mississippi lakes relative to lake origin and size. The filled symbols represent lakes, and the vectors identify the direction of correlations of a fish taxon relative to axes 1 and 2; vector length identifies the relative strength of correlations. Only metrics with Spearman’s rank correlation ≥0.3 are shown. MDWFP’s monitoring program focuses on the families Centrarchidae, Ictaluridae, and Moronidae.
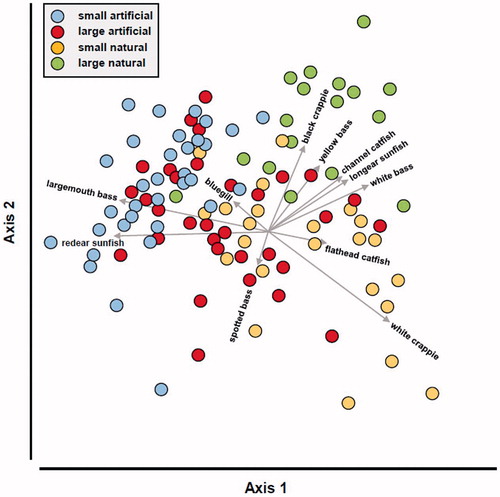
The ordination also illustrated differences in fish assemblages. Catch rates of redear sunfish and largemouth bass were highest in artificial lakes and lowest in natural lakes. Channel catfish (Ictalurus punctatus), white bass (Morone chrysops), yellow bass (M. mississipiensis), longear sunfish (L. megalotis), and black crappie (Pomoxis nigromaculatus) were all collected in higher numbers in large natural lakes. White crappie (P. annularis) was most abundant in small natural lakes. Flathead catfish (Pylodictis olivaris), bluegill, and spotted bass (Micropterus punctulatus) did not show strong differences among lake segments although flathead catfish tended to be more abundant in natural lakes than in artificial lakes, bluegill tended to be more abundant in small natural or small artificial lakes and least abundant in large natural lakes, and spotted bass tended to be more abundant in large artificial lakes. White bass and spotted bass were not collected in small artificial lakes.
Taxa distribution over the lake segmentation reflected a blend of biogeography and agency stocking programs interacting with local environmental factors. Largemouth bass, bluegill, and redear sunfish are commonly stocked by MDWFP in small artificial lakes; stocking is likely to have a stronger influence in these fish communities because the lakes are small. Largemouth bass are also stocked in large artificial lakes, but the influence of stocking is likely diminished in large water bodies. Taxa associated with natural lakes included more floodplain species that benefit from connectivity to large rivers, such as catfishes, temperate basses, and floodplain centrarchids including crappies. White crappie tend to be more abundant in small natural lakes and black crappie in large ones, likely due to differences in turbidity and sediment, which are higher in small natural lakes partially due to shallower depths and proximity to agriculture (Miranda and Lucas Citation2004, Jackson et al. Citation2010). Large artificial lakes impound a broad diversity of stream orders as these lakes span in area from just over 100 ha to about 15,000 ha. Therefore, they exhibited a large diversity of fish assemblages ranging from those dominated by centrarchids such as in small artificial lakes, to those including taxa typically associated with large rivers.
Angler catch
Overall 42 taxa were recorded in creel surveys; the most abundant 15 taxa () represented 98.8% of the catch. Of these top 15 taxa all were detected in large natural and artificial lakes, 14 in small natural lakes, and 8 in small artificial lakes. The most common taxa in the catch were bluegill, largemouth bass, and white crappie, but the catch composition differed among lake segments (pseudo-F = 6.7; P < 0.01). Pairwise tests indicated that all lake segments differed (P < 0.05).
The CAP ordination correctly classified 74.9% of the lakes. Axis 1 represented a gradient from artificial lakes, to small natural lakes, to large natural lakes; axis 2 further separated artificial lakes. Small reservoirs tended to include higher percentages of bluegill and redear sunfish in the angler catch than large reservoirs, whereas large reservoirs tended to include higher percentages of white crappie than small reservoirs (). Bluegill and white crappie were also well represented in natural lakes, but representation varied greatly as suggested by the broad dispersal of natural lakes over axis 2. Catch of blue catfish (I. furcatus) also separated artificial lakes, as they were represented in the catch in large reservoirs but not in small ones. Largemouth bass were more common in the angler catch in artificial lakes than natural lakes and spotted bass were caught mostly in large artificial lakes. White bass, yellow bass, striped bass hybrids (primarily Morone chrysops × M. saxatilis), channel catfish, gars (Lepisosteus spp.), and freshwater drum (Aplodinotus grunniens) were represented in the angler catch mostly in natural lakes.
Figure 5. Ordination of angler catches recorded in Mississippi lakes relative to lake origin and size. The filled symbols represent lakes, and the vectors identify the direction of correlations of a fish taxa relative to axes 1 and 2; vector length identifies the relative strength of correlations. Only metrics with Spearman’s rank correlation ≥0.3 are shown.
The angler catch reflected the fish assemblage composition as characterized by the electrofishing surveys. Both data sets identified largemouth bass, redear sunfish, and bluegill as dominant in assemblages of artificial lakes, and all 3 species as dominant in the fisheries of small artificial lakes, but only largemouth bass in large reservoirs. In general, largemouth bass in small artificial lakes tend to be smaller than in large reservoirs, whereas bluegill and redear sunfish tend to be larger in small reservoirs (Olive et al. Citation2005, Haley et al. Citation2012). This difference seems to be due to (1) the effect of nutrient enrichment on bluegill and redear sunfish growth, (2) intense predation by abundant populations of largemouth bass that include proportionately more small individuals, (3) reduced competition with other invertivores (e.g., Dorosoma spp.), or (4) a combination of these. Electrofishing indicated that white crappies were exceptionally abundant in some small natural lakes, but consistently these crappies were juveniles as these small shallow lakes often serve as nursery waters. The white crappies of sufficient size to support fisheries, while abundant in many natural lakes, were more common in large artificial lakes. In the natural lakes, representation of temperate basses in the angler catch paralleled representation in electrofishing surveys, but other species were also represented in the angler catch such as gars and freshwater drum, which are not targeted in electrofishing surveys.
Fishery characteristics
The fishery characteristics defined with trip elements, target taxa, and angling catch attributes suggested various defining properties across lake segments (). The perMANOVA indicated the 13 metrics descriptive of fishery characteristics differed among lake segments (pseudo-F = 5.4; P < 0.01). Pairwise tests confirmed that all lake segments differed (P < 0.05).
The CAP ordination correctly classified 89.6% of the lakes. Axis 1 separated artificial from natural lakes, and axis 2 small from large lakes (). Relative to axis 1, proportionally more anglers fishing artificial lakes were successful in landing their target taxa, caught and released fish, and targeted black bass, particularly in large reservoirs. Conversely, proportionally more anglers fishing natural lakes targeted temperate bass and crappie, and experienced a broader mixture of taxa in their catch. Relative to axis 2, in large lakes party sizes tended to be bigger, trip lengths longer, and proportionally more anglers used boats than in small lakes. Also, proportionally more anglers targeted sunfish in small lakes than large ones, but relatively more anglers targeted catfish in large lakes than small ones. Fishing success was similar across all lake segments () and therefore not represented in the ordination ().
Figure 6. Ordination of fishery characteristics recorded in Mississippi lakes relative to lake origin and size. The filled symbols represent lakes, and the vectors identify the direction of correlations of a fishery metric relative to axes 1 and 2; vector length identifies the relative strength of correlations. Only metrics with Spearman’s rank correlation ≥0.3 are shown.
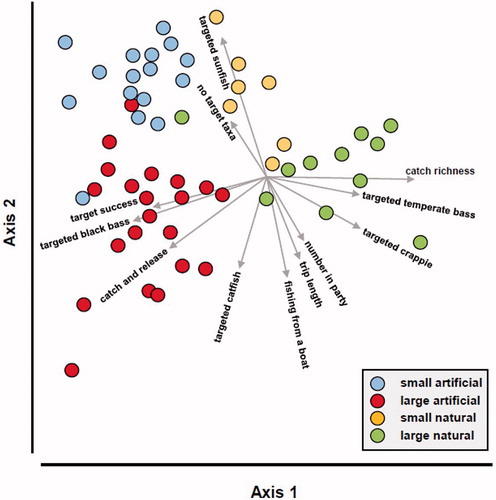
Thus, lake segments provided different fishing experiences that likely attracted different sectors of the fishing public. These experiences might be attributed to the different abiotic and biotic characteristics of these lake segments. However, differences in management actions applied to reach fishery management objectives may also play a role. For example, the higher catch and release rates observed in large artificial lakes may be attributed to a greater emphasis on harvest regulations in these larger water bodies where environmental management is less feasible, rather than a major shift in angler harvesting ethics.
Fishery management objectives
In all, 19 management objectives were commonly identified in management plans (). The 3 most frequently cited over all segments were to achieve established electrofishing targets for fish densities and/or size structures (87% of plans), to achieve creel target catch rates and/or average weight (71%), and to maintain or increase angler visitation (51%). The perMANOVA indicated fishery management objectives differed among lake segments (pseudo-F = 3.9; P < 0.01). Pairwise tests showed that objectives were different between small and large artificial lakes and between artificial lakes and natural lakes (P < 0.05). However, objectives were not different between small and large natural lakes (P > 0.05).
The CAP ordination correctly classified 74.4% of the lakes. Axis 1 separated small artificial lakes from other lakes, while axis 2 separated large artificial lakes from natural lakes (). Enhancement of nutrient levels and installation of underwater structures were associated with small artificial lakes. Application of fertilizers to maintain turbidity through plankton blooms, as well as prevent macrophyte growth, is an established management practice in small artificial lakes (Neal and Willis Citation2012). Installation of underwater structures is a common practice in all artificial lakes, particularly in small ones where it is feasible to install enough structures. The management objectives that distinguish small artificial lakes are not feasible in large artificial lakes because the large lakes are not controlled by MDWFP or the programs are not scalable to larger lakes. Instead, objectives such as controlling turbidity and sedimentation, maintaining access to backwaters and wetlands, and improving riparian zones are more prevalent in large artificial lakes. Problems associated with turbidity, sedimentation, and the riparian zone are linked directly to scale, which increases exponentially with size of the watershed, discharges, fetch, and related issues. Emphasis on stocked taxa is often promoted in artificial lakes, whether small or large, to diversify typically low-diversity fisheries.
Figure 7. Ordination of management objectives recorded in Mississippi lakes relative to lake origin and size. The filled symbols represent lakes, and the vectors identify the direction of correlations of objectives relative to axes 1 and 2; vector length identifies the relative strength of correlations. Only metrics with Spearman’s rank correlation ≥0.3 are shown.
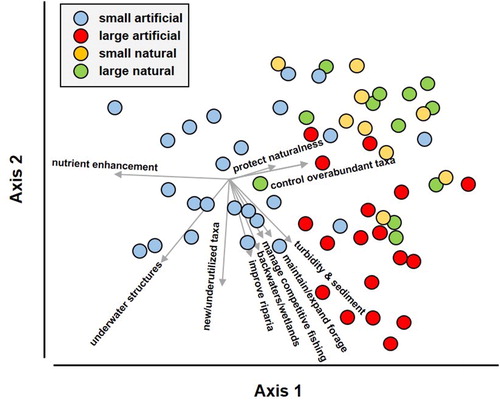
While many management objectives for natural lakes overlap with those of artificial lakes, they do differ in some aspects. Natural lakes have a greater emphasis on controlling undesirable or overabundant species (e.g., Asian carp Hypophthalmichthys spp., buffalo Ictiobus spp., gar) and maintaining lake naturalness. Overabundant species were also a focus on some large reservoirs but usually associated with excessive forage species (e.g., gizzard shad Dorosoma cepedianum). Surprisingly, improving water quality and controlling nutrient inputs from agricultural watersheds to already hypereutrophic systems were not a big focus of natural lake management. Nutrients and turbidity in these lakes are often excessive. There may be a sense of uncontrollability because of the large scale of the problem.
The effect of lake size
Although lakes were segmented according to size, size of the lake may not directly control the effects observed. Size is a convenient metric for segmentation because it is readily observed and understood by users. However, the segmentation may be better linked to other variables indexed by lake size. For example, in the study region, the size of natural lakes is highly correlated with depth, as small lakes originated from shallower river channels and filled in with sediment faster (Miranda and Lucas Citation2004). Depth is a causal factor that drives many physicochemical variables that contribute to organizing fish assemblages in lakes (Miranda Citation2011, Miranda et al. Citation2017b). Large artificial lakes are also deeper, but additionally tend to impound higher-order streams and are thus influenced by factors such as larger watersheds, shorter retention period, and fish assemblages that include more large-river species.
Thinking segment-wise
Segmentation of lakes brings into focus a new level of concepts about lake resource management not typically relevant when considering lakes individually. For example, questions about lake quantities, lake similarities, and lake distributions are irrelevant at the single-lake scale but emerge at the lake-segment scale. Also, thinking of lakes as parts of a segment can generate management insight not evident when considering them as single entities. For example, if actions are successful in achieving management objectives in a single system, they may generalize to lakes within the segment. Alternatively, management actions that are implemented in one lake may cause shifts in angler use that could influence nearby lakes (Lester et al. Citation2003), also requiring segment-wise attention.
Presently, lake management decisions are made mostly on a case-by-case basis and outcomes are assumed independent of management in other lakes. A lake segmentation represents the conceptual framework needed for considering lakes as pieces of a larger and interactive management system. Lakes within segments provide the potential to use spatial replication to learn about system response by implementing management actions and monitoring to develop adaptive management programs.
Lake management implications
Lake segmentation can be particularly useful to lake managers by informing about the diversity of resources, their users, and alternative management options. This is especially pertinent in regions with abundant and diverse water bodies that offer a variety of recreational opportunities (Lester et al. Citation2003). Understanding the attributes of segments and their users could give managers greater insight into the experiences sought (Fisher Citation1997), suggest how to avoid potential conflicts among user groups with different orientations or preferences (Connelly et al. Citation2000), and serve as the foundation for practical management plans. No single management plan is likely to be directly applicable to an entire segment, but blanket segment plans can be adopted to target many of the needs of a particular segment and facilitate decision-making by field managers. For example, the large-natural and the small-artificial segments provide vast contrasts to be considered in planning, including nutrients and associated water quality and fish production issues; fish assemblage richness, composition, and managerial control over assemblages with different levels of connectivity to large rivers; and a different profile of users seeking a more natural experience in one segment compared to a more controlled experience in the other. Both of these segments include many lakes not easily accessible to managers because they are either in, or surrounded by, private lands, they are managed by federal or local government agencies, or are simply too remote to monitor and manage. Segmentation enables shaping management policy even when the lakes are not directly controlled by the agency.
Acknowledgments
We thank the many MDWFP fisheries biologists and technicians who through the years collected the data used in our study. Water quality data was collected by the Mississippi Department of Environmental Quality and facilitated by Doug Upton. Constructive reviews were provided by C. Aldridge and J. Koch. Any use of trade, firm, or product names is for descriptive purposes only and does not imply endorsement by the U.S. Government.
Additional information
Funding
References
- Anderson MJ. 2001. A new method for non-parametric multivariate analysis of variance. Austral Ecol. 26:32–46.
- Anderson MJ, Willis TJ. 2003. Canonical analysis of principal coordinates: a useful method of constrained ordination for ecology. Ecology. 84:511–525. doi: 10.1890/0012-9658(2003)084%5b0511:CAOPCA%5d2.0.CO;2.
- Anderson MJ, Gorley RN, Clarke KR. 2008. PERMANOVA + for PRIMER: guide to software and statistical methods. Plymouth (UK): PRIMER-E.
- Breukelaar A, Lammens E, Klein Breteler JGP, Tatrai I. 1994. Effects of benthivorous bream (Abramis brama) and carp (Cyprinus carpio) on sediment resuspension and concentrations of nutrients and Chlorophyll a. Freshw Biol. 32:112–121. doi: 10.1111/j.1365-2427.1994.tb00871.x.
- Canfield DE, Bachman RW. 1981. Prediction of total phosphorus concentrations, Chlorophyll a, and Secchi depths in natural and artificial lakes. Can J Fish Aquat Sci. 38:414–423. doi: 10.1139/f81-058.
- Clarke KR, Gorley RN. 2015. PRIMER v7: user manual/tutorial. Plymouth (UK): PRIMER-E.
- Connelly NA, Brown TL, Knuth BA. 2000. A multiple market segmentation of Great Lakes anglers in New York. N Am J Fish Manage. 20:399–407. doi: 10.1577/1548-8675(2000)020%3c0399:AMMSOG%3e2.3.CO;2.
- Dolman WB. 1990. Classification of Texas reservoirs in relation to limnology and fish community associations. Trans Am Fish Soc. 119:511–520. doi: 10.1577/1548-8659(1990)119%3c0511:COTRIR%3e2.3.CO;2.
- Downing JA, Prairie YT, Cole JJ, Duarte CM, Tranvik LJ, Striegl RG, McDowell WH, Kortelainen P, Caraco NF, Melack JM, et al. 2006. The global abundance and size distribution of lakes, ponds, and impoundments. Limnol Oceanogr. 51:2388–2397. doi: 10.4319/lo.2006.51.5.2388.
- Duarte R, Azevedo M, Afonso-Dias M. 2009. Segmentation and fishery characteristics of the mixed-species multi-gear Portuguese fleet. ICES J Mar Sci. 66:594–606. doi: 10.1093/icesjms/fsp019.
- Emmons EE, Jennings MJ, Edwards C. 1999. An alternative classification of northern Wisconsin lakes. Can J Fish Aquat Sci. 56:661–669. doi: 10.1139/f99-008.
- Fieseler C, Wolter C. 2006. A fish-based typology of small temperate rivers in the northeastern lowlands of Germany. Limnologica. 36:2–16. doi: 10.1016/j.limno.2005.10.001.
- Fisher MR. 1997. Segmentation of the angler population by catch preference, participation, and experience: a management-oriented application of recreation specialization. N Am J Fish Manage. 17:1–10. doi: 10.1577/1548-8675(1997)017%3c0001:SOTAPB%3e2.3.CO;2.
- Frissell CA, Liss WJ, Warren CE, Hurley MD. 1986. A hierarchical framework for stream habitat classification: viewing streams in a watershed context. Environ Manage. 10:199–214. doi: 10.1007/BF01867358.
- Gassner H, Wanzenbock J, Zick D, Tischler G, Pamminger-Lahnsteiner B. 2005. Development of a fish based lake typology for natural Austrian lakes >50 ha based on the reconstructed historical fish communities. Int Rev Hydrobiol. 90:422–432. doi: 10.1002/iroh.200510798.
- Haley NV, Wright RA, DeVries DR, Allen MS. 2012. Privately owned small impoundments in central Alabama: a survey and evaluation of management techniques for largemouth bass and bluegill. N Am J Fish Manage. 32:1180–1190. doi: 10.1080/02755947.2012.720643.
- Jackson ZJ, Quist MC, Downing JA, Larscheid JG. 2010. Common carp (Cyprinus carpio), sport fishes, and water quality: ecological thresholds in agriculturally eutrophic lakes. Lake Reserv Manage. 26:14–22. doi: 10.1080/07438140903500586.
- Jones JR, Knowlton MF. 1993. Limnology of Missouri reservoirs: an analysis of regional patterns. Lake Reserv Manage. 8:17–30. doi: 10.1080/07438149309354455.
- Jones JR, Obrecht DV, Perkins BD, Knowlton MF, Thorpe AP, Shohei Watanabe S, Bacon RR. 2008. Nutrients, seston, and transparency of Missouri reservoirs and oxbow lakes: an analysis of regional limnology. Lake Reserv Manage. 24:155–180. doi: 10.1080/07438140809354058.
- Knowlton MF, Jones JR. 1997. Trophic status of Missouri River floodplain lakes in relation to basin type and connectivity. Wetlands. 17:468–475. doi: 10.1007/BF03161512.
- Krogman RM, Miranda LE. 2015. A classification system for large reservoirs of the contiguous United States. Environ Monit Assess. 187:174. doi: 10.1007/s10661-014-4244-1.
- Lehner B, Döll P. 2004. Development and validation of a global database of lakes, reservoirs and wetlands. J Hydrol. 296:1–22. doi: 10.1016/j.jhydrol.2004.03.028.
- Lester NP, Marshall TR, Armstrong K, Dunlop WI, Ritchie B. 2003. A broad-scale approach to management of Ontario’s recreational fisheries. N Am J Fish Manage. 23:1312–1328. doi: 10.1577/M01-230AM.
- Lyons J, Zorn T, Stewart J, Seelbach P, Wehrly K, Wang L. 2009. Defining and characterizing coolwater streams and their fish assemblages in Michigan and Wisconsin, USA. N Am J Fish Manage. 29:1130–1151. doi: 10.1577/M08-118.1.
- McDonald CP, Rover JA, Stets EG, Striegl RG. 2012. The regional abundance and size distribution of lakes and reservoirs in the United States and implications for estimates of the global lake extent. Limnol Oceanogr. 57:597–606. doi: 10.4319/lo.2012.57.2.0597.
- [MDEQ] Mississippi Department of Environmental Quality. 2010. State of Mississippi water quality assessment 2010 Section 305(b) report. Jackson (MS): Mississippi Department of Environmental Quality.
- [MDWC] Mississippi Department of Wildlife Conservation. 1986. Guidelines for standardized lake and reservoir surveys. Jackson (MS): Mississippi Department of Wildlife Conservation.
- Meade RH, editor. 1995. Contaminants in the Mississippi River. Reston (VA): US Geological Survey, Circular 1133.
- Miranda LE. 1999. A typology of fisheries in large reservoirs of the United States. N Am J Fish Manage. 19:536–550. doi: 10.1577/1548-8675(1999)019%3c0536:ATOFIL%3e2.0.CO;2.
- Miranda LE. 2005. Monitoring protocols for inland fisheries. Jackson (MS): Mississippi Department of Wildlife, Fisheries and Parks, Freshwater Fisheries Report Number 244.
- Miranda LE. 2011. Depth as an organizer of fish assemblages in floodplain lakes. Aquat Sci. 73:211–221. doi: 10.1007/s00027-010-0170-7.
- Miranda LE. 2016. Fishes in paleochannels of the lower Mississippi River alluvial valley: a national treasure. Fisheries. 41:578–588. doi: 10.1080/03632415.2016.1219949.
- Miranda LE, Boxrucker J. 2009. Warmwater fish in large standing waters. In: Bonar SA, Hubert WA, Willis DW, editors. Standard methods for sampling North American freshwater fishes. Bethesda (MD): American Fisheries Society. p. 29–42.
- Miranda LE, Colvin ME, Shamaskin AC, Bull LA, Holman T, Jones R. 2017a. Length-limits fail to restructure a largemouth bass population: a 28-year case history. N Am J Fish Manage. 27:624–632. doi: 10.1080/02755947.2017.1308891.
- Miranda LE, Lucas GM. 2004. Determinism in fish assemblages of floodplain lakes of the vastly disturbed Mississippi Alluvial Valley. Trans Am Fish Soc. 133:358–370. doi: 10.1577/03-060.
- Miranda LE, Omer AR, Killgore KJ. 2017b. Balancing lake ecological condition and agriculture irrigation needs in the Mississippi Alluvial Valley. Agr Ecosys Environ. 246:354–360. doi: 10.1016/j.agee.2017.06.022.
- Modde T, Ford RC, Parsons MG. 1991. Use of a habitat-based stream classification system for categorizing trout biomass. N Am J Fish Manage. 11:305–311. doi: 10.1577/1548-8675(1991)011%3c0305:UOAHBS%3e2.3.CO;2.
- Neal JW, Willis DW, editors. 2012. Small impoundment management in North America. Bethesda (MD): American Fisheries Society.
- Olive JA, Miranda LE, Hubbard WD. 2005. Centrarchid assemblages in Mississippi state-operated fishing lakes. N Am J Fish Manage. 25:7–16. doi: 10.1577/M03-135.1.
- Peck DV, Olsen AR, Weber MH, Paulsen SG, Pederson CL, Holdsworth SM. 2013. Survey design and extent estimates for the National Lakes Assessment. Freshw Sci. 32:1231–1245. doi: 10.1899/11-075.1.
- Reeves WC, Harders FR. 1983. Liquid fertilization of public fishing lakes in Alabama. Proc Annu Conf Southeast Assoc Fish Wildl. Agencies. 37:371–375.
- Rosgen DL. 1994. A classification of natural rivers. Catena. 22:169–199. doi: 10.1016/0341-8162(94)90001-9.
- Ross ST. 2001. Inland fishes of Mississippi. Jackson (MS): University Press of Mississippi.
- Saucier RT. 1994. Geomorphology and quaternary geologic history of the Lower Mississippi Valley, volumes 1 and 2. Vicksburg (MS): USACE, Mississippi River Commission.
- Soranno PA, Cheruvelil KS, Webster KE, Bremigan MT, Wagner T, Stow CA. 2010. Using landscape limnology to classify freshwater ecosystems for multi-ecosystem management and conservation. BioScience. 60:440–454. doi: 10.1525/bio.2010.60.6.8.
- Strahler AN. 1952. Hypsometric (area-altitude) analysis of erosional topology. Geol Soc Am Bull. 63:1117–1142. doi: 10.1130/0016-7606(1952)63%5b1117:HAAOET%5d2.0.CO;2.
- Tonn WM, Magnuson JJ. 1982. Patterns in the species composition and richness of fish assemblages in northern Wisconsin lakes. Ecology. 63:1149–1166. doi: 10.2307/1937251.
- [USEPA] US Environmental Protection Agency. 1997. Guidelines for preparation of the comprehensive state water quality assessments (305(b) reports) and electronic updates: report contents. Washington (DC): Office of Water, EPA-841-B-97-0002░A.