
 ?Mathematical formulae have been encoded as MathML and are displayed in this HTML version using MathJax in order to improve their display. Uncheck the box to turn MathJax off. This feature requires Javascript. Click on a formula to zoom.
Abstract
Waajen, G, Lürling M, van de Sande R. The unfulfilled promise of urban Lake Kleine Melanen (The Netherlands): diagnostics, experiment on reduction of sediment P-release and in-lake restoration. Lake Reserv Manage. 35:8–24.
Lake Kleine Melanen (The Netherlands) experienced cyanobacterial blooms during the summertime, causing public health risks, turbid water, and lack of macrophytes. To improve the situation, we determined the underlying causes of the poor water quality. Our diagnosis included the water and phosphorus (P) budget of the lake and showed the need for the reduction of both the external and internal P loads. The external P load (7.5 mg P/m2/d) exceeded the transition between the clear water state and the turbid state by 44–121%, mainly due to the discharges from the separated stormwater sewer system in the adjacent neighborhood. Due to political and financial considerations of the managing authorities, the restoration (2010–2012) was restricted to internal management. To reduce the high internal P load (3.8 mg P/m2/d), we tested 3 sediment capping options in an enclosure experiment, showing the best results when we combined sand capping with the P fixative Phoslock® and flocculant polyaluminumchloride. A 0.6–1.3 m thick layer of soft sediment was dredged from the lake. Thereafter, the sediment was capped with a 0.2 m thick layer of sand to which Phoslock® was added. Additional in-lake measures including fish removal and shoreline reconstruction were also conducted to support improvement. We compared water quality before (2008–2010) and after (2012–2014) interventions. Although the mean concentration of total P was reduced from 0.30 to 0.11 mg P/L, and cyanobacterial chlorophyll a from 52 to 6 μg/L, cyanobacterial blooms still occurred. For further water quality improvement, the reduction of the external P load caused by stormwater runoff is required.
Small lakes (<10 ha) are common features in urban areas and they provide societal services such as microclimate regulation, rainwater drainage, recreation, cultural values, and biodiversity (Bolund and Hunhammar Citation1999, Hellström et al. Citation2000, Gledhill et al. Citation2008). However, small urban lakes are often strongly influenced by eutrophication (Brönmark and Hansson Citation2002), causing high levels of phytoplankton biomass and nuisance cyanobacteria (Schindler et al. Citation2008).
Phosphorus (P) and nitrogen (N) are both key nutrients in the eutrophication of lakes (Conley et al. Citation2009). For the restoration of eutrophic lakes, reduction of the external nutrient input is essential (Cooke et al. Citation2005) and P is the nutrient that can most easily limit cyanobacterial growth (Golterman Citation1975, Carpenter Citation2008, Schindler et al. Citation2008). Knowledge of the P loads and of the critical P loads—reflecting the transition from the clear water state with submerged macrophytes to the turbid state dominated by phytoplankton and vice versa—is essential for successful recovery of eutrophic urban lakes (Scheffer et al. Citation1993, Janse et al. Citation2008). A ratio “actual P load”:“critical P load” >1 indicates the necessity to reduce the external P load in order to realize the clear water state (Janse et al. Citation2008) and mitigate nuisance cyanobacteria. In addition to the reduction of the external P load, control of the internal P load is often crucial for long-term positive effects (Gulati and Van Donk Citation2002, Søndergaard et al. Citation2007) as internal P loading can hamper lake recovery for many years (Søndergaard et al. Citation1999).
Lake Kleine Melanen is one of many eutrophic freshwater urban lakes in The Netherlands that are characterized by cyanobacterial blooms (Waajen et al. Citation2014). In 2009, a project was initiated targeting improvement of the water quality of the lake, the clear water state with opportunities for macrophytes, and firm reduction of nuisance cyanaobacteria (Scheffer et al. Citation1993, Scheffer and Van Nes Citation2007). Determination of the causes underlying the poor water quality is crucial to address the problem adequately. Such a diagnosis describes not only the biological makeup and societal function of the water body involved, but also includes the water and P budget. Information on these aspects is essential to indicate effective interventions (Lürling et al. Citation2016). In this study, we determined the causes of the poor water quality of Lake Kleine Melanen based on the water and P budget and of the model-derived critical P loads. This revealed the extent of the external and internal P loads and of the load reductions needed to realize the clear water state. The information indicated necessary restoration measures, including the reduction of external P loads and in-lake measures. Despite this insight, the managing authorities limited the restoration of Lake Kleine Melanen to in-lake interventions as the result of political and financial considerations. The main external nutrient source—stormwater runoff—was left untouched, notwithstanding its impairing effect on lake water quality (Steinman et al. Citation2015).
The in-lake restoration of Lake Kleine Melanen began in 2010. It was executed by the water managers of the lake and included several measures. First, as winter fish kills due to hypoxia under ice (Fang and Stefan Citation2000) have been in issue in the lake, increase in water depth was included. The water managers decided to increase the water depth by an average of ∼0.5 m through the dredging of mud. Increased water depth should reduce the risk of winter fish kill, as it results in a lower oxygen depletion rate and higher oxygen content under ice cover (Mathias and Barica Citation1980, Ellis and Stefan Citation1989). As the fish stock was dominated by carp (Cyprinus carpio carpio) and sediment resuspension by fish keeps the water turbid and prevents establishment of macrophytes (Cline et al. Citation1994, Meijer et al. Citation1999, Chumchal et al. Citation2005), biomanipulation of fish was assigned an in-lake restoration measure. Biomanipulation focused on the reduction of the fish biomass—in particular carp—and the improvement of the habitat for pike (Esox lucius) with helophytes and submerged macrophytes. A characteristic of the lake was the absence of marsh area, the zone with water depth of 0–1 m and habitat for helophytes and submerged macrophytes. The introduction of marsh area should raise the critical P loads (e.g., through the uptake of nutrients by the vegetation and providing a good habitat for predatory fish; Janse et al. Citation2008). This was included in the restoration. Improvement of the habitat for helophytes and submerged macrophytes was done by the removal of the wooden bank protection and the construction of gently sloping banks up to a water depth of 1 m.
To reduce the internal P load, our study indicated that dredging would not suffice. After dredging of mud, the freshly exposed sediment should provide a potential source of P release from mud remnants and underlying peat. To prevent this P release, sediment capping with clean sand was considered a promising measure (Pan et al. Citation2012, Reible and Lampert Citation2014), but knowledge of the impacts of sand capping on P release is scarce (Kim et al. Citation2007). Although sediment capping is used to block P release, the use of a physical barrier alone should not eliminate the movement of dissolved P through the capping material. As the water balance for Lake Kleine Melanen showed that groundwater seepage into the lake occurred during wet periods, the combination of physical capping with an active P fixative to block P release from the sediment was considered (Yuan et al. Citation2009, Pan et al. Citation2012). To test several sediment capping options, we carried out an enclosure experiment. Provided the external P load was largely diminished in the enclosures, we hypothesized for the experiment that (1) sand capping should significantly reduce the total phosphorus (TP), ortho phosphate (OP), and chlorophyll a (Chl-a) concentrations of the overlying water (Pan et al. Citation2012); (2) the effectiveness of sand capping should be enhanced by the addition of a solid phase P sorbent (Yuan et al. Citation2009, Pan et al. Citation2012); and (3) the additional application of a low-dose flocculant should be advantageous in reducing the concentrations of TP, OP, and Chl-a (Van Oosterhout and Lürling Citation2011, Lürling and Van Oosterhout Citation2013). Based on the P budget of the lake and the critical P loads, we hypothesized that the restriction to in-lake measures should not improve water quality enough to firmly reduce the nuisance cyanobacteria in the lake. Following the in-lake measures, we monitored the water quality of the lake for 2 yr. This study presents the results of our determination of causes underlying the eutrophic state of the lake and the results of the enclosure experiment, and provides water quality comparisons before and after in-lake treatment.
Materials and methods
Study site
Lake Kleine Melanen (The Netherlands; lake area 4 ha, mean water depth 1 m) was originally a marshy depression surrounded by heathland. During the 18th century, peat was excavated creating a shallow lake. At present, the lake is situated in a residential area and is surrounded by a small park (; ). The shorelines are characterized by small-scale wooden protection structures and the lake has a layer of accumulated soft sediment (∼1 m thick) on a peat base. Until 2007, the lake was influenced by discharges of mixed sewage. From 2007 onward, the lake has only received stormwater runoff, collected from impervious surfaces in the residential area and entering the lake at 4 points via separated sewer overflows. An outflow weir is situated in the northeast corner of the lake. The water level of the lake is fairly constant throughout the year and the lake is used for recreational angling and is inhabited by ducks and geese, which are fed by local residents. The lake is artificially stocked with fish and has a history of cyanobacterial blooms (Microcystis spp., Dolichospermum spp. [formerly Anabaena], Aphanizomenon spp.), which have been recorded since 1993. The fish biomass in the year 2009 was 605 kg/ha, composed of 67% carp, 12% roach, 11% pike, 4% perch (Perca fluviatilis), and 6% other species (Kalkman Citation2010). In the winter of 2009–2010, an uncontrolled massive winter fish kill of carp reduced the fish biomass. Macrophytes are lacking, despite a few isolated specimens of Ceratophyllum demersum, Lemna minor, and Nymphaea alba.
Figure 1. Location of Lake Kleine Melanen in The Netherlands (left) and detailed map of the lake (right). 1 = sampling location 1993–2008, 2 = sampling location 2009–2014, 3 = location of outlet weir, 4 = locations of the enclosure experiment.
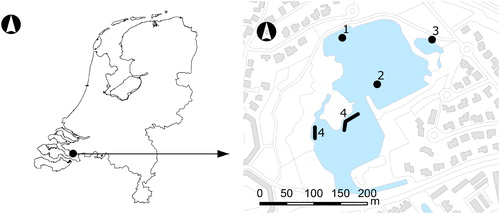
Table 1. Characteristics of Lake Kleine Melanen before restoration (situation in 2009; TP and Chl-a are the mean concentrations for the period 2008–2009, samples taken at water depth 30 cm).
Baseline
The water balance and P loads used in this study were based on measured and published data (Supplement). The PCLake Metamodel (Mooij et al. Citation2010, PBL Citation2015) was used to estimate the critical P load thresholds cPoligo (indicating the transition from the turbid state to the clear state) and cPeutro (indicating the transition from clear to turbid). The PCLake Metamodel requires data on water depth (1 m), marsh area (0 m2), fetch (the minimum fetch of 300 m was used), sediment type (peat), and the vertical extinction coefficient (the model default value of 0.5 /m was used). The external P load was compared with the critical P loads, providing information on necessary reductions of the P load to realize the clear state. This diagnostic feature determined the extent of catchment measures needed. Data of the soft sediment, the underlying peat, and the pore water were extracted from Waltjé et al. (Citation2009). This includes density, dry matter, and organic matter content and the concentrations of P, iron (Fe), and sulfur (S). The sediment P release rates of the upper soft sediment layer and of the underlying peat, which are other relevant diagnostic features, were deduced from a known correlation between the P concentration of the pore water and the sediment P release (Van der Wijngaardt et al. Citation2012), which was derived from 29 shallow lakes spread over The Netherlands:
in which X is the concentration of TP (mg P/L) in the pore water of the upper 5 cm of the sediment and Y is the sediment P release (mg P/m2/d).
Reduction of the discharge from the stormwater runoff should reduce the external P load. However, the intended increase of the water depth, the introduction of marsh area, and the reduction of the discharge from the stormwater runoff changed cPoligo and cPeutro as well (Janse et al. Citation2008). For this reason, when designing the restoration measures, an iterative process was applied. In this, the combined effect of intended measures on the remaining external P load and on cPoligo and cPeutro were calculated several times. Each calculation led to adjustment of the set of measures until the remaining external P load undershot cPeutro.
Enclosure experiment
An enclosure experiment was done to determine which method of sediment capping reduced the concentrations of Chl-a and cyanobacterial Chl-a most and whether a flocculant should have added value. Based on the water clearing properties and good flocculation, polyaluminumchloride (PAC) was used as flocculant (Delgado et al. Citation2003). A lanthanum-modified bentonite clay (LMB, available commercially as Phoslock®) was selected as a solid phase P sorbent, as it has a strong binding capacity to OP (Haghseresht et al. Citation2009), is relatively unaffected by changes in pH and redox state (Ross et al. Citation2008, Gibbs et al. Citation2011), and can reduce the sediment P release even under conditions of groundwater seepage. When applied to the water surface, LMB strips OP from the water column (Robb et al. Citation2003, Akhurst et al. Citation2004, Douglas et al. Citation2008, Ross et al. Citation2008, Egemose et al. Citation2010, Gibbs et al. Citation2011, Van Oosterhout and Lürling Citation2013). The experimental period lasted from 8 March 2010 (day 0) to 3 June 2010 (day 87). The tested treatments were sand capping (S; n = 2), sand capping + LMB (SL; n = 3), sand capping + LMB + PAC (SLP; n = 3), and control (C; n = 3). In total, 11 clear plastic cylinders (diameter 1.05 m, height 1.30 m) were positioned on 2 comparable locations in Lake Kleine Melanen on 3 and 4 March 2010 (). The cylinders were pushed into the sediment leaving 20 cm above the water surface. They were open to the sediment and the air, covered with chicken wire to prevent waterfowl getting in, and contained no fish. The water depth inside the cylinders was initially on average 84 cm (water volume in each cylinder was ∼710 L). Commercially available desalinated clean sea sand from a local vendor was carefully added to the cylinders with a scoop on 4 March 2010 until a layer of 20 cm settled on top of the sediment. The thickness of the sand capping layer was tested with a clear plastic tube corer. On 8 March 2010 (day 0), LMB (253 g LMB/enclosure, 292 g LMB/m2, 5% La, 14.6 g La/m2, supplied by Phoslock Europe GmbH, Ottersberg, Germany) was mixed with lake water and added as a slurry to the water surface. After 15 min, 25 mL PAC/enclosure (3.0 g Al/enclosure, 28.9 mL PAC/m2, 3.5 g Al/m2; Melfloc 39 polyaluminumchloride, ρ = 1.37 kg/L, 8.9% Al, 22% Cl, supplied by Melspring International B.V., Arnhem, The Netherlands) was superficially added to the SLP enclosures and mixed through the water with a scoop. The LMB dose for the enclosure experiment was tailored to match the external P load of the lake and TP concentration of the lake water prior to the experiment (0.31 mg P/L, 3 December 2009), and was based on the 100:1 ratio for LMB:P (by weight) as was recommended by the manufacturer. The TP concentration of the lake water represented the stock of potentially bioavailable P present in the lake water. The LMB dose (292 g LMB/m2) was within the range used in 16 other lakes (mean 349 g LMB/m2, SD ± 189, minimum 6 g LMB/m2, maximum 667 g LMB/m2; Spears et al. Citation2013b). The PAC dose for optimal flocculation was experimentally determined in a jar test 2 h before the application.
In-lake measures
In-lake measures were implemented in Lake Kleine Melanen from 2010 until 2012 (). Biomanipulation consisted of the removal of fish by combined seine hauling and electrofishing. This was done before dredging and (including the effect of the winter fish kill in winter 2009–2010) resulted in a remaining fish biomass of ∼150 kg/ha (Kalkman Citation2010). Trees and shrubs on the lake shores were pruned to decrease litter fall into the lake and to provide more light on the shores. Wooden bank protection was removed, natural sloping banks were constructed, and sediment was dredged. After dredging, clean sand was mixed with lake water and sprayed on the water surface. Four successive sand layers, each 5 cm thick, were deposited on top of the locally remaining soft sediment and the peat. Although bioturbation enhances sediment P release (Holdren and Armstrong Citation1980), a sand layer of 20 cm should prevent bioturbation of remaining soft sediment and peat by fish, as this bioturbation is largely limited to the upper 10–15 cm of the sediment (Davis Citation1974, Ten Winkel and Davids Citation1985, Adámek and Maršálek Citation2013). A total of 16.57 tonnes of LMB were applied to the lake (414 g LMB/m2), tailored to match the concentration of potentially bioavailable P in the upper 10 cm of the freshly exposed sediment after the dredging as was determined by sequential P fractionation (Psenner et al. Citation1984, Hupfer et al. Citation2009, Institut Dr. Nowak Citation2011). The amount of potentially bioavailable P of the freshly exposed sediment was 4115 mg P/m2 (Institut Dr. Nowak Citation2011) and the implemented La:P ratio was 1.1:1 (mol:mol). The LMB was mixed with the lowest 5 cm layer of sand to improve positioning of the LMB on the lake bottom and to reduce the risk of direct contact of the LMB with organic matter in the sediment, as it is known that organic matter hampers the P-binding capacity of LMB (Geurts et al. Citation2011, Lürling et al. Citation2014).
Table 2. Restoration measures, date of implementation and details. LMB = lanthanum modified bentonite.
Sampling and analysis
Enclosure experiment
Prior to the enclosure experiment, the lake was sampled 11 d before the start of the experiment (day −11). The enclosures and the lake were sampled on day −4 and on days 0, 1, 4, 11, 24, 45, 59, and 87 at a water depth of 0.3 m. Samples were taken in the morning (between 08:00 and 12:00 h). At day −4, the samples from the enclosures were taken 1.5 h after the addition of the sand, while at day 0 the samples were taken 1.5 h after the addition of the LMB and PAC. TP and total nitrogen (TN) concentrations were analyzed in unfiltered samples and OP in filtered samples (0.45 µm membrane filter, Polydisk) using a continuous flow analyzer (Skalar Analytical BV, Breda, The Netherlands) following the Dutch standard protocols (NNI Citation2005a, Citation2005b, Citation2006a). Chl-a concentrations were determined in the laboratory with a PHYTO-PAM phytoplankton analyzer (Heinz Walz GmbH, Effeltrich, Germany), differentiated into cyanobacteria, green algae, and diatoms, and calibrated against the Dutch standard procedure (NNI Citation2006b). The sum of the Chl-a concentrations from cyanobacteria, green algae, and diatoms is referred to as total Chl-a concentration. Turbidity was measured using a Hach 2100P turbidity meter in Formazin Turbidity Units (FTU). Total lanthanum (TLa) analysis was conducted in unfiltered samples and filterable La (FLa) in filtered samples (0.45 µm membrane filter, Polydisk) according to NNI (Citation2009) by inductively coupled plasma optical emission spectrometry ICP-OES (detection limits 6–12 µg/L). On every sampling date, the pH and oxygen (O2) concentrations were determined in situ using a WTW Multi 350i meter (WTW, Weilheim, Germany). Filterable aluminum (Al) was analyzed in filtered samples (0.45 µm membrane filter, Polydisk) by ICP-MS according to NNI (Citation2004).
Whole-lake monitoring
The lake was sampled at one location during daytime (between 08:00 and 14:00 h) in 1993, 1997, 2000, 2002–2005, and 2008–2014, mostly on a monthly basis. From 2009 to 2014, the sampling location differed from the years before (). Both locations are comparable and the water quality did not differ significantly (Water Authority Brabantse Delta, unpubl. data). On each date, a single sample was collected from the lake at the water depth of 0.3 m. Concentrations of TP, OP, TN, and Chl-a (spectrophotometric method) were analyzed in the laboratory following the Dutch standard protocols (NNI 2005a, Citation2005b, Citation2006b, and predecessors). Secchi disk transparency (SDT) was measured using a 20 cm diameter Secchi disk. TLa analysis was conducted in unfiltered samples and FLa in filtered samples (0.45 µm membrane filter, Polydisk) according to NNI (Citation2009), inductively coupled plasma optical emission spectrometry ICP-OES in 2010 (detection limits 6–12 µg/L), and inductively coupled mass spectrometry ICP-MS from 2012 until 2014 (detection limits 0.02–0.2 µg/L). Oxygen concentrations were determined in situ using a WTW Multi 350i meter. The concentration of cyanobacterial Chl-a was measured by fluorescence-based methods, calibrated against the Dutch standard procedure (NNI Citation2006b). From 25 February 2010 until 30 July 2010, 11 measurements were done by PHYTO-PAM. Lake water samples were taken on the same dates as for the enclosure experiment, extended with sampling on 30 July 2010. Additionally, measurements by PHYTO-PAM were done in 3 samples taken on random dates in August 2007, 2008, and 2009, one sample per year. In total, 14 measurements were done before the interventions. From November 2012 until October 2014—after the interventions—24 samples from the lake were taken each month and measurement of cyanobacterial Chl-a was done using a FluoroProbe (Moldaenke bbe, Schwentinental, Germany; Catherine et al. Citation2012). Additionally, measurement of cyanobacterial Chl-a was done by PHYTO-PAM in 2 samples taken on random dates during August 2013 and 2014, one sample per year. In total, 26 measurements were done after the interventions.
The separated sewer overflows were sampled at 3 locations entering the lake on 27 August 2010 and 11 November 2010 after rainstorms. These samples were analyzed for the concentrations of TP and OP.
Sediment core samples were taken on 14, 15, and 16 September 2009 at 6 locations spread over the lake using a Beeker core sampler (Eijkelkamp Agrisearch, Giesbeek, The Netherlands; Waltjé et al. Citation2009). From the cores, subsamples were taken from the top layer of the soft sediment (depth 0.0–0.1 m) and from the top of the underlying peat (at a mean sediment depth of 1.0–1.1 m). The pore water was anaerobically sampled from both layers using rhizons (0.1 µm; Eijkelkamp Agrisearch) and analyzed for concentrations of TP, S, and Fe. Analyses were performed according the Dutch standard protocols (Waltjé et al. Citation2009).
To determine the amount of LMB to be used, the potentially releasable P fraction after the dredging was measured at 8 locations spread over the lake, in samples taken on 20 June 2011 with an Ekman-Birge sampler from the upper layers of the sediment (0–5 cm and 5–10 cm). Four samples of sediment from the northern part of the lake were mixed as well as four samples from the southern part. Each mixed sample was analyzed for the amount of potentially releasable P (Psenner et al. Citation1984, Hupfer et al. Citation2009, Institut Dr. Nowak Citation2011).
Data analysis
As requirements for ANOVA were violated, the concentrations of TP, OP, TN, Chl-a, TLa, FLa, and O2, as well as the turbidity from day 0 until day 87 in the enclosure experiment, were analyzed by nonparametric Kruskal–Wallis Test (P < 0.05) and post hoc analyses by pairwise comparisons using Dunn’s (Citation1964) procedure. A Bonferroni correction for 6 multiple comparisons was made in order to correct for Type I errors (P < 0.05; SPSS 21, IBM). Parallel lines analysis of concentrations of OP for individual enclosures from day 0 until day 59 was done in SigmaPlot 12.5 (Systat Software Inc.).
Water quality variables (TP, OP, TN, Chl-a, cyanobacterial Chl-a, SDT, O2) of the lake were analyzed with data lumped for the periods before (Jan 2008–Aug 2010; cyanobacterial Chl-a Aug 2007–Jul 2010), during (Sep 2010–Oct 2012; except for cyanobacterial Chl-a), and after (Nov 2012–Oct 2014) the whole-lake measures. As data for ANOVA were violated, the 3 groups for each variable were compared by nonparametric Kruskal–Wallis Test (P < 0.05) and post hoc analyses by pairwise comparisons using Dunn’s (Citation1964) procedure (SigmaPlot). When the concentration was below the detection limit, the value of half the detection limit was used in data analysis.
Results
Baseline
Over the period 2008–2009, the mean TP concentration was 0.31 mg/L and the mean Chl-a concentration was 107 µg/L, while the mean cyanobacterial Chl-a concentration over the period August 2007–July 2010 was 52 µg/L (). The water balance showed that 14% of the inflow originated from precipitation on open water and 86% from precipitation on impervious surfaces collected in the separated sewer system (Supplement). The estimated total external P load into the lake was 7.5 mg P/m2/d ( and Supplement), of which 87% originated from the separated sewer system (stormwater runoff). The remaining 13% of the external P load consisted of several sources, with litter fall being the second largest (), supplying 4%. The critical P loads were estimated at 3.4 mg P/m2/d (cPoligo) and 5.2 mg P/m2/d (cPeutro), which were well below the total external P load. The top layer of the peat had a higher amount of dry matter (25.1%) and organic matter (64.5%) than the top layer of the accumulated soft sediment (9.5% and 47.9%, respectively; ). The TP, S, and Fe concentrations of the top layer of the soft sediment were 11, 5, and 15 times higher, respectively, than the TP, S, and Fe concentrations of the top layer of the peat (). TP and Fe concentrations of the pore water in the top layer of the soft sediment were 6–38 times higher than the concentrations of TP and Fe of the pore water in the top of the peat, while the S concentrations were in the same range (). The Fe:P (mol:mol) ratio of the pore water of the peat was on average 0.1. Based on visual observations during sampling, the structure of the soft sediment layer was homogeneous over depth (Waltjé et al. Citation2009). The P release of the soft sediment was estimated at 3.8 mg P/m2/d.
Table 3. External P loads (mg P/m2/d) of Lake Kleine Melanen before restoration (see Supplement for details).
Table 4. Sediment characteristics (density, % dry matter, % organic matter) and concentrations of total phosphorus (TP), iron (Fe), and sulfur (S) in sediment (A; g/kg DW) and pore water (B; mg/L). DW = dry weight, SE in parentheses (data extracted from Waltjé et al. Citation2009).
Enclosure experiment
At day 4, the mean TP concentration in the enclosures was 0.39 mg/L (±0.13 mg/L; n = 11). During the course of the experiment (day 0–87), the treatments S, SL, and SLP had an obvious effect on the TP concentration compared to the control enclosures C (). The effect was significant for the treatments SL and SLP, with SLP showing the lowest TP concentration (, which gives the medians of the concentration). The reduction was most obvious during the first 11 d of the experiment (). In the SLP treatment, the mean TP concentration over the entire 87 d experimental period was 0.07 mg P/L, compared to 0.31 mg P/L in the C enclosures and 0.21 mg P/L in the lake. The mean OP concentration in the SL and SLP treatments was <0.01 mg P/L, which was lower than in S (0.021 mg P/L), in the control C (0.065 mg P/L), and in the lake (0.036 mg P/L; ). Parallel lines analyses showed that the OP concentrations in the S enclosures had a similar increase over time (day 0–59) as in the C enclosures (F1, 38 = 0.19, P = 0.67), in contrast to the SL (F1, 38 = 34.40, P < 0.0001) and to the SLP enclosures (F1, 38 = 30.51, P < 0.0001), which reacted significantly different from the S enclosures. After day 59, the OP concentrations in the C enclosures varied between 0.11 mg P/L and 0.65 mg P/L and increased more than in the S enclosures (0.06–0.07 mg P/L), while OP concentrations in the SL and in the SLP enclosures remained at or below the detection limit of 0.01 mg P/L ().
Figure 2. Total phosphorus (TP) concentrations (mg/L) in enclosure experiment. Treatments: C (control, panel A), S (sand capping, panel B), SL (sand capping + LMB, panel C), SLP (sand capping + LMB + PAC, panel D). The gray areas indicate the TP concentration in the lake (days −11 to 87). Open symbols indicate the TP concentration on day −4, at 1.5 h after sand addition. Error bars indicate 1 SE (n = 3). In panel B the course of TP in each replicate is presented.
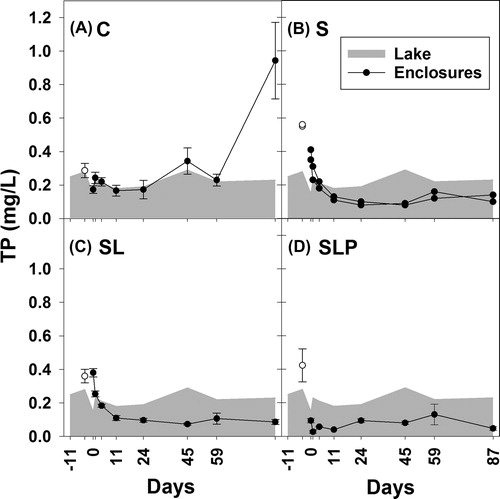
Figure 3. Ortho-phosphate (OP) concentrations (mg/L) in enclosure experiment. Treatments: C (control, panel A), S (sand capping, panel B), SL (sand capping + LMB, panel C), SLP (sand capping + LMB + PAC, panel D). The gray areas indicate the OP concentration in the lake (days −11 to 87). Open symbols indicate the OP concentration on day −4, at 1.5 h after sand addition. Error bars indicate 1 SE (n = 3). In panel B the course of OP in each replicate is presented.
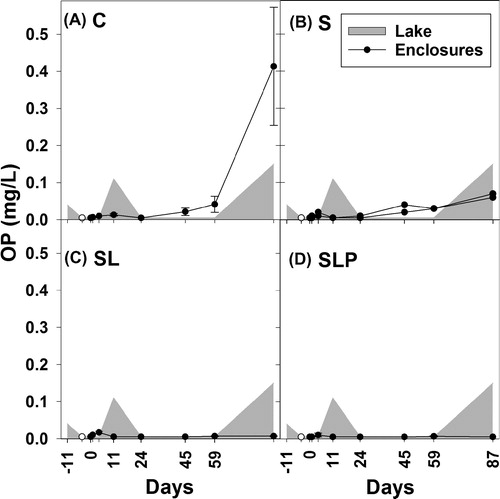
Table 5. Enclosure experiment: median concentrations of total phosphorus (TP, mg/L), ortho-phosphate (OP, mg/L), total nitrogen (TN, mg/L), total and cyanobacterial Chl-a (µg/L), total and filterable lanthanum (TLa, FLa, µg/L) and median turbidity (FTU, Formazin Turbidity Units) in control (C; n = 3) enclosures and in enclosures with sand capping (S; n = 2), sand capping + LMB (SL; n = 3), and sand capping + LMB + PAC (SLP; n = 3) during the 87 d experimental period. SE in parentheses except for OP. For OP, the number of sampling events with a mean concentration <0.01 mg P/L is given in parentheses (total number of sampling events = 8). The right column shows the results of nonparametric Kruskal–Wallis Test. Capital letters (A, B, C) indicate significantly different groups (P < 0.05).
TN concentrations in S, SL, and SLP enclosures were significantly lower than in the C enclosures. The TN concentration in the SLP treatment was lower than in the S and SL treatments, but this difference was not significant ().
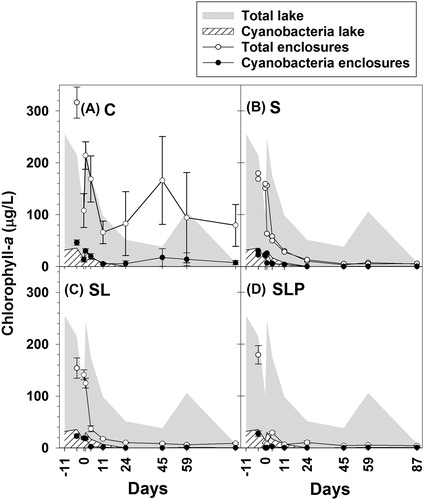
Total Chl-a concentrations in the lake were high during the first 59 d of the experiment, varying between 38 and 246 µg/L (). During the experimental period, cyanobacterial Chl-a concentrations in the lake reached a maximum of 30 µg/L on day 1 and then decreased to 0 µg/L on day 24 (). In the C enclosures, the cyanobacterial Chl-a concentration varied between 5 and 30 µg/L (). The S, SL, and SLP treatments showed significantly lower total Chl-a concentrations than the C enclosures with the lowest concentration in the SLP treatment (). The SLP enclosures showed a significantly lower cyanobacterial Chl-a concentration than the C enclosures, while the concentrations in the treatments S and SL were not significantly lower than in C (, ). During the first 3 weeks of the experiment, the decrease in concentrations of total and cyanobacterial Chl-a was more pronounced in the treatments SL and SLP than in S ().
Figure 4. Concentrations of total Chl-a (µg/L, open symbols) and cyanobacterial Chl-a (µg/L, filled symbols) in enclosure experiment. Treatments: C (control, panel A), S (sand capping, panel B), SL (sand capping + LMB, panel C), SLP (sand capping + LMB + PAC, panel D). The gray areas indicate the total Chl-a concentration and the hatched areas indicate the cyanobacterial Chl-a concentration in the lake (days −11 to 87). Symbols at day −4 indicate the Chl-a concentrations 1.5 h after sand addition. Error bars indicate 1 SE (n = 3). In panel B the course of total and cyanobacterial Chl-a in each replicate is presented.
Turbidity on day 0 was on average 120 FTU in the S enclosures and 137 FTU in the SL enclosures. In the SLP enclosures, the turbidity was 7 FTU on day 0, while the mean and the median was 3 FTU during the entire experimental period. In the S and SL enclosures turbidity decreased below 10 FTU after 24 d. Turbidity in the SLP enclosures was significantly lower than in the S and SL treatments, which in turn did not differ significantly from the C enclosures ().
The TLa and FLa concentrations in the lake, in the C enclosures, and in the S enclosures were below the detection limit of 12 µg/L during the entire experimental period. On day 0, the mean concentrations were 4133 µg TLa/L and 47 µg FLa/L in the SL enclosures and 753 µg TLa/L and 42 µg FLa/L in the SLP enclosures. The initially increased TLa and FLa concentrations in the SL and SLP enclosures decreased over time and rose again from day 45 on. On day 87, the mean TLa and FLa concentrations had increased to 790 µg TLa/L and 187 µg FLa/L in the SL enclosures and to 157 µg TLa/L and 40 µg FLa/L in the SLP enclosures. The Dutch standards for TLa of 150.1 µg/L and for FLa of 10.1 μg/L (http://www.rivm.nl/rvs/Normen/Eindresultaat?groep=normen&waarde=lanthanum%28freshwater%29&lijst=milieukwaliteit&veld=englishsubstancename_tagged, accessed 8 December 2014) were violated. The concentrations TLa and FLa were lower in the SLP enclosures compared to the SL enclosures, but the differences were not significant ().
During the experimental period, the pH in the lake varied from 7.2 to 9.2 and in the C enclosures from 6.6 to 8.6. In the S enclosures, the pH varied from 8.0 to 9.0, in the SL enclosures from 7.2 to 8.6, and in the SLP enclosures from 7.1 to 8.2. The mean concentration of filterable Al in the SLP enclosures got up to 82.7 µg/L and in the control enclosures to 54.0 µg/L. Oxygen (O2) concentrations varied in the lake from 9.0 mg/L (83% saturation) to 18.0 mg/L (138%), in the C enclosures from 5.7 mg/L (50%) to 24.5 mg/L (198%), in the S enclosures from 8.2 mg/L (72%) to 15.0 mg/L (133%), in the SL enclosures from 3.8 mg/L (33%) to 15.7 mg/L (117%), and in the SLP enclosures from 6.4 mg/L (56%) to 18.4 mg/L (142%). As sampling was done during daytime (between 08:00 and 12:00 h), lower readings of pH and O2 can be expected during nighttime.
In-lake measures
After the in-lake restoration measures () were taken, significant reductions of the mean concentrations of TP (from 0.30 to 0.11 mg/L), OP (from 0.10 to 0.01 mg/L), and Chl-a (from 111 to 39 µg/L) were observed (). The mean concentration of cyanobacterial Chl-a was lower after the measures (5.9 µg/L), but compared to the period before (51.6 µg/L), the difference was not statistically significant. After the measures, cyanobacterial blooms still appeared (maximum cyanobacterial Chl-a concentration 32 µg/L on 24 July 2013 and 17 µg/L on 24 June 2014; after the research period the concentration of cyanobacterial Chl-a peaked at 110 µg/L on 26 October 2016; Water Authority Brabantse Delta, unpubl. data). The concentrations of TN and the SDT did not differ significantly after the measures were taken compared to before. The concentrations of TLa and FLa were raised after the measures compared to before (). Due to the fact that only one measurement of TLa and Fla was done before the measures were taken, no statistical significance could be shown. Although the mean O2 concentrations before and after the measures showed no significant difference, the fluctuations in the O2 concentrations decreased from 2.2–20.8 mg/L before to 5.4–14.4 mg/L after implementation of measures.
Table 6. Whole-lake measures: mean concentrations of total phosphorus (TP, mg/L), ortho-phosphate (OP, mg/L), total nitrogen (TN, mg/L), chlorophyll a (Chl-a, µg/L), cyanobacterial chlorophyll a (cyano Chl-a, µg/L), total and filterable lanthanum (TLa, FLa, µg/L), oxygen (O2, mg/L), and mean Secchi disk transparency (SDT, m) in Lake Kleine Melanen before (Jan 2008–Aug 2010), during (Sep 2010–Oct 2012), and after (Nov 2012–Oct 2014) measures were implemented, based on monthly sampling except cyano Chl-a, TLa, and FLa. SE in parentheses.
Discussion
Baseline
Unexpectedly, the separated sewer system appeared to be the most important contributor to the external P load ( and Supplement). Although the intent of the separated sewer system was to separate wastewater from rainfall and to discharge only collected rainfall into the lake, the mean TP concentration of the discharges was more than 13 times higher than the rainfall itself (Supplement). High TP concentrations in discharges from separated sewer systems have been shown in other research (Boogaard et al. Citation2014), but the local authorities were not aware of the negative impact of this P source on the lake. Pollution of the collected rainfall is most likely the result of urban sources such as street dirt, dog and bird feces, fertilizers, and plant matter (Waschbusch et al. Citation2000, Deffontis et al. Citation2013). The other external P sources contributed 13% in total to the external P load (). The reduction of the P load from the separated sewer system by 35–63% should reduce the total external P load to the critical range where alternative stable states exist and reduction of the cyanobacterial blooms could be expected. To restore the lake, there was the need for a vigorous reduction of the average yearly external P load to a level well below cPeutro, to mitigate variations of P loads over time, heterogeneity in data (Supplement), and uncertainty in the use of environmental models to predict impacts (Refsgaard et al. Citation2007). When confronted with empirical data, the uncertainty in the PCLake predictions of the switch points cPeutro and cPoligo is ∼40% (Janse Citation2005, Janse et al. Citation2008, Janse et al. Citation2010, Mooij et al. Citation2010).
The low Fe:P (mol:mol) ratio of the pore water of the peat indicated the serious risk of P release after sediment removal (Smolders et al. Citation2001, Geurts et al. Citation2010). Although dredging was necessary to increase the water depth and reduce the risk of winter fish kills, this could not greatly reduce the internal P load.
Enclosure experiment
The enclosure experiment showed the lowest concentrations of TP and total Chl-a, and of turbidity, in the SLP enclosures. This is ascribed to inactivation and precipitation of P by LMB and PAC (Lürling and Van Oosterhout Citation2013). In the SLP enclosures, 14.6 g La/m2 and 3.5 g Al/m2 were added. The La should suffice to bind 71% of the potentially bioavailable P in the upper 10 cm of the sediment under the sand layer. According to the ratio of added Al to adsorbed P of 100:1 (Rydin and Welch Citation1999), the applied Al should suffice to bind <1% of the potentially bioavailable P, indicating that La was more important in binding P than Al.
Sand capping alone could not reduce the concentrations of TP and OP significantly, although the mean TP concentration was reduced by 36%. Over time, an increase of OP concentrations was shown (). This contrasts with findings of Pan et al. (Citation2012), who showed in a 20 d experiment that sand capping reduced the sediment to water OP flux. However, a capping layer of clean sand cannot prevent P diffusion from pore water to the overlying water (Pan et al. Citation2012), indicating that diffusion increased the OP concentration during our 87 d experiment. The OP transport through the capping layer might have been enhanced by groundwater seepage and sediment compression (Mohan et al. Citation2000). The most obvious reductions in concentrations of TP, OP, and Chl-a were observed during the first 11 d of the experiment (). The application of PAC resulted in an instant reduction of the concentrations of TP and Chl-a, while in the treatments without PAC it took ∼11 d to reach comparable low levels (). As the experiment lasted, containment effects of the enclosures (e.g., growth of periphyton on the inside walls and reduced water mixing in the enclosures; Petersen et al. Citation2009) cannot be excluded to have impacted the results. Nevertheless, all enclosures are expected to have been subjected to these effects. At the end of the experiment, TP and OP increased dramatically in the controls (). As the external P loads to the enclosures were minimalized, this is most likely due to sediment P release, enhanced by containment effects promoting anoxic conditions near the sediment (Smolders et al. Citation2006).
LMB application raised the TLa and FLa concentrations. Although the application of PAC lowered the TLa and FLa concentrations, this was not significant. TLa and FLa concentrations decreased over time but increased again from day 45. Persisting high La concentrations were observed in another enclosure experiment in an urban pond where LMB was applied in combination with the removal of soft sediment, and they were attributed to biological vectors (Lürling et al. Citation2017). Spears et al. (Citation2013b) postulated that after the initial decrease of the TLa concentration due to LMB settling, an increase of the TLa concentration can be ascribed to biologically and physically induced bed sediment disturbance processes, while the FLa concentration is regulated by physico-chemical conditions of the water. During sampling events, we observed ebullition of gas bubbles from the sediment in all treatments, probably caused by the production of methane under the capping layer (Barros et al. Citation2014). Ebullition is a plausible cause for the observed raised La concentrations.
The raised La concentrations are a matter of concern, as La has the potential for unintended ecotoxicological impacts (Lürling and Tolman Citation2010, Spears et al. Citation2013a, Van Oosterhout et al. Citation2014), and the violation of the water quality standards for TLa and FLa poses legal consequences. Although the knowledge on this aspect is limited (Copetti et al. Citation2016), the issue should be considered when preparing a treatment and the potential ecological consequences of the use of La should be weighed against the negative consequences of cyanobacterial blooms. Additional application of PAC had the advantage over sole LMB of a lesser increase of the TLa and FLa concentrations, calling for a short period between LMB and PAC applications. pH values of 8.5 and above pose the risk of dissolution of sediment Al(OH)3 to form toxic aluminate (Reitzel et al. Citation2013). The SLP treatment showed a maximum pH of 8.2 during the course of the experiment. After the application of PAC, the Al concentration remained below the indicative maximum permissible concentration for dissolved Al of 312 µg/L as used in legislation in The Netherlands (Van de Plassche Citation2003), below the upper limit for dissolved Al of 100 µg/L in hard water lakes (Burrows and Hem Citation1977) and below the value of 150 µg/L, which is known to cause undesired effects (Reitzel et al. Citation2013). Nevertheless, the application of PAC should be considered with care, especially in waters with pH >8.5.
In the presence of humic substances, complexation of La from LMB with humic substances prevents La from binding with phosphates (Lürling et al. Citation2014). The organic matter content of the soft sediment (47.9%; ) and the DOC concentration of the lake water (mean DOC concentration in 2014 was 8.5 mg/L, SE ±0.8, n = 6; Water Authority Brabantse Delta, unpubl. data) indicated that this could happen. To minimize the risk of direct contact of La with organic matter in the lake’s sediment and water, the water manager decided to apply the LMB mixed into the sand.
In-lake measures and synthesis
SLP showed the strongest reduction of concentrations of TP and Chl-a and was selected the preferable treatment for the lake. However, after dredging, only sand capping and LMB were applied to the lake. The application of PAC—to clarify the water and promote macrophytes—was considered effective only after the vigorous reduction of the external P load. Although significant reductions in the concentrations of TP, OP, and Chl-a were observed (), a shift to the clear water state did not happen. The mean Chl-a concentration remained high (39 μg/L). Following the interventions, the mean concentration of cyanobacterial Chl-a was lower, but cyanobacterial blooms were not eliminated due to the ongoing external P loading. SDT did not significantly increase and few submerged macrophytes colonized the lake. The low SDT limits the maximum depth for submerged angiosperm colonization to 1 m (Chambers and Kalff Citation1985). After the measures, the fluctuations in O2 concentrations decreased and the O2 concentrations did not drop below 2 mg/L, a threshold indicative for fish kill (Fang and Stefan Citation2000). The LMB application raised the FLa concentrations for ∼9 months, a period comparable to recovery periods for FLa concentrations found after LMB applications in 16 case study lakes (Spears et al. Citation2013b).
Despite improvements in water quality and a reduction in the mean concentration of cyanobacterial Chl-a, major restoration targets—clear water state with opportunities for macrophytes and firm reduction of cyanobacterial blooms—were not entirely met. The mean concentrations of TP, OP, and Chl-a reduced significantly, but improvements in TN, cyanobacterial Chl-a, and SDT were not statistically significant. The identified improvements were too little, the clear water state was not established, and nuisance cyanobacteria persisted. For this, we accept our hypothesis that was stated in the Introduction. The major external P source, discharges from the separated sewer system, was not reduced, negating the benefits of the in-lake measures and reducing their investment values (Steinman et al. Citation2015). It is by far preferable to start with the reduction of the external P sources (Søndergaard et al. Citation2007, Jeppesen et al. Citation2012). However, this turned out not to be possible given the challenges associated with the reduction of the external P loads. Split responsibilities in water management of the lake complicated the situation. The water authority took care of the in-lake measures, while the municipality had the liability for the separated sewer system. Six years after the in-lake restoration, a bypass for the stormwater runoff around the lake is under construction, as purification of the stormwater runoff before it enters the lake was shown to not be feasible. The bypass will divert most of the collected stormwater runoff to another water body less susceptible to cyanobacterial blooms. The bypass will reduce the annual P input from the separated sewer system into the lake by 91%, to 0.6 mg P/m2/d, resulting in a total remaining external P input of 1.6 mg P/m2/d. However, the bypass will also reduce the water inflow into the lake and increase the residence time. The combination of these measures results in new critical P loads for the lake of cP′oligo 1.0 mg P/m2/d and cP′eutro 3.5 mg P/m2/d. Combined with the finalizing PAC application, the realization of the bypass provides prospects for the increase of SDT, the firm reduction of the cyanobacterial blooms, and the expansion of submerged macrophytes. Nevertheless, until the external P load is reduced, sediment accretion is a concern.
Sufficient improvement of the water quality to realize the clear water state and firmly suppress nuisance cyanobacteria requires a complete restoration, composed of both external and internal management. Each of the recommended measures by itself is not powerful enough to realize a steady clear water state. The implementation of the in-lake measures in Lake Kleine Melanen was not enough to attain the clear water state and firmly suppress cyanobacteria. The in-lake measures alone did not clarify the water, due to the continuing external P loading and lack of macrophytes. Our findings show the usefulness of diagnostics in urban lake restorations. A side effect of this study is the growing awareness of the local authorities for the potential negative effects of discharges from separated stormwater runoff sewer systems.
Conclusions
Exceedance of the critical P load of Lake Kleine Melanen, causing turbid water and cyanobacterial blooms, was largely due to discharges from the separated stormwater sewer system. Sediment removal could not eliminate the risk of high sediment P release. An enclosure experiment, testing different sediment capping options, showed that the best reductions of TP and Chl-a concentrations were realized by combining sand capping, LMB, and PAC, provided the external P load was reduced. The implementation of in-lake measures alone, leaving the major external P source to the lake untouched, did not realize the clear water state. Cyanobacteria were not suppressed sufficiently and blooms—although less intense—continued, showing the discharges from the separated sewer system have to be substantially reduced to minimalize the nuisance cyanobacteria.
ulrm_a_1505791_sm0650.docx
Download MS Word (33.5 KB)Acknowledgments
The research and restoration of Lake Kleine Melanen were supported by the Water Authority Brabantse Delta, the Municipality of Bergen op Zoom, the Province of Noord Brabant, and the Wageningen University. We thank the colleagues from the former Deltawaterlab and from the Aquon Laboratory for assistance with sampling and the chemical analyses. Ingrid Menger is thanked for water balance calculations, Joris van Buul for the drawing of , Elizabeth Sigalet (Canada) and anonymous reviewers for valuable comments on the manuscript.
Related Research Data
References
- Akhurst D, Jones GB, McConchie DM. 2004. The application of sediment capping agents on phosphorus speciation and mobility in a sub-tropical dunal lake. Mar Freshwater Res. 55(7):715–725.
- Adámek Z, Maršálek B. 2013. Bioturbation of sediments by benthic macroinvertebrates and fish and its implication for pond ecosystems: a review. Aquacult Int. 21(1):1–17.
- Anderson KA, Downing JA. 2006. Dry and wet atmospheric deposition of nitrogen, phosphorus and silicon in an agricultural region. Water Air Soil Pollut. 176(1-4):351–374.
- Barros N, Mendonca R, Aben R, Althuizen I, Van Bergen T, Huszar V, Lamers L, Lürling M, Roland F, Kosten S. 2014. Eutrophication and global warming enhance greenhouse gas emissions of shallow lakes. Shallow Lakes Conference 12–17 October 2014, Antalya, Turkey.
- Bolund P, Hunhammar S. 1999. Ecosystem services in urban areas. Ecol Econ. 29(2):293–301.
- Boogaard FC, Van de Ven F, Langeveld JG, Van de Giesen N. 2014. Stormwater quality characteristics in (Dutch) urban areas and performance of settlement basins. Challenges. 5(1):112–122.
- Brönmark C, Hansson LA. 2002. Environmental issues in lakes and ponds: current state and perspectives. Envir Conserv. 29(03):290–306.
- Burrows WD, Hem JD. 1977. Aquatic aluminum – chemistry, toxicology, and environmental prevalence. Crit Rev Environ Sci Technol. 7(2):167–216.
- Carpenter SR. 2008. Phosphorus control is critical to mitigating eutrophication. Proc Natl Acad Sci USA. 105(32):11039–11040.
- Catherine A, Escoffier N, Belhocine A, Nasri AB, Hamlaoui S, Yéprémian C, Bernard C, Troussellier M. 2012. On the use of the FluoroProbe®, a phytoplankton quantification method based on fluorescence excitation spectra for large-scale surveys of lakes and reservoirs. Water Res. 46(6):1771–1784.
- Chambers PA, Kalff J. 1985. Depth distribution and biomass of submerged aquatic macrophyte communities in relation to Secchi depth. Can J Fish Aquat Sci. 42(4):701–709.
- Chumchal MW, Nowlin WH, Drenner RW. 2005. Biomass-dependent effects of common carp on water quality in shallow ponds. Hydrobiologia. 545(1):271–277.
- Cline JM, East TL, Threlkeld ST. 1994. Fish interactions with the sediment-water interface. Hydrobiologia. 275–276(1):301–311.
- Conley DJ, Paerl HW, Howarth RW, Boesch DF, Seitzinger SP, Havens KE, Lancelot C, Likens GE. 2009. Ecology. Controlling eutrophication: nitrogen and phosphorus. Science. 323(5917):1014–1015.
- Cooke GD, Welch EB, Peterson SA, Nichols SA. 2005. Restoration and management of lakes and reservoirs. Boca Raton (FL): CRC Press, Taylor & Francis Group.
- Copetti D, Finsterle K, Marziali L, Stefani F, Tartari G, Douglas G, Reitzel K, Spears BM, Winfield IJ, Crosa G, et al. 2016. Eutrophication management in surface waters using lanthanum modified bentonite: a review. Water Res. 97:162–174.
- Danielsson Å, Jönsson A, Rahm L. 2007. Resuspension patterns in the Baltic proper. J Sea Res. 57(4):257–269.
- Davis RB. 1974. Effects of tubificids in profundal lake sediments. Limnol Oceanogr. 19(3):466–488.
- Deffontis S, Breton A, Vialle C, Montréjaud-Vignoles M, Vignoles C, Sablayrolles C. 2013. Impact of dry weather discharges on annual pollution from a separate storm sewer in Toulouse, France. Sci Total Environ. 452–453:394–403.
- Delgado S, Diaz F, Garcia D, Otero N. 2003. Behaviour of inorganic coagulants in secondary effluents from a conventional wastewater treatment plant. Filtration + Separation. 40(7):42–46.
- Douglas GB, Robb MS, Ford PW. 2008. Reassessment of the performance of mineral-based sediment capping materials to bind phosphorus: a comment on Akhurst et al. (2004). Mar Freshwater Res. 59(9):836–837.
- Dunn OJ. 1964. Multiple comparisons using rank sums. Technometrics. 6(3):241–252.
- Egemose S, Reitzel K, Andersen FØ, Flindt MR. 2010. Chemical lake restoration products: sediment stability and phosphorus dynamics. Environ Sci Technol. 44(3):985–991.
- Ellis CR, Stefan HG. 1989. Oxygen demand in ice covered lakes as it pertains to winter aeration. J Am Water Resources Assoc. 25(6):1169–1176.
- Fang X, Stefan HG. 2000. Projected climate change effects on winterkill in shallow lakes in the northern United States. Environ Manage. 25(3):291–304.
- Geurts JJM, Smolders AJP, Banach AM, Van der Graaf JPM, Roelofs JGM, Lamers LPM. 2010. The interaction between decomposition, net N and P mineralization and their mobilization to the surface water in fens. Water Res. 44(11):3487–3495.
- Geurts JJM, van de Wouw PAG, Smolders AJP, Roelofs JGM, Lamers LPM. 2011. Ecological restoration on former agricultural soils: feasibility of in situ phosphate fixation as an alternative to top soil removal. Ecol Eng. 37(11):1620–1629.
- Gibbs MM, Hickey CW, Özkundakci D. 2011. Sustainable assessment and comparison of efficacy of four P-inactivation agents for managing internal phosphorus loads in lakes: sediment incubations. Hydrobiologia. 658(1):253–275.
- Gledhill DG, James P, Davies DH. 2008. Pond density as a determinant of aquatic species richness in an urban landscape. Landscape Ecol. 23(10):1219–1230.
- Golterman HL. 1975. Physiological limnology. An approach to the physiology of lake ecosystems. Amsterdam, the Netherlands: Elsevier Scientific Publishing Company.
- Gulati RD, Van Donk E. 2002. Lakes in the Netherlands, their origin, eutrophication and restoration: state-of-the-art review. Hydrobiologia. 478:73–106.
- Haghseresht F, Wang S, Do DD. 2009. A novel lanthanum-modified bentonite, Phoslock, for phosphate removal from wastewaters. Appl Clay Sci. 46(4):369–375.
- Hellström D, Jeppsson U, Kärrman E. 2000. A framework for systems analysis of sustainable urban water management. Environ Impact Asses. 20(3):311–321.
- Holdren GC, Jr, Armstrong DE. 1980. Factors affecting phosphorus release from intact lake sediment cores. Environ Sci Technol. 14(1):79–87.
- Hosper SH. 1989. Biomanipulation, new perspectives for restoration of shallow, eutrophic lakes in The Netherlands. Hydrobiol Bull. 23(1):5–10.
- Hupfer M, Zak D, Roßberg R, Herzog C, Pöthig R. 2009. Evaluation of a well-established sequential phosphorus fractionation technique for use in calcite-rich lake sediments: identification and prevention of artifacts due to apatite formation. Limnol Oceanogr Meth. 7(6):399–410.
- Institut Dr. Nowak. 2011. Sediment analyse Kleine Melanen. [Sediment analysis Kleine Melanen, in Dutch.]. Germany: Institut Dr. Nowak, Phoslock Europe GmbH.
- Janse JH. 2005. Model studies on the eutrophication of shallow lakes and ditches. PhD dissertation. Wageningen University, The Netherlands.
- Janse JH, De Senerpont Domis LN, Scheffer M, Lijklema L, Van Liere L, Klinge M, Mooij WM. 2008. Critical phosphorus loading of different types of shallow lakes and the consequences for management estimated with the ecosystem model PCLake. Limnologica. 38(3–4):203–219.
- Janse JH, Scheffer M, Lijklema L, Van Liere L, Sloot JS, Mooij WM. 2010. Estimating the critical phosphorus loading of shallow lakes with the ecosystem model PCLake: sensitivity, calibrations and uncertainty. Ecol Modell. 221(4):654–665.
- Jeppesen E, Søndergaard M, Lauridsen TL, Davidson TA, Liu Z, Mazzeo N, Trochine C, Özkan K, Jensen HS, Trolle D. 2012. Biomanipulation as a restoration tool to combat eutrophication: recent advances and future challenges. Adv Ecol Res. 47:411–488.
- Kalkman P. 2010. Rapportage afvissing Kleine Melanen te Bergen op Zoom. [Report fish removal Kleine Melanen at Bergen op Zoom, in Dutch.]. Moordrecht, The Netherlands: Visserijbedrijf P. Kalkman.
- Kim G, Jeong W, Choi S, Khim J. 2007. Sand capping for controlling phosphorus release from lake sediments. Environ Technol. 28(4):381–389.
- Lürling M, Mackay E, Reitzel K, Spears BM. 2016. Editorial – a critical perspective on geo-engineering for eutrophication management in lakes. Water Res. 97:1–10.
- Lürling M, Tolman Y. 2010. Effects of lanthanum and lanthanum-modified clay on growth, survival and reproduction of Daphnia magna. Water Res. 44(1):309–319.
- Lürling M, Van Oosterhout F. 2013. Controlling eutrophication by combined bloom precipitation and sediment phosphorus inactivation. Water Res. 47(17):6527–6537.
- Lürling M, Waajen G, Engels B, Van Oosterhout F. 2017. Effects of dredging and lanthanum-modified clay on water quality variables in an enclosure study in a hypertrophic pond. Water. 9(6):380. DOI:10.3390/w9060380.
- Lürling M, Waajen G, Van Oosterhout F. 2014. Humic substances interfere with phosphate removal by lanthanum modified clay in controlling eutrophication. Water Res. 54:78–88.
- Mathias JA, Barica J. 1980. Factors controlling oxygen depletion in ice-covered lakes. Can J Fish Aquat Sci. 37(2):185–194.
- Meijer M-L, De Boois I, Scheffer M, Hosper H. 1999. Biomanipulation in shallow lakes in The Netherlands: an evaluation of 18 case studies. Hydrobiologia. 408/409:13–30.
- Mohan RK, Brown MP, Barnes CR. 2000. Design criteria and theoretical basis for capping contaminated marine sediments. Appl Ocean Res. 22(2):85–93.
- Mooij WM, Trolle D, Jeppesen E, Arhonditsis G, Belolipetsky PV, Chitamwebwa DBR, Degermendzhy AG, DeAngelis DL, De Senerpont Domis LN, Downing AS, et al. 2010. Challenges and opportunities for integrating lake ecosystem modelling approaches. Aquat Ecol. 44(3):633–667.
- NNI. 2004. Water quality – Application of inductively coupled plasma mass spectrometry (ICP-MS) – Part 2: Determination of 62 elements. NEN-EN-ISO 17294-2, Netherlands Normalization Institute, Delft, The Netherlands.
- NNI. 2005a. Water – Monstervoorbehandeling voor de fotometrische bepaling van de som van de gehalten aan ammoniumstikstof en aan organisch gebonden stikstof en van het totale gehalte aan fosforverbindingen met een doorstroomanalysesysteem – Ontsluiting met zwavelzuur en kaliumsulfaat. [Water – Sample preparation for the photometric determination of the sum of the contents of ammoniacal and organically bound nitrogen and of the total content of phosphorus compounds by continuous flow analysis – Digestion with sulfuric acid and potassium sulphate. In Dutch.] NEN 6645, Netherlands Normalization Institute, Delft, The Netherlands.
- NNI. 2005b. Water quality – Determination of orthophosphate and total phosphorus contents by flow analysis (FIA and CFA) – Part 2: Method by continuous flow analysis (CFA) (ISO 15681-2; 2003, IDT). NEN-EN-ISO 15681-2, Netherlands Normalization Institute, Delft, The Netherlands.
- NNI. 2006a. Water - Fotometrische bepaling van het gehalte aan ammoniumstikstof en van de som van de gehalten aan ammoniumstikstof en aan organisch gebonden stikstof volgens Kjeldahl met behulp van een doorstroomanalysesysteem. [Water – Photometric determination of the content of ammonium nitrogen and of the sum of the contents of ammoniacal and organically bound nitrogen according to Kjeldahl by continuous flow analysis. In Dutch.] NEN 593 6646, Netherlands Normalization Institute, Delft, The Netherlands.
- NNI. 2006b. Water – Spectrofotometrische bepaling van het gehalte aan chlorofyl-a. [Water – Spectrophotometric determination of chlorophyll-a content. In Dutch.] NEN 6520, Netherlands Normalization Institute, Delft, The Netherlands.
- NNI. 2009. Water quality – Determination of selected elements by inductive coupled plasma optical emission spectrometry (ICP-OES) (ISO 11885: 2007). NEN-EN-ISO 11885, Netherlands Normalization Institute, Delft, The Netherlands.
- Pan G, Dai L, Li L, He L, Li H, Bi L, Gulati R. 2012. Reducing the recruitment of sedimented algae and nutrient release into the overlying water using modified soil/sand flocculation-capping in eutrophic lakes. Environ Sci Technol. 46(9):5077–5084.
- PBL. 2015. Website of the Netherlands Environmental Assessment Agency. Metamodel PCLake. Available from: http://themasites.pbl.nl/modellen/pclake/index.php. Accessed 14 January 2015.
- Petersen, JE, Kennedy VS, Dennison WC, Kemp WM, editors. 2009. Enclosed experimental ecosystems and scale: tools for understanding and managing coastal ecosystems. New York (NY): Springer.
- Psenner R, Pucsko R, Sager M. 1984. Die Fraktionierung organischer und anorganischer Phosphorverbindungen von Sedimenten. Versuch einer Definition ökologisch wichtiger Fraktionen. [Fractionation of organic and inorganic phosphorus compounds in lake sediments. An attempt to characterize ecologically important fractions. In German.]. Arch. Hydrobiol./Suppl. 70:111–155.
- Refsgaard JC, Van der Sluijs JP, Højberg AL, Vanrolleghem PA. 2007. Uncertainty in the environmental modelling process – a framework and guidance. Environ Modell Softw. 22(11):1543–1556.
- Reible DD, Lampert DJ. 2014. Chapter 12. Capping for remediation of contaminated sediments. In: Reible DD, editor. Processes, assessment and remediation of contaminated sediments. New York (NY): Springer Science + Business Media. p. 325–362.
- Reitzel K, Jensen HS, Egemose S. 2013. pH dependent dissolution of sediment aluminum in six Danish lakes treated with aluminum. Water Res. 47(3):1409–1420.
- Robb M, Greenop B, Goss Z, Douglas G, Adeney J. 2003. Application of Phoslock™, an innovative binding clay, to two Western Australian waterways: preliminary findings. Hydrobiologia. 494(1–3):237–243.
- Ross G, Haghseresht F, Cloete TM. 2008. The effect of pH and anoxia on the performance of Phoslock, a phosphorus binding clay. Harmful Algae. 7(4):545–550.
- Rydin E, Welch EB. 1999. Dosing alum to Wisconsin lake sediments based on in vitro formation of aluminum bound phosphate. J Lake Reserv Manag. 15(4):324–331.
- Scheffer M, Hosper SH, Meijer M-L, Moss B, Jeppesen E. 1993. Alternative equilibria in shallow lakes. Trends Ecol Evol (Amst). 8(8):275–279.
- Scheffer M, Van Nes EH. 2007. Shallow lakes theory revisited: various alternative regimes driven by climate, nutrients, depth and lake size. Hydrobiologia. 584(1):455–466.
- Schindler DW, Hecky RE, Findlay DL, Stainton MP, Parker BR, Paterson MJ, Beaty KG, Lyng M, Kasian SEM. 2008. Eutrophication of lakes cannot be controlled by reducing nitrogen input: results of a 37-year whole-ecosystem experiment. Proc Natl Acad Sci USA. 105(32):11254–11258.
- Smolders AJP, Lamers LPM, Lucassen ECHET, Van der Velde G, Roelofs JGM. 2006. Internal eutrophication: how it works and what to do about it – a review. Chem Ecol. 22(2):93–111.
- Smolders AJP, Lamers LPM, Moonen M, Zwaga K, Roelofs JGM. 2001. Controlling phosphate release from phosphate-enriched sediments by adding various iron compounds. Biogeochemistry. 54:219–228.
- Sneller FEC, Kalf DF, Weltje L, Van Wezel AP. 2000. Maximum permissible concentrations and negligible concentrations for rare earth elements (REEs). National Institute of Public Health and the Environment, Bilthoven, The Netherlands. RIVM report 601501 011.
- Søndergaard M, Jensen JP, Jeppesen E. 1999. Internal phosphorus loading in shallow Danish lakes. Hydrobiologia. 408/409:145–152.
- Søndergaard M, Jeppesen E, Lauridsen TL, Skov C, Van Nes EH, Roijackers R, Lammens E, Portielje R. 2007. Lake restoration: successes, failures and long-term effects. J Appl Ecol. 44(6):1095–1105.
- Spears BM, Dudley B, Reitzel K, Rydin E. 2013a. Geo-engineering in lakes–a call for consensus. Environ Sci Technol. 47(9):3953–3954.
- Spears BM, Lürling M, Yasseri S, Castro-Castellon AT, Gibbs M, Meis S, McDonald C, McIntosh J, Sleep D, Van Oosterhout F. 2013b. Lake responses following lanthanum-modified bentonite clay (Phoslock®) application: an analysis of water column lanthanum data from 16 case study lakes. Water Res. 47(15):5930–5942.
- Stal LJ. 2015. Nitrogen fixation in cyanobacteria. In: eLS. Chichester, UK: John Wiley & Sons, Ltd:, doi: 10.1002/9780470015902.a0021159.pub2.
- Steinman AD, Isely ES, Thompson K. 2015. Stormwater runoff to an impaired lake: impacts and solutions. Environ Monit Assess. 187(9):549.
- Ten Winkel EH, Davids C. 1985. Bioturbation by cyprinid fish affecting the food availability for predatory water mites. Oecologia. 67(2):218–219.
- Van de Plassche EJ. 2003. Voorstel voor een ad hoc maximaal toelaatbaar risiconiveau voor aluminium in oppervlaktewater. [Proposal for an ad hoc maximum permissible concentration level for aluminum in surface waters. In Dutch.] RWS-RIZA report L 1574.A0/R0002/EVDP/TL. Available from: http://www.google.nl/url?sa=t&rct=j&q=&esrc=s&source=web&cd=1&cad=rja&uact=8&ved=0CCEQFjAA&url=http%3A%2F%2Fwww.helpdeskwater.nl%2Fpublish%2Fpages%2F1077%2Fvoorstel_voor_een_adhoc_mtr_voor_aluminium_in_oppervlaktewater.pdf&ei=skCYVYvHEYP2Uo_-geAE&usg=AFQjCNF11sHXyGQTIr_ewEa1d3mkkSmIrw. Accessed 3 February 2017.
- Van der Wijngaardt T, Ter Heerdt G, Bakkum R, Van den Berg L, Brederveld B, Geurts J, Jaarsma N, Lamers L, Osté L, Poelen M. 2012. Baggernut, maatregelen. Baggeren en nutrienten. [Dredging and nutrients, measures. In Dutch.] STOWA-report 2012-40. Available from: http://stowa.nl/bibliotheek/publicaties/Baggernut__maatregelen__baggeren_en_nutrienten. Accessed 3 February 2017.
- Van Oosterhout F, Goitom E, Roessink I, Lürling M. 2014. Lanthanum from a modified clay used in eutrophication control is bioavailable to the marbled crayfish (Procambarus fallax f. virginalis). Plos One. 9(7):e102410. doi:10.1371/journal.pone.0102410.g001.
- Van Oosterhout F, Lürling M. 2011. Effects of the novel ‘Flock & Lock’ lake restoration technique on Daphnia in Lake Rauwbraken (The Netherlands). J Plankton Res. 33(2):255–263.
- Van Oosterhout F, Lürling M. 2013. The effect of phosphorus binding clay (Phoslock®) in mitigating cyanobacterial nuisance: a laboratory study on the effects on water quality variables and plankton. Hydrobiologia. 710(1):265–277.
- Waajen GWAM, Faassen EJ, Lürling M. 2014. Eutrophic urban ponds suffer from cyanobacterial blooms: Dutch examples. Environ Sci Pollut Res. 21(16):9983–9994.
- Waltjé E, Haverkamp S, Steketee J. 2009. Waterbodemonderzoek Groote en Kleine Melanen en Ganzenvijvers. [Sediment research Groote and Kleine Melanen and Ganzenvijvers. In Dutch.] Eindhoven, The Netherlands: Tauw bv Consultancy.
- Waschbusch RJ, Selbig WR, Bannerman RT. 2000. Sources of phosphorus in storm water and street dirt from two urban residential basins in Madison, Wisconsin, 1994–95. In: Proceedings, National Conference on Tools for Urban Water Resource Management and Protection, February 7–10, 2000, Chicago, IL. Cincinnati (OH): US Environmental Protection Agency.
- Yuan X, Pan G, Chen H, Tian B. 2009. Phosphorus fixation in lake sediments using LaCl3-modified clays. Ecol Eng. 35(11):1599–1602.