
 ?Mathematical formulae have been encoded as MathML and are displayed in this HTML version using MathJax in order to improve their display. Uncheck the box to turn MathJax off. This feature requires Javascript. Click on a formula to zoom.
Abstract
Small GE, Niederluecke EQ, Shrestha P, Janke BD, Finlay JC. The effects of infiltration-based stormwater best management practices on the hydrology and phosphorus budget of a eutrophic urban lake. Lake Reserv Manage. 35:38–50.
Urban lakes can provide a variety of ecosystem services but managing water quality in urban environments is a challenge due to greatly altered hydrology and nutrient cycling. Stormwater best management practices (BMPs) are commonly used to reduce inputs of total phosphorus (TP) to urban lakes through interception and infiltration of stormwater runoff. However, the indirect effects of stormwater infiltration on urban lake water quality are not well understood. We used a heuristic hydrology and phosphorus model of an urban lake to explore how changes in hydraulic flushing due to stormwater management can affect water quality. We applied the model to Como Lake, a 28 ha shallow lake in Saint Paul, Minnesota, USA, which is impaired due to excess TP. The model was calibrated using 17 yr of data, including 10 yr post-BMP implementation. We then used the model to estimate the effect of a range of simulated BMP implementations on the lake’s hydrology and P budget. BMP implementation reduced external TP loads to the lake, but reductions in water-column TP concentrations were partially undermined by reduced flushing in the summer months, when water column concentrations were highest, leading to reduced downstream TP export and the increased relative importance of evaporation. While the benefits of BMPs can often extend beyond lake P management, these results suggest that simply quantifying reductions in TP loading due to BMPs while ignoring altered hydrology could lead to overestimating water quality benefits.
Introduction
Urban lakes can serve as important recreational and esthetic amenities, contributing to the quality of life in cities (Bolund and Hunhammar Citation1999). Managing water quality in urban lakes is difficult in these environments where hydrology and nutrient cycling have been greatly altered. Phosphorus (P) from sources such as lawns, leaves, and pet waste (Fissore et al. Citation2011) is transported into lakes, primarily during storm events (Janke et al. Citation2014). Urban stormwater can have higher total phosphorus (TP) loads per unit area compared to fertilized agricultural fields (Ghane et al. Citation2016). Additionally, decomposition of organic matter in sediments and the release of P from these sediments to the water column—known as internal loading—can be a major contributor to dissolved P in lake water. Excess P in lakes can fuel algae blooms, degrading water quality and diminishing the esthetic and recreational value of these lakes (Carpenter et al. Citation1998). Despite costly efforts to control external P inputs to urban lakes, improvements to water quality have been limited in many cases (Sharpley et al. Citation2013).
To improve water quality in urban lakes, best-management practices (BMPs) are often used to reduce P loads by intercepting and infiltrating stormwater runoff in the upstream watershed. These projects can result in less flashy hydrology (Pennino et al. Citation2016), but the cost of P removal can be expensive ($40,000–$165,000 per kg of annual P removal; Nobles et al. Citation2017). Despite reduced external P inputs due to BMP implementation, improvements in urban lake water quality have been limited in many cases, in part due to residual internal loading (Søndergaard et al. Citation2013). The purpose of this paper is to explore another possible mechanism that could undermine improvements in water quality following stormwater BMP implementation: that increased infiltration from BMPs may lead to reduced flushing, which could act to concentrate water column TP in summer months, when sediment P release and evaporation are highest.
An influx of high-P stormwater into an urban lake often is associated with a high outflow of water from the lake, transporting some fraction of the lake’s dissolved and suspended P downstream, and thus partially offsetting the effect of this added P on lake total P concentration. The effects of hydraulic flushing on lake water quality have been previously demonstrated. The fraction of external P inputs that are exported downstream is known to increase with increased lake flushing rates (Lathrop and Carpenter Citation2014). Lakes with high P loading rates may not be eutrophic if high flushing rates limit algal accrual (Dillon Citation1975). Conversely, eutrophication can be accelerated due to decreased flushing during dry years (Rippey et al. Citation1997). Lakes with low flushing rates (i.e., high evaporation:inflow ratios) are known to concentrate solutes through evaporation (Novotny and Stefan Citation2010). Hydraulic flushing (with low-P water) has been used (Hosper and Meyer Citation1986) or recommended (Spears et al. Citation2007) as a management tool in some polluted lakes.
To explore the potential effects of increased infiltration due to stormwater BMP implementation on external TP loading and TP export from an urban lake, we applied a simple lake phosphorus model (Jensen et al. Citation2006) to an urban lake in Saint Paul, Minnesota, which has been the target of extensive P management efforts in recent years. We calibrated the model using 17 yr of lake level and TP data, and then used this heuristic model to explore the effects of stormwater BMP implementation and watershed characteristics on external TP loading to the lake, TP export from the lake, and lake TP concentration.
Materials and methods
Study site
Como Lake in Saint Paul is among the most visited lakes in Minnesota with approximately 4.5 million visits per year (Metropolitan Council Citation2013). It has been classified as impaired due to excessive levels of chlorophyll and TP since 2002 (CRWD Citation2010). The lake has surface-water growing-season means (Jun–Sep 1998–2007) of 173 µg/L TP, 25 µg/L Chl-a, and 1.6 m Secchi disk transparency (CRWD Citation2010). The 29 ha lake has a maximum depth of 4.7 m, a mean depth of 2.2 m, and a watershed area to lake area ratio of 25. Approximately 93% of the lake area is littoral and generally well mixed. The lake can temporarily stratify in the growing season resulting in anoxic conditions below 3–4 m, although this represents a small fraction of total lake area. The lake’s 751 ha watershed has approximately 50% impervious surface cover (). The majority of water enters the lake through a closed drainage piped system consisting of 22 storm sewers discharging directly into the lake (CRWD Citation2010). A 91 cm (36 inch) submerged outlet flows into a manhole with a 2.44 m (8 foot) weir and stop-logs, which control the normal water level (CRWD Citation2010).
Figure 1. (A) Location of Como Lake in Saint Paul, MN. (B) The 721 ha watershed includes a regional park and single-family residential neighborhoods. (C) Impervious surface cover varies across the watershed.
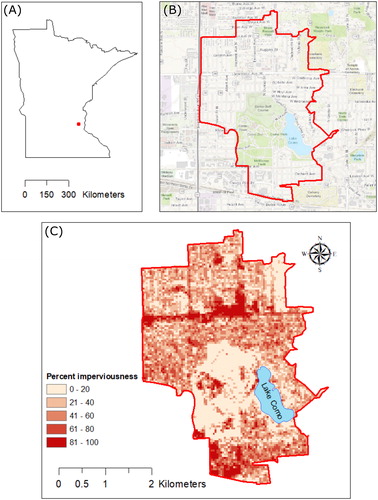
A variety of efforts have been made to improve water quality in the lake through load reductions. Restrictions on use of lawn fertilizer in the 7-county metro area since 2004 have led to reduced P application throughout the watershed. The Capitol Region Watershed District (CRWD) has funded various projects designed to reduce stormwater runoff and associated P loading from the watershed. Between 2004 and 2006, CRWD installed 8 rain gardens, 8 underground infiltration trenches, an underground stormwater storage and infiltration system, and a regional stormwater pond in the Como 7 sub-watershed for a total construction cost of $2.7 million. These BMPs are nested and have a cumulative drainage area of approximately 77 ha, or 10.2% of the watershed area. They infiltrate approximately 93% of stormwater volume and 96% of TP load from this sub-watershed, intercepting approximately 35 kg of P each year (CRWD Citation2012). Additional BMPs have been installed in the watershed each year (CRWD 2018). Most of these projects were small residential raingardens, but larger infiltration trenches were installed in 2008, 2010, and 2016. The total drainage area of BMPs implemented between 2007 and 2017 is approximately 21 ha (CRWD 2018).
Leaves and other plant debris represent a significant source of P load into the lake (Bratt et al. Citation2017, Hobbie et al. Citation2017). A neighborhood grassroots effort to remove leaves from curbsides each fall supplements municipal street sweeping, which occurs only once during the fall and once during the spring in much of the watershed. The neighborhood curb cleanup is estimated to prevent ∼6 kg of P entering the lake each year (CACN Citation2018).
Approximately 283 kg P enters Como Lake from the watershed annually. Internal loads are estimated at 549 kg P/year (CRWD Citation2010). The Como Lake TMDL (CRWD Citation2010) calls for a 60% reduction of external loads, and a 97% reduction of internal loads, in order to achieve water quality standards for shallow lakes in the North Central Hardwood Forest Ecoregion (TP < 60 µg/L). Despite the lawn fertilizer ban and BMP implementation, lake TP levels remain well above the regulatory threshold, characteristically rising throughout the summer (). Interannual variability is also high, as water quality in the lake has historically fluctuated between fair and poor at intervals of 5–6 yr (Noonan Citation1998), potentially due to a combination of climatic and land use factors.
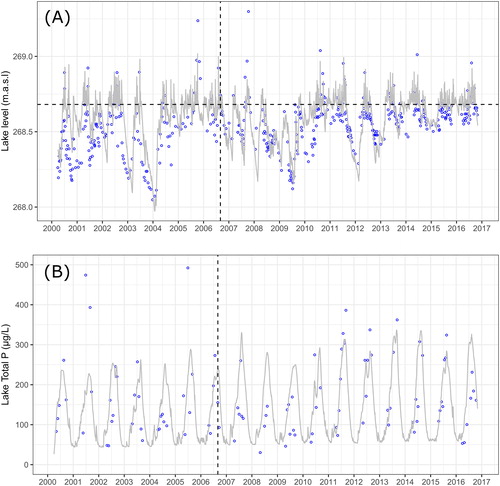
Figure 2. Comparison of model (Baseline Scenario) and observed values for lake level (A) and water-column total P (B). Circles are observed values. The horizontal dashed line represents the ordinary high-water level. The vertical dashed line represents the date of stormwater BMP implementation in our simulation.
Model development
We used a simple phosphorus model previously developed and validated for shallow, eutrophic, unstratified lakes (Jensen et al. Citation2006) as the basis for our heuristic phosphorus management model for Como Lake. This zero-dimensional model (i.e., the lake is assumed to be homogeneous) consisted of hydrology and phosphorus submodels.
Hydrology submodel
The hydrology submodel simulated lake volume according to the following equation:
(1)
(1)
where Qinm represents inputs from basin runoff, Qoutm represents measured outflow from the lake, Prec is direct precipitation on the lake, Evap is evaporation from the lake surface, Vdif is the daily variation in lake volume, and Qinu and Qoutu are unmeasured inflow and ouflow through the lake (e.g., through groundwater exchange).
Lake area was assumed to be constant, so that changes in volume resulted in changes in lake level. We used daily precipitation data from the University of Minnesota St. Paul Campus Climatological Observatory, ∼5 km from Como Lake, to calculate direct rainfall volume onto the lake surface and runoff volume from the watershed based on the runoff coefficient. We used a runoff coefficient of 0.16, based on reported values for the Arlington-Hamline sub-watershed (in the Como Lake watershed) and the Trout Brook West Branch (which encompasses the Como Lake watershed) (Janke et al. Citation2014). We included spring snowmelt in the runoff term, based on the daily decrease in reported snow depth, assuming water content of 20% for the snowpack during the time of snowmelt (Shulski and Seeley Citation2001). For 2002–2009, snow depth measurements were not available, so we used the average annual runoff from snowmelt from other years, applied over days in which the daily high temperature exceeded 0 C. From 2009 to 2016, estimated snowmelt runoff had a mean of 9.5 cm and standard deviation of 7.5 cm. Over the entire simulation period, snowmelt accounted for 11.8% of total runoff.
Daily measured pan evaporation values from the University of Minnesota Climatological Observatory were used to estimate lake evaporation (Linacre Citation2002), multiplying pan evaporation rates by a factor of 0.8 (Dadaser-Celik and Stefan Citation2008).
Measured outflow (Qoutm) was modeled based on lake level. Lake volume was divided by lake area to calculate lake levels, which were converted into height above sea level. Measured outflow occurs only when lake level exceeds the height of the outflow weir at 268.68 m (881.5 feet) above sea level. Measured outflow was modeled as a function of lake level based on the rating curve for the outflow structure (CRWD unpubl. data).
The net value of unmeasured inflow (Qinu) and unmeasured outflow (Qoutu) was estimated, following Jensen et al. (Citation2006), by fitting the model to 486 lake level observations over the 17 yr period; Qinu was assumed to be 0, and Qoutu was parameterized separately for 2 different time periods (1550 m3/d for 2000–2010 and 1050 m3/d for 2010–2016) in order to improve model fit.
Phosphorus submodel
The P submodel has 2 state variables: TP in the water column, and exchangeable P in the lake sediment. The dynamics of lake TP are given by the difference between input and output from the lake, and from exchange with lake sediment through sedimentation and release.
(2)
(2)
where Q is discharge into the lake (m3/d), V is lake volume (m3), Pl is in-lake TP (g/m2), Pi is inlet TP (g/m2), SED is sedimentation of P (g/m2/d), REL is sediment release of P to lake water (g/m2/d), fd is the fraction of Pi entering the lake water pool (the rest enters the sediment pool) and was set at 0.3 based on available stormwater data from the watershed (J. Finlay, unpubl. data), and ATM is atmospheric deposition of P in the lake from rain and dust, which were represented as a small constant value, based on the value reported in the TMDL (22.7 g/d). We note that the ATM input was not included by Jensen et al. (Citation2006), but has been included in other similar models of eutrophic lake P dynamics (e.g., Ruley and Rusch Citation2004). We modeled Pi as varying seasonally between 30 and 70 μg/L, based on multiple years of stormwater sampling in the watershed (J. Finlay, unpubl. data). Runoff TP concentrations in the watershed show annual peaks in the early spring due to snowmelt, in early summer due to pollen and other plant material, and in the fall due to fallen leaves (Bratt et al. Citation2017).
Change in sediment TP (PS) is given by the following equation:
(3)
(3)
The sedimentation of TP is calculated as a constant (bS) multiplied by in-lake TP. The temperature dependence of this process is modeled as
(4)
(4)
where tS is the temperature correction for bS, T is lake water temperature (C), and Z is mean lake depth (m). Daily lake temperature was based on interpolations between biweekly observations from data collected by the Minnesota Pollution Control Agency.
Release of P from sediment is a first order reaction:
(5)
(5)
where bF is a constant, tF is the temperature correction for bF, and Ps is the mass of exchangeable P in the sediment. We used the parameter values fit by Jensen et al. (Citation2006) for tS (0), bF (0.000595/d), and tF (0.08). Sedimentation rate (bS) and initial concentration of P in sediment (Ps) were calibrated for Como Lake. Sedimentation rate was set at 0.20 m/d and initial sediment P concentration was set at 55 g/m2, which is approximately the mid-range of the Ps values for the 16 lakes modeled by Jensen et al. (Citation2006; ).
Table 1. Parameter values used in this model. Pi and PS values were calibrated for this model; all other values are from Jensen et al. (Citation2006).
The model does not explicitly include other biological factors such as P uptake/release by submerged macrophytes, P sequestration and release in phytoplankton, zooplankton, and fish, and sediment P release mediated by benthivorous fishes. These and other model assumptions are evaluated in the Discussion.
For simplicity, we simulated the major stormwater infiltration BMP projects of 2004–2006 being implemented at a single date in fall 2006 (simulation day 2345), and we did not explicitly include the smaller BMP projects that were implemented post-2006. We simulated the stormwater BMPs as an effective reduction of the watershed area, as the 77 ha of nested stormwater BMPs removed nearly all stormwater volume and TP load associated with this area (CRWD Citation2012).
The model was implemented in Stella Architect (ISEE Systems, Lebanon, New Hampshire), using the Euler integration routine, with dt = 1 d. We simulated a 17 yr period from 1 April 2000 to 31 October 2016 (6059 d), which includes 6 yr before stormwater BMP implementation and 10 yr post-BMP implementation.
Sensitivity analyses and model scenarios
We measured the sensitivity of the model to 3 main assumptions: (1) infiltrated groundwater (from the BMP or elsewhere in the watershed is not returned to the lake; (2) unmeasured outflow (Qoutm) is due to downstream flow, removing lake TP; and (3) that runoff TP concentrations vary seasonally. In the first sensitivity analysis (SA1), we simulated the effect of returning infiltrated water to the lake through groundwater flow. We calculated the total volume of runoff intercepted by the BMPs from 2006 (when installed) through 2016, and added this total volume of water back to the lake at a constant daily rate at a TP concentration of 30 µg/L (the observed concentration for baseflow in the stormwater system, Janke et al. Citation2014). In the second sensitivity analysis (SA2), we simulated the effect of Qoutm being due to evaporation, and thus not removing P from the lake. In SA3, we simulated the effect of using a constant value of 557 μg/L, the event mean concentration from 8 yr of observations at a stormwater monitoring site in the lakeshed.
We then used this model to explore the effects of 3 alternative management scenarios in the watershed on lake water TP concentrations. We assessed the effect of BMP implementation (which was accounted for in the baseline model) on lake water quality and P budget (Scenario A), by running the simulation without BMPs by maintaining a constant watershed area for the entire simulation. In Scenario B, we analyzed the effect of a larger-scale BMP implementation in this watershed. We simulated a 5-fold increase in the area of the watershed that drains into stormwater BMPs (385 ha, or 53% of the watershed area), using the same 2006 implementation date. As with the baseline scenario, we assumed no unmeasured inflow (infiltrated water was assumed to not enter the lake), and unmeasured outflow was set at 0 following the BMP implementation date. In Scenario C, we simulated a 50% reduction in the seasonally varying runoff TP concentration, with no additional stormwater infiltration (i.e., the hydrology is unchanged from the baseline scenario). Such a reduction could arise through enhanced street sweeping (Kalinosky Citation2015) or a large-scale reduction in tree canopy cover, which is a major source of P to runoff (Bratt et al. Citation2017, Janke et al. Citation2017). We simulated the reduction in runoff TP concentration coinciding with the date of BMP implementation in 2006, to facilitate comparisons across simulations.
To compare the baseline scenario, SA1, SA2, and SA3, we calculated mean lake water column TP concentration (the mean of the daily modeled values), and root mean squared error (RMSE) for observed and modeled values. To compare the effects of Scenarios A, B, and C, we calculated mean lake water column TP concentration, cumulative external P inputs, and downstream P export, over a 10 yr period following BMP implementation (1 Nov 2006–31 Oct 2017).
Results
Model validation
Modeled lake levels corresponded reasonably well to observations (). Of the 385 observations, 368 were correctly predicted as being either above or below the height of the weir (ordinary high water level), at 268.68 m above sea level. Modeled lake level had an RMSE of 0.425 m. The modeled lake water column total P concentration shows seasonal increases that are generally consistent in timing and magnitude with observed values (). Modeled lake TP concentrations exceed observed concentrations during the summers of 2004, 2008, 2009, and 2016, and several high observed TP values in 2001 and 2005 were not accounted for by the model. Modeled TP concentrations had an RMSE of 218.8 μg/L. Overall, interannual variability in maximum observed TP values was greater among observed values compared to the model. This discrepancy could be partially attributed to spatial heterogeneity in lake TP concentrations, perhaps due to temporary vertical stratification (we used observed TP values from ∼2.0 m depth, collected above one of the deepest points in the lake) or a recent influx of high-P runoff that had not yet fully mixed with the lake.
Sensitivity analyses and model scenarios
Returning infiltrated water to the lake as groundwater with a TP concentration of 30 µg/L (SA1) resulted in a slight improvement in model fit (lake TP RMSE =207.6), and a decline in mean lake TP of 3.5 µg/L (). This influx of P (via the additional groundwater) represented 6% of the total external P input to the lake. Attributing unmeasured outflow to evaporation rather than downstream export (SA2) resulted in a decrease in model fit (RMSE = 224.6) and a mean lake TP increase of 6.7 µg/L (). Assuming a constant, rather than seasonally varying, runoff TP concentration (SA3) led to a slight decrease in model fit (RMSE = 217.9) and a small increase (1.5 µg/L) in mean lake TP (). Generally, the model behavior was not sensitive to these assumptions ().
Figure 3. (A) Lake water column total P in the baseline scenario and in Sensitivity Analyses 1–3. The dashed line represents the date of stormwater BMP implementation in our simulations. The shaded area (2015–2016) is expanded in (B) to better depict representative differences between scenarios.
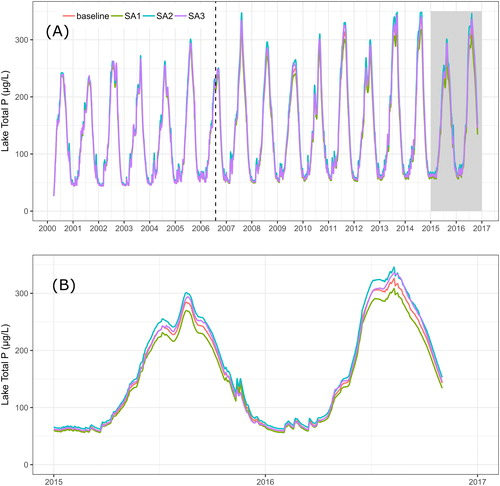
Table 2. Sensitivity analyses testing effects of central assumptions of model. Model simulation period 2000–2016.
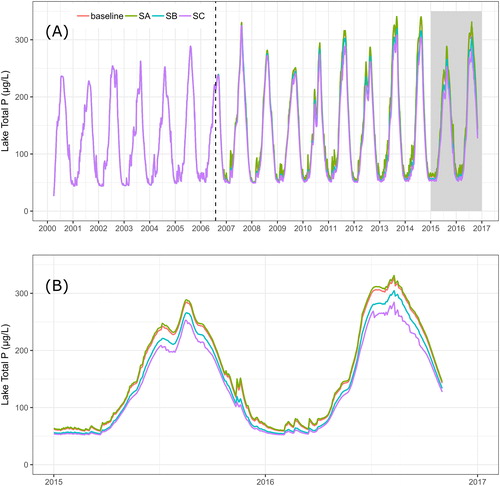
Simulating the watershed in the absence of stormwater BMP implementation (Scenario A) led to a mean lake TP concentration of 147.8 µg/L from 2006 to 2016, 2.2 µg/L higher than the baseline scenario (). The 77 ha of stormwater BMPs prevented 618 kg of P from entering Como Lake between 2006 and 2016, which is a 10.5% decrease in P loading. However, the BMP implementation reduced downstream P export by 232 kg (a 12.4% decrease) during this period because of reduced outflow, and the fraction of lake inflow lost by evaporation increased from 28.0% to 30.8%. Both of these factors partially offset gains in lake water quality. Downstream P export accounted for 32% of external P inputs to the lake, while storage as sediment accounted for 67.9% of these P inputs ().
Table 3. Summary of model scenarios. Mean concentrations and cumulative fluxes are calculated for the 10 yr period following BMP implementation.
Simulating a 5-fold increase in watershed area draining into stormwater BMPs (Scenario B) resulted in a decrease in mean lake TP of 11.6 µg/L relative to Scenario A (). Cumulative external P inputs were 3088 kg lower than the scenario with no BMPs (a 52% decrease), and downstream P export declined by 1170 kg (a 59% decrease). The fraction of lake water inflow lost through evaporation increased from 28.0% to 49.3%. Downstream P export was 32% of the magnitude of external P inputs to the lake, while storage as sediment accounted for 71.9% of these P inputs ().
Decreasing runoff TP concentration by 50% (Scenario C) led to the greatest decrease in lake TP (), with a mean value of 130.3 µg/L. In this scenario, while external P inputs were cut in half relative to SA4, downstream P export decreased by only 24%. Sediment P storage accounted by 46.5% of external P inputs, and the fraction of lake water inflow lost through evaporation remained at 30.8% ().
Figure 4. Lake water column total P in the baseline scenario and in Scenarios A, B, and C. The dashed line represents the date of stormwater BMP implementation in our simulations. The shaded area (2015–2016) is expanded in (B) to better depict representative differences between scenarios.
Discussion
The late systems scientist Donnella Meadows noted that, while humans have a tendency to try to control systems by managing inputs, we often forget how important outputs can be in controlling important variables (Meadows Citation2008). Our analysis illustrates how improvements in urban lake water quality resulting from stormwater BMPs could be partially undermined by altered hydrology. Runoff from snowmelt and storm events in the spring and early summer contributes to the seasonal rise in lake TP concentration, although these inputs are typically associated with increased outflow from the lake, exporting P downstream and partially offsetting the influx of P. In contrast, during the late summer, there are frequently long periods with no measured outflow from the lake. Because of warm temperatures, rates of both P release from sediments and evaporation are highest, effectively concentrating this P in the water column. These high late-summer lake TP concentrations exceed the non-sediment fraction of stormwater runoff, so any flushing events during this time effectively dilute lake water column TP. In our simulations, increasing the amount of BMP stormwater infiltration increases this hydrologic concentration of lake TP, even while reducing external TP loads. A comparison of Scenario B (expanding stormwater BMPs to half of the watershed) and Scenario C (decreasing runoff TP concentration without influencing hydrology) is illustrative; both cut external P loading nearly in half relative to Scenario A, but Scenario C is less influenced by evaporation, and exports more P downstream, resulting in a mean water column TP that is 5.9 µg/L lower. Reductions in runoff TP without hydrologic alterations may be achieved through management activities such as modified street-sweeping protocols (Kalinosky Citation2015, Bratt et al. Citation2017).
Although our analysis focuses on the potential effects of stormwater infiltration from BMPs on downstream P export, we note several important caveats. First, BMPs may have important functions beyond reducing external P loading to lakes, such as providing flood control (Petit-Boix et al. Citation2017), nitrogen removal (Koch et al. Citation2014), esthetics (Thompson et al. Citation2017), and wildlife habitat (McGuckin and Brown Citation1995). Second, while downstream flushing of P represents removal of P from the lake, this process represents a source of P to downstream aquatic ecosystems. Thus P intercepted through BMPs ultimately provides benefits to local and more distant downstream ecosystems. Nevertheless, if improving urban lake water quality is a primary goal of stormwater BMPs, it is important to consider the influence of the BMPs on hydraulic flushing rates of that lake. Our results suggest that measuring the success of stormwater BMPs solely in terms of kg of P intercepted per year is likely to overestimate the impact of BMPs on lake water column TP.
It is notable that the amplitude of these seasonal oscillations in lake TP concentration were not dampened substantially in any of these scenarios (), due to the magnitude of internal P loading, underscoring the difficulties in managing urban lake water quality. Also, sediment P increased by >1000 kg over 10 yr in all scenarios, despite dramatic reductions in external loading, suggesting that internal loading is likely to become even more severe in the coming years. Increasing summer temperatures as a result of climate change are likely to increase rates of internal loading through a combination of increased mineralization rates and longer periods of stratification, creating anoxic conditions that drive P desorption from sediment (Jeppesen et al. Citation2009). An increased occurrence of intense rain events (Melillo et al. Citation2014) could also lead to increased external P inputs as well as increased flushing rates. Our scenarios focused on the effects of controlling external P loading in a lake with extensive internal loading, but if internal loading were mitigated (e.g., through alum treatment, sediment capping, sediment dredging, or the gradual exhaustion of the excess P content in the sediment), then the water quality benefits of BMP implementation would be more pronounced.
The model performed reasonably well across 17 yr that encompassed a range of climatic conditions and the implementation of the stormwater BMPs. Jensen et al. (Citation2006) applied this simple empirical model to 16 shallow, eutrophic Danish lakes and showed that it was successful in predicting seasonal TP dynamics. The largest area of uncertainty in our simulations concerns groundwater exchange. Following the approach used by Jensen et al. (Citation2006), we estimated a net value for Qoutu and Qinu to balance the lake’s hydrologic budget, which led to assuming a value of 0 for Qinu. Additional groundwater exchange that we did not account for would alter the results somewhat, as illustrated in SA1. While the baseline scenario assumes that water and P that is captured by BMPs is lost to the lake (consistent with findings of Fanelli et al. Citation2017), in some cases BMPs can result in increased baseflow (Loperfido et al. Citation2014), and because of the complexity associated with subsurface flows, the effects of BMPs on watershed hydrology can be difficult to model with accuracy (Hamel et al. Citation2013, Lim and Welty Citation2017). SA1 simulates an increased baseflow, as all infiltrated water is returned to the lake at a lower TP concentration, and results in a slightly lower mean lake TP as a result. The actual fate of infiltrated water may be somewhere in between these 2 extremes and may potentially also alter the timing of water movement in the watershed, which would also impact flushing of TP due to the strong seasonality of water column P. Additionally, we used a groundwater TP concentration measured from baseflow in storm sewers in the watershed (Janke et al. Citation2014), but if stormwater BMPs altered groundwater TP concentration, this would represent another source of error. Regardless of this uncertainty, the model functions effectively as a heuristic tool to explore the potential effects of stormwater BMP implementation on lake hydraulic flushing, and the lake’s P budget.
Many other factors that directly or indirectly control P fluxes within the lake were not explicitly included in this model, such as spatial heterogeneity in sediment redox conditions, uptake and release of dissolved P by macrophytes, P storage and mineralization by phytoplankton, zooplankton, and fish, and the role of bottom-feeding fish in disturbing sediment and releasing P back into the water column. These factors could potentially explain discrepancies between model output and observed values. However, it is unlikely that adding additional complexity to this model would have qualitatively changed these relationships. The results could be generalizable to a range of other urban lakes. Our simulation focused on a shallow, polymictic lake. The effects of climate and BMPs on stratified lakes would likely be more complex and would be an interesting topic for future exploration.
The results of our analysis illustrate the importance of considering hydrology in lake P management. Because external P loading is generally coupled with storm events, P inputs are temporally associated with P outputs as water flows downstream. This downstream loss of P partially offsets the external P loading, especially if the stormwater P concentrations are similar to lake water P concentrations. Urban lake P management is often focused on reducing stormwater inputs, with benchmarks aimed at reducing P fluxes to the lake. However, our simulation illustrates how these efforts may partially undermine potential reductions in lake total P concentrations by reducing the flushing of the lake. Where improvements in lake water quality are a stated goal, managers should take a more holistic approach to assessing the effects of BMPs on urban lake water quality, to include not only the direct effects of reduced external P loading but also the indirect effects on lake P as a result of altered hydrology.
Acknowledgments
Bob Fossum and Britta Belden provided helpful comments on an earlier version of this manuscript. The authors have no competing interests to declare. This research was supported in part by a grant from the U.S. Environmental Protection Agency to G.E.S. (Award # SU-83572501-0).
References
- Bolund P, Hunhammar S. 1999. Ecosystem services in urban areas. Ecol Econ. 29(2):293–301.
- Bratt AR, Finlay JC, Hobbie SE, Janke BD, Worm AC, Kemmitt K. 2017. Contribution of leaf litter to nutrient export during winter months in an urban residential watershed. Environ Sci Technol. 51(6):3138–3147.
- CACN. 2018. Como Active Citizen Network. www.comoacn.org/about.
- Carpenter SR, Caraco NF, Correll DL, Howarth RW, Sharpley AN, Smith VH. 1998. Nonpoint pollution of surface waters with phosphorus and nitrogen. Ecol Appl. 8:559–568.
- CRWD. 2010. Capitol Region Watershed District. Como Lake TMDL. https://www.pca.state.mn.us/sites/default/files/wq-iw11-05e.pdf.
- CRWD. 2012. Capitol Region Watershed District. Capitol Region Watershed District BMP Performance and Cost-Benefit Analysis: Arlington Pascal Project 2007–2010. http://www.capitolregionwd.org/wp-content/uploads/2012/09/2007_2010_BMP_Performance_MainBody.pdf.
- CRWD. 2018. Capitol Region Watershed District Map Viewer. http://crwd.maps.arcgis.com/apps/webappviewer/index.html?id = 44ddc5553af0490b835f206e180c5161.
- Dadaser-Celik F, Stefan HG. 2008. Lake evaporation response to climate in Minnesota. Prepared for Legislative Citizens Committee on Minnesota Resources, St. Paul, Minnesota. https://www.lccmr.leg.mn/projects/2006/finals/2006_07_appx-d_lake_evaporation.pdf.
- Dillon PJ. 1975. The phosphorus budget of Cameron Lake, Ontario: The importance of flushing rate to the degree of eutrophy of lakes. Limnol Oceanogr. 20(1):28–39.
- Fanelli R, Prestegaard K, Palmer M. 2017. Evaluation of infiltration-based stormwater management to restore hydrological processes in urban headwater streams. Hydrol Process. 31(19):3306–3319.
- Fissore C, Baker LA, Hobbie SE, King JY, McFadden JP, Nelson KC, Jakobsdottir I. 2011. Carbon, nitrogen, and phosphorus fluxes in household ecosystems in the Minneapolis-Saint Paul, Minnesota, urban region. Ecol Appl. 21(3):619–639.
- Ghane E, Ranaivoson AZ, Feyereisen GW, Rosen CJ, Moncrief JF. 2016. Comparison of contaminant transport in agricultural drainage water and urban stormwater runoff. Plos One. 11(12):e0167834.
- Hamel P, Daly E, Fletcher TD. 2013. Source-control stormwater management for mitigating the impacts of urbanization on baseflow: a review. J Hydrol. 485:201–211.
- Hobbie SE, Finlay JC, Janke BD, Nidzgorski DA, Millet DB, Baker LA. 2017. Contrasting nitrogen and phosphorus budgets in urban watersheds and implications for managing urban water pollution. Proc Natl Acad Sci USA. 114(16):4177–4182.
- Hosper H, Meyer ML. 1986. Control of phosphorus loading and flushing as restoration methods for Lake Veluwe, The Netherlands. Hydrol Bull. 20(1–2):183–194.
- Janke BD, Finlay JC, Hobbie SE. 2017. Trees and streets as drivers of urban stormwater nutrient pollution. Environ Sci Technol. 51:9569–9579.
- Janke BD, Finlay JC, Hobbie SE, Baker LA, Sterner RW, Nidzgorski D, Wilson BN. 2014. Contrasting influences of stormwater and baseflow pathways on nitrogen and phosphorus export from an urban watershed. Biogeochemistry. 121(1):209–228.
- Jensen JP, Pedersen AR, Jeppesen E, Søndergaard M. 2006. An empirical model describing the seasonal dynamics of phosphorus in 16 shallow eutrophic lakes after external loading reduction. Limnol Oceanogr. 51(1, part 2):791–800.
- Jeppesen E, Kronvang B, Meerhoff M, Søndergaard M, Hansen KM, Andersen HE, Lauridsen TL, Liboriussen L, Beklioglu M, Ozen A, Olesen JE. 2009. Climate change effects on runoff, catchment phosphorus loading and lake ecological state, and potential adaptations. J Environ Qual. 38(5):1930–1941.
- Kalinosky PM. 2015. Quantifying solids and nutrient recovered through street sweeping in a suburban watershed. MS thesis. St. Paul, MN: University of Minnesota. Retrieved from the University of Minnesota Digital Conservancy, http://hdl.handle.net/11299/172600.
- Koch BJ, Febria CM, Gevrey M, Wainger LA, Palmer MA. 2014. Nitrogen removal by stormwater management structures: a data synthesis. J Am Water Resour Assoc. 50(6):1594–1607.
- Lathrop RC, Carpenter SR. 2014. Water quality implications from three decades of phosphorus loads and trophic dynamics in the Yahara chain of lakes. IW. 4(1):1–14.
- Lim TC, Welty C. 2017. Effects of spatial configuration of imperviousness and green infrastructure networks on hydrologic response in a residential sewershed. Water Resour Res. 53(9):8084–8104.
- Linacre E. 2002. Ratio of lake to pan evaporation rates. Technical report, University of Wyoming. http://www-das.uwyo.edu/∼geerts/cwx/notes/chap04/eoep.html.
- Loperfido JV, Noe GB, Jarnagin ST, Hogan DM. 2014. Effects of distributed and centralized stormwater best management practices and land cover on urban stream hydrology at the catchment scale. J Hydrol. 519:2584–2595.
- McGuckin CP, Brown RD. 1995. A landscape ecological model for wildlife enhancement of stormwater management practices in urban greenways. Landscape Urban Plan. 33(1–3):227–246.
- Meadows DA. 2008. Thinking in systems: a primer. White River Junction (VT): Chelsea Green Publishing.
- Melillo JM, Richmond TC, Yohe GW. 2014. Climate change impacts in the United States: The Third National Climate Assessment. U.S. Global Change Research Program.
- Metropolitan Council. 2013. Annual use estimate of the Metropolitan Region Parks System for 2012. Saint Paul (MN).
- Nobles AL, Goodall JL, Fitch GM. 2017. Comparing costs of onsite best management practices to nutrient credits for stormwater management: a case study in Virginia. J Am Water Resour Assoc. 53(1):131–143.
- Noonan TA. 1998. Como Lake, Minnesota: the long-term response of a shallow urban lake to biomanipulation. J Lake Reserv Manage. 14(1):92–109.
- Novotny EV, Stefan HG. 2010. Projections of chloride concentrations in urban lakes receiving road de-icing salt. Water Air Soil Pollut. 211(1–4):261–271.
- Pennino MJ, McDonald RI, Jaffe PR. 2016. Watershed-scale impacts of stormwater green infrastructure on hydrology, nutrient fluxes, and combined sewer overflows in the mid-Atlantic region. Science Total Environ. 565:1044–1053.
- Petit-Boix A, Sevigne-Itoiz E, Rojas-Gutierrez LA, Barbassa AP, Jose A, Rieradevall J, Gabarrell X. 2017. Floods and consequential life cycle assessment: integrating flood damage into the environmental assessment of stormwater Best Management Practices. Journal of Clean Prod. 162:601–608.
- Rippey B, Anderson NJ, Foy RH. 1997. Accuracy of diatom-inferred total phosphorus concentrations and the accelerated eutrophication of a lake due to reduced flushing and increased internal loading. Can J Fish Aquat Sci. 54(11):2637–2646.
- Ruley JE, Rusch KA. 2004. Development of a simplified phosphorus management model for a shallow, subtropical, urban hypereutrophic lake. Ecol Eng. 22(2):77–98.
- Sharpley A, Jarvie HP, Buda A, May L, Spears B, Kleinman P. 2013. Phosphorus legacy: overcoming the effects of past management practices to mitigate future water quality impairment. J Env Qual. 42(5):1308–1326.
- Shulski M, Seeley M. 2001. Climatological characterization of snowfall and snow drift in Minnesota: for the design of living snow fences. Minnesota Department of Transportation Agreement 74708. University of Minnesota, Minneapolis.
- Søndergaard M, Bjerring R, Jeppesen E. 2013. Persistent internal phosphorus loading during summer in shallow eutrophic lakes. Hydrobiologia. 710(1):95–107.
- Spears BM, Carvalho L, Paterson DM. 2007. Phosphorus partitioning in a shallow lake: implications for water quality management. Water & Environment J. 21(1):47–53.
- Thompson D, Mehrotra S, Gumb D. 2017. The Staten Island Bluebelt, 20 years later, a triple-bottom-line perspective. Proceedings of the Water Environment Federation, WEFTEC 2017: Session 210 through Session 219. p. 727–735.