
Abstract
Kim D, Kim Y, Kim B. Simulation of eutrophication in a reservoir by CE-QUAL-W2 for the evaluation of the importance of point sources and summer monsoon. Lake Reserv Manage. 35:64–76.
Water quality was modeled by a 2-dimensional model (CE-QUAL-W2) in a reservoir (Lake Uiam, Korea) receiving nutrients from both nonpoint sources and point sources. Due to the summer monsoon climate and the aggregated seasonal precipitation pattern, the phosphorus export from nonpoint sources is severely concentrated in the rainy season. For several decades, a sewage treatment plant (STP) on the shore of the lake has been releasing effluent, which was suspected as the major cause of eutrophication. However, the total annual phosphorus loading from the STP was smaller than the loadings from nonpoint sources, which aroused skepticism about the effectiveness of an additional chemical P-removal process in the STP as a eutrophication control strategy. The result of scenario simulations in this study showed that P reduction in the STP effluent from 0.9 mg/L to 0.1 mg/L would effectively reduce the chlorophyll a concentration in the lake by 62%. According to the results of the simulation, the addition of a chemical P-removal process was suggested to the municipal government and was installed in 2012. After the process, the chlorophyll a concentration in the lake decreased as predicted in the simulation. The effect of phosphorus loading can have quite different effects on phytoplankton growth depending on the runoff pattern and hydrological characteristics of the receiving water bodies. Flow rate and nutrient loadings are very dynamic, far from a steady state, in the summer monsoon regions, which may be a unique limnological feature of East Asian countries.
Lakes may receive nutrients from both point sources and nonpoint sources. Their relative contributions to the eutrophication of a receiving waterbody can vary according to the watershed land use and hydrological conditions (Billen and Garnier Citation1997, Fragoso et al. Citation2011). In an urban watershed, point sources of sewage can have major influences, whereas in a rural area agricultural nonpoint sources can have larger influences. In a watershed of mixed land use, point sources and nonpoint sources can have different impacts according to the hydraulic residence time of the receiving water body and the seasonal precipitation pattern (Zhao et al. Citation2014, Bastola and Misra Citation2015). Because nonpoint sources discharge phosphorus mostly due to rain events, precipitation pattern can greatly affect the export of phosphorus and the availability of phosphorus to phytoplankton (Reichwaldt and Ghadouani Citation2012).
In a watershed of complex land use, phosphorus loadings from agricultural fields are usually larger than those from municipal sewage. However, phosphorus from nonpoint sources is exported mostly on rainy days in the form of storm runoff (Ichiki et al. Citation1998, Chen et al. Citation2015). In contrast, loadings from point sources have uniform flow rates, and their contributions on dry days can be larger than those of nonpoint sources. The hydraulic residence time can be another factor that determines the relative importance of storm runoff in lakes and reservoirs. Shock loadings of phosphorus from agricultural nonpoint sources can be very large during storm events, but a large portion of the P loading can be flushed out of reservoirs if the residence time is short. Therefore, there can be controversy about the relative importance of point and nonpoint P loading. Because Korea is located in the East Asian summer monsoon region and the application rate of fertilizer is high, P discharge from agricultural nonpoint sources is very high in the rainy season (Jung et al. Citation2016). When the annual P loading is compared without consideration of seasonal distribution, nonpoint sources usually have greater loadings than point sources. This can arouse skepticism about the effectiveness reducing point source P loading, because we can achieve only a partial reduction of the annual P loading.
Lake Uiam is a reservoir in the middle reach of the Han River that is an important water resource for the capital area of Korea. Therefore, its water quality and the regular cyanobacterial blooms are of major concern in water management. Lake Uiam receives nutrients from 2 large tributaries and a sewage treatment plant (STP) of Chuncheon City (Park et al. Citation2007). Cyanobacterial blooms occurring in dry, warm periods prompted questions about the cause of eutrophication and the relative importance of municipal sewage. The STP was employing only biological treatment processes and the effluent TP was ∼1 mg/L, which was much higher than the critical concentration for eutrophication of lakes. However, by the estimation of the annual phosphorus loading, the loadings from nonpoint sources were much larger than those from the STP (Huh et al. Citation2004).
Policy decisions about water quality management were hampered by questions about the necessity of an additional chemical phosphorus-removal process for the reduction of algal blooms in Lake Uiam. The municipal government worried about continued eutrophication even after the installation of a phosphorus-removal process in the STP. Some officials suggested an alternative method of moving the STP outlet to a downstream site or a deep bottom layer to reduce the availability of phosphorus to surface phytoplankton.
The city government requested that the authors evaluate the relative contribution of STP effluent and estimate the effect of a P-removal process and the effect of the alternative method of bypassing STP effluent to a deeper layer. In order to provide scientific rationale for the decision making, the effectiveness of P removal and sewage bypass were evaluated by a simulation using a 2-dimensional water quality model, CE-QUAL-W2, which is well known as a good model describing both hydrodynamics and water quality dynamics in reservoirs (Kim et al. Citation2001, Chung Citation2004, Ostfeld and Salomons Citation2005, Kim and Kim Citation2006, Ram et al. Citation2008, White et al. Citation2010, Gelda et al. Citation2015). The CE-QUAL-W2 model is known to accurately represent density currents caused by strong stratification, which makes it well suited to use on deep, narrow water bodies like Lake Uiam. In particular, one of the inflows to Lake Uiam enters the lake at the hypolimnion due to its much lower water temperature, and so it is very important to predict water quality at different depths. Therefore, we chose to use the CE-QUAL-W2 model rather than a 3-D model, which is better suited to modeling water bodies with a wide area.
In this study, we examined the effects of high-concentration TP inflow from a sewage treatment plant, acting as a point source of pollution, on the actual water quality in the lake, and we used modeling to assess how nutrient reduction would influence water quality (e.g., TOC, chlorophyll a). In addition, we analyzed other scenarios alongside reduction in TP concentration to estimate whether further water quality improvement could be achieved.
Study site
Lake Uiam is an artificial reservoir for hydroelectric power generation. Its watershed area is 7709 km2 and the surface area is 15 km2 (WAMIS Citation2016). Two main inflowing rivers, the North Han and the Soyang, converge near the dam, and shallow sand dunes and islands separate the 2 river channels within the reservoir (Choi et al. Citation2015). The lake has a mean depth of 5 m, and the depth profile shows a longitudinal gradient from 20 m at the dam site to 2 m in the upper region due to siltation. The maximum water capacity is 80 million m3 and the annual average inflow rate was 206 m3/s in 2013, resulting in the annual mean hydraulic residence time of 4.5 d. According to the residence time, Lake Uiam has the hydraulic characteristic of a riverine reservoir, which is between a lake and a river. However, the inflow rate varies very much seasonally due to the summer monsoon climate and the regulation of river flow by large upstream dams. The residence time after monsoon in August and September can be as short as 2–3 d and the reservoir becomes a slow-moving river with a significant velocity of longitudinal advection. In contrast, the residence time is longer than 2 weeks in other dry seasons, resulting in a lacustrine habitat with a substantial phytoplankton standing crop (Kim Citation2010).
Chuncheon City (Citation2012), with a population of 260,000, is located on the shore of the lake and discharges STP effluent into the middle reach of the lake. The STP discharged effluents of TP of 1 mg/L before the chemical P-removal process, but after the installation of the chemical treatment process in 2012 the TP was reduced to 0.1–0.2 mg/L.
Materials and methods
Monitoring of the lake and tributaries
Water quality of tributary streams and the lake were monitored monthly for the water quality modeling. The lake water quality was monitored near the dam and at 5 additional stations within the lake (). Two main inflowing rivers, the North Han and the Soyang, were monitored 2005–2009 and 2013–2014. Nine tributary stream sites were monitored monthly in 2009, and 2 rain events (41 mm for the first event, 192 mm for the second) were examined intensively at the interval of 1–4 h to measure storm runoff loading via each tributary stream, mostly from nonpoint sources. Event mean concentrations (EMC) of the 2 rain events were used in the model as the water quality of the small streams during all other rain events for which we did not examine water quality. Conductivity, SS, TP, and TN were determined according to standard methods (APHA Citation2005). Chlorophyll a concentration was determined by the trichromatic method (APHA Citation2005). COD was determined by the manganese method according to the standard method of the Korean Ministry of Environment.
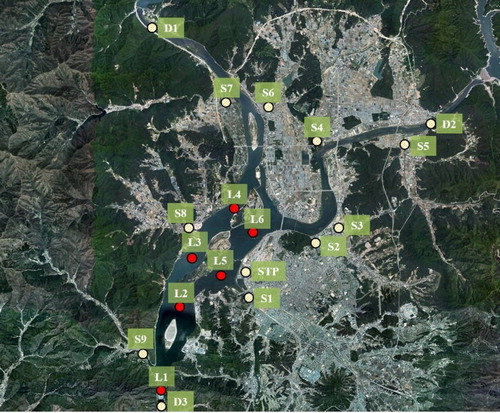
Figure 1. The location of study sites. L1-6: the sampling site in Lake Uiam; S1-9: small tributary streams; D1: the main inflowing river (the North Han River, Chuncheon dam discharge); D2: second inflowing river (the Soyang River, Soyanggang dam discharge); D3: discharge from Lake Uiam, STP: sewage treatment plant outlet). Map source: KakaoMap.
Model grid structure
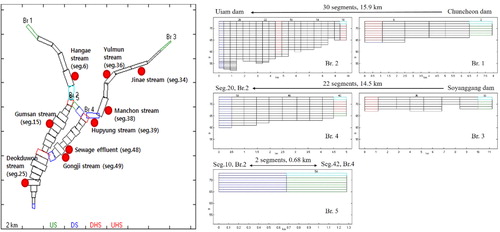
Model grids were arranged in a 2-dimensional array according to the CE-QUAL-W2 model. Morphometric data were extracted from the river transect survey conducted by the Ministry of Land, Infrastructure and Transport in Korea (MOLIT Citation2002). The downstream reach of the lake was modeled as 10 longitudinal segments, and the upper reaches of the lake were modeled as 2 main branches because islands separate 2 tributary channels and they merge only near the dam site. The tributary of the North Han River was modeled as Branches 1 and 2, and the Soyang River as Branches 3 and 4. Branch 5 was added for the narrow shallow connecting channel between the 2 tributaries (). Vertical layering was modeled at 1 m intervals; the deepest dam site had 27 layers. In constructing a model that accounts for the characteristics of Lake Uiam, we compensated for the drawbacks of a 2-D model. We used a tighter vertical grid to retain the strengths of CE-QUAL-W2 and to enable more accurate prediction of water movement and changes in water quality at different depths. The total grid consisted of 1 reservoir, 5 branches, and 56 segments. Nine stream inlets and STP effluent were included as point sources.
Figure 2. Grid structure of the CE-QUAL-W2 model in Lake Uiam and the location of tributary streams and STP effluent outlet (left), grid structure of branches (right).
Model input data
For the input data file the national survey of flow rate was employed for the 2 main tributaries (WAMIS Citation2016), and for the 9 small streams the flow rate and water quality were measured in this study. Weekly water quality input data was compiled for the 2 main tributary rivers from the available data. For the small streams, because only 2 rain events were examined in this study, flow rates on rain events that were not examined were estimated by using the water export coefficient of subwatersheds calculated from the survey data collected during the 2 examined rain events. The water quality input file for the 9 small streams employed monthly data on dry days. Water quality of the small streams was substituted by the EMC of each tributary measured during the 2 rain events. For the water quality of STP effluent the official data from the Chuncheon City STP was employed. The STP provided only TP and not inorganic phosphate concentration, which is required for the CE-QUAL-W2 model. Therefore, TP and dissolved inorganic phosphorus (DIP) were measured several times and the average composition of DIP (86%) was applied to all the effluent TP for the calculation of DIP. Meteorological data were provided by the Korean Ministry of Meteorology.
Calibration of the water quality model (CE-QUAL-W2)
In order to match the modeled water level with the actual water level, we adjusted the outflow volume using data for the total inflow rate and the change in water level in front of the dam (). Coefficients for water quality models were calibrated by referring to the survey conducted by the National Institute of Environmental Research in Korea (NIER Citation2007), which presented model parameters for several lakes and rivers in Korea including Lake Uiam. For the model coefficient, we tried numerous values between those presented in the NIER research and the default values of the model, and we selected the model parameters by evaluating RMSE and R2 from calibrated and observed data. Some adjusted parameters that are related with algae and phosphorus are listed (). Other parameters were not adjusted and the default values of CE-QUAL-W2 were employed.
Figure 3. The calibration results of water level, temperature, SS, TP, and TOC at the dam site of Lake Uiam (Station L1) (dots: measured; line: simulated).
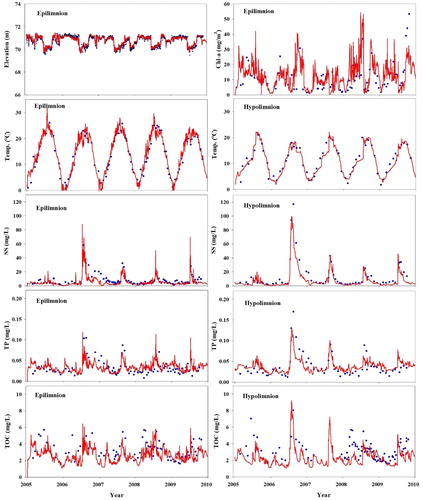
Table 1. Model parameters of CE-QUAL-W2 model changed for the calibration.
In statistical analysis, the results of simulation showed acceptable predictions. The R2 values between the measured data and simulated results were over 0.9 for water level, temperature, and SS. However, the R2 values were lower for chlorophyll a (0.35) and TOC (0.22) (). These variables were difficult to correct, as they are heavily influenced by organisms such as phytoplankton, and so further improvement will be required in the future. At Station L1, when the epilimnion and hypolimnion were analyzed separately, the hypolimnion showed a greater change in water quality, but the predictive power was stronger than in the epilimnion (). Station L5 shows considerable variation in water quality throughout the year due to the effects of STP effluent water; since the water quality can change greatly per unit time, the prediction time in the model and the actual measurement time need to be as close as possible.
Figure 4. Comparisons between simulated data and observed data.
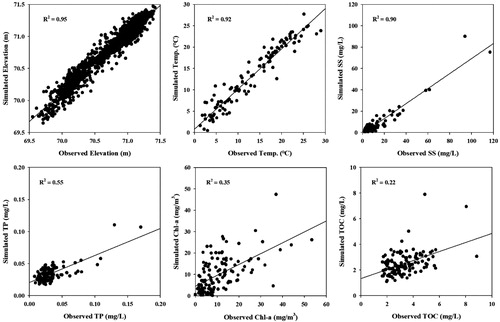
Table 2. RMSE and R2 values calculated from field data and model simulations at stations L1 and L5.
The adjusted model predicts water quality within an acceptable range and is thought to accurately reflect changes throughout the year (). In the future, to improve the model’s accuracy and applicability (so long as it is possible to account for the model runtime, which can increase exponentially), it would be worthwhile to set the interval for the inflow of effluent water from the upstream dam to per-minute or per-hour units. In addition, if detailed surveys of the phytoplankton are conducted, this could be used as input data for the model. For example, after classifying the optimal growth temperatures and growth rates of different types of phytoplankton in Lake Uiam, the model coefficient could be applied to improve the accuracy of the model.
Scenario analysis
Simulation scenarios were selected in order to elucidate the influence of STP effluent and the effects of an additional chemical P-removal process. The phytoplankton standing crop and water quality were simulated for the periods of “before” the construction of a phosphorus-removal process (2005–2009) and “after” (2013–2014). Simulation results were compared for sites L1 and L5.
The Control scenario was the condition before the P removal in 2005–2009, with TP = 0.9 mg/L. Case 1 and Case 2 represented estimated P concentration after P removal; TP of STP effluent = 0.2 mg/L for Case 1 and TP = 0.1 mg/L for Case 2. Case 3 and Case 4 represented the condition of changing the location of the STP outlet in addition to P removal (TP = 0.1 mg/L). In Case 3 the STP outlet was changed from the surface to a depth of 8 m at the same location. In Case 4 the outlet was moved to a site near the dam in which STP effluent can bypass most of the limnetic zone of Lake Uiam and be discharged out of the reservoir before being exploited by phytoplankton.
The scenarios were performed in 2009 and the results were presented to the Chuncheon City officials; we suggested P removal should be effective for the control of algal blooms. The city government accepted the suggestion and a chemical P-removal process was installed in 2012. After the installation of the P-removal process, the TP concentration of STP effluent from 2013 to 2014 was similar to the condition of Case 2 in the simulation. Therefore, the simulation results that employed the measured data from 2013 to 2014 were titled Case 2-2013 ().
Table 3. Scenarios of simulation and conditions.
Results and discussion
Water quality of the lake and tributaries
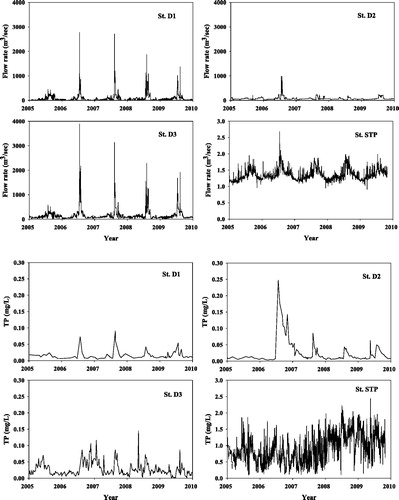
Water quality at the downstream site of the lake (Station L1) showed average TP of 0.027 mg/L and Chl-a of 20.2 mg/m3, which can be classified as a mild eutrophic lake (USEPA 1976, Forsberg and Ryding Citation1980; ). Station L5, where the Chuncheon City STP effluent is discharged, showed 5 times higher conductivity (400 µS/cm) and TP (1.0 mg/L) than other stations. However, SS, COD, and TN were not significantly higher than at other stations. SS was higher at the bottom of the dam site possibly because cold turbid water discharge from the upstream dam (Soyanggang Dam) formed a bottom density flow.
Table 4. The average and range of water quality parameters at 6 stations in Lake Uiam (Apr–Oct 2009).
A comparison of annual water flow rate tributaries showed relative contributions of 54.5% from D1, 43.4% from D2, 1.3% from S1-9, and 0.8% from the STP (). When the seasonal variation was compared, D2 and the STP showed uniform discharge throughout the year compared with D1 and S1-9, which showed higher discharge during the summer monsoon. Average TP of STP effluent was 0.9 mg/L, which was much higher than that of the 2 main tributary rivers. The TP of the main tributaries was as low as 0.01 mg/L except for short turbid periods of storm runoff. TP of STP effluent in 2013–2014 was still much higher (0.09 mg/L) than D1 and D2 tributaries even after the installation of the P-removal process in the STP in 2012.
Figure 5. The flow rate and TP of tributaries and the STP effluent.
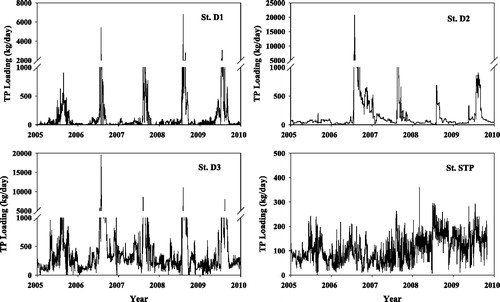
Daily P loading from each source was calculated by multiplying flow rate and TP. Loadings from D1 and D2 varied very much due to heavy rain events during the summer monsoon, while the STP discharge showed little seasonal variation (). STP effluent accounted for only 12% of daily P loading during the summer monsoon season (Jul–Sep) compared with 54% in other seasons. P loadings from D1 and D2 were similar and accounted for 71% of daily P loading in summer, compared with 35% in other dry seasons. Even though total annual loading from nonpoint sources is larger than point sources, time-weighted impact of point sources on phytoplankton can be larger than nonpoint sources because the dry season (autumn through spring) is longer than the rainy season and the residence time is too short for phytoplankton to build up in summer.
Figure 6. TP loading of tributaries and the STP effluent.
Water movement off the STP outlet (Station L5)
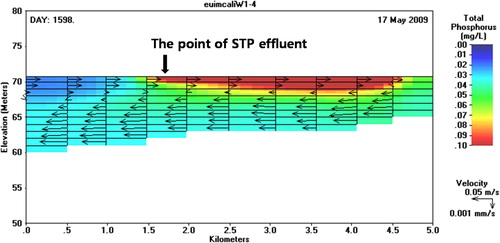
Cyanobacterial blooms were a regular occurrence in Lake Uiam and high density was observed near the outlet of the STP and the region upstream of the outlet. Because it was suspected that phosphorus discharged from the STP might be dispersed upstream (Park et al. Citation2013, Min et al. Citation2014), water flow velocity and the flow direction were examined by the model. From the result of the flow direction simulation, it was found that the surface water moves upstream most of the time off the STP outlet (Station L5), but the bottom water moves downstream. Lake Uiam has long and narrow channels, and consequently it results in significant longitudinal advection from upstream to downstream. The area off the STP outlet receives water from D2, which is the hypolimnetic water of a deep reservoir (maximum depth 120 m), Lake Soyang. The Soyang dam has an outlet located at the middle depth of the dam and discharges colder water in spring and summer than the surface of Lake Uiam. The Soyang dam is located 15 km upstream of Lake Uiam and it takes <8 h for discharge water to reach Station L5, which is not long enough to reach equilibrium temperature with the air. Entering the lake, the cold dam discharge from the Soyang Dam forms a bottom density current with a flow velocity of 0–0.1 m/s, which can induce a surface countercurrent (). Because the inflowing water from D2 is usually 10 C colder than the epilimnion, a stable stratification is formed during the season of low flow and the warm STP effluent is trapped in the surface layers that move upstream. Of the total 1826 d of the simulation, 843 d showed upstream flow. The persistent westerly wind may also have had synergic effects on the surface countercurrent. The upstream movement of surface water is well reflected in the distribution of phosphorus; high phosphorus concentration was observed and simulated in the upstream region of the STP outlet up to 2.5 km (). This can be a plausible explanation for cyanobacterial blooms observed off the STP and its upstream region of the lake.
Figure 7. Horizontal velocity of epilimnion and hypolimnion in front of STP outlet in 2009. (left: Station L1; right: Station L5).
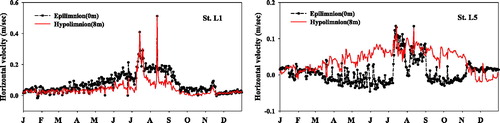
Figure 8. Distribution of phosphorus concentration near the STP outlet site showing bottom density current and the upstream dispersion of phosphorus by the surface countercurrent.
Scenario analysis
The results of scenario analysis clearly showed the effectiveness of P removal on algal blooms. When TP in the STP effluent was reduced from 0.9 mg/L (Control) to 0.1 mg/L (Case 2), TP was reduced by 26% at the dam site (L1) and 66% at the STP site (L5) (). Accordingly, chlorophyll a was reduced by 48% and 62%, respectively. TOC was also predicted to be reduced by 21% at L1 and 36% at L5, possibly due to the reduction of algal biomass. The results showed that even though the annual P loading from agricultural nonpoint sources is larger than that of point sources, the effect of point sources on phytoplankton blooms is large, possibly due to the summer monsoon climate. Because storm runoff is concentrated in summer, the hydraulic residence time is very short during summer monsoon when most of the phosphorus from nonpoint sources just passes through lakes. The seasonal variation of simulated chlorophyll a showed that phytoplankton could be reduced significantly by P removal in dry seasons, but, in contrast, the effect would be negligible in the monsoon season ().
Figure 9. The variation of chlorophyll a concentration at stations L1 and L5 in Lake Uiam simulated according to the scenario Control and Case 2.
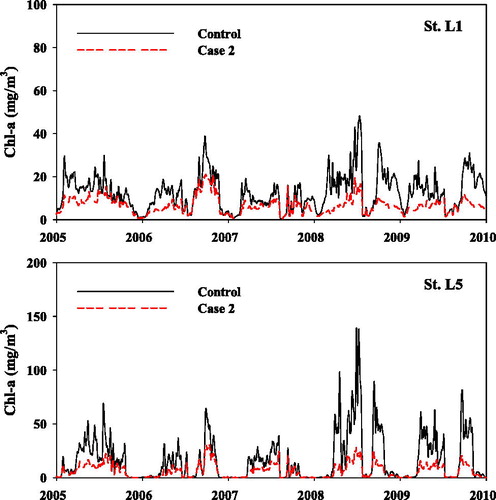
Table 5. The average reduction rates of TP, Chl-a, and TOC at stations L1 and L5 in Lake Uiam simulated for the evaluation of P removal and STP outlet relocation. Data of 2005–2009 were employed for scenarios 1–4. Measured STP effluent data of 2013 and 2014 were employed for Case 2-2013 and Case 3-2013 after the P-removal process started.
The effects of relocating the STP outlet to a deeper layer (Case 3) or to the downstream site (Case 4) were not significant if phosphorus concentration of STP effluent was lowered to 0.2 mg/L. Therefore, the alternative method of relocating the STP outlet to a deeper layer or a downstream site was discarded. In accordance with the results of this study we recommended to the city government that they install an additional chemical P-removal process as the control strategy for cyanobacterial blooms. The recommendation was accepted and funded by the city government and the Korean Ministry of Environment.
After the P-removal process was installed in 2012, the measured TP of STP effluent in 2013–2014 was at an average of 0.104 mg/L, which was similar to the Case 2 scenario in the 2005–2009 simulation (). The model was run again after P removal using data of 2013–2014 and titled Case 2-2013. Actual water quality in Lake Uiam improved in 2013 and 2014, and it agreed well with the simulation results of Case 2 and Case 2-2013 ().
Table 6. The average concentrations of TP, Chl-a, and TOC at stations L1 and L5 in Lake Uiam comparing Case 2 and Case 2-2013 scenarios with actual field data measured in 2013 and 2014 from NIER (Citation2018).
Conclusion
Water quality and phytoplankton growth were simulated in a reservoir by a 2-dimensional model, CE-QUAL-W2, with an acceptable accuracy and the calibration showing that the model is a useful and robust tool. Lake Uiam receives nutrients from both nonpoint sources and point sources. It has a large watershed and receives significant amounts of nutrients via 2 main tributaries; also, the sewage treatment plant of a city with 260,000 residents discharges effluents of high inorganic phosphorus concentration. When the total annual phosphorus loadings were compared, the loadings from the watershed were much larger than that of the STP. However, the simulation results showed that the reduction of P from the STP would be effective in reducing phytoplankton.
Monsoon climate and the uneven temporal distribution of annual precipitation seem to be critical factors determining the availability of phosphorus to phytoplankton (Liu et al. Citation2009). As rainfall is concentrated in the summer monsoon season, so is phosphorus loading from agricultural nonpoint sources. In the monsoon season high phosphorus concentration in the inflowing rivers did not contribute to phytoplankton growth because of the short hydraulic residence time. However, in dry periods of long residence time, the consistent STP discharge significantly stimulated the growth of phytoplankton. Therefore, the reduction of phosphorus in the STP effluent from 1 mg/L to 0.1 mg/L was predicted to reduce phytoplankton density significantly (by 62%) even though the total annual phosphorus loading was smaller than that of nonpoint sources. This result is thought to be caused by the combined effect of summer monsoon and the short residence time of this lake. If we had uniform annual distribution of rainfall, phosphorus loading from a point source should have a minor impact on phytoplankton growth. Also if the residence time were long and the same loadings should enter the lake, nonpoint source loadings would have a big impact as is observed in many large dams in Korea (Jung et al. Citation2016).
The results suggest that the effect of the same amount of phosphorus loading can have quite different effects on phytoplankton growth depending on the rainfall distribution and hydrological characteristics of the receiving water body. Flow rate and nutrient loadings are very dynamic, far from steady state, in the summer monsoon regions, which may be a unique limnological feature of East Asian countries.
Acknowledgments
This study was supported by the City of Chuncheon, the Korean Ministry of Environment, and Kangwon National University. Scott W. Gillihan provided English-language editing of this manuscript.
References
- [APHA] American Public Health Association. 2005. Standard methods for the examination of water and wastewater, 21st ed. Washington (DC): APHA.
- Bastola S, Misra V. 2015. Seasonal hydrological and nutrient loading forecasts for watersheds over the southeastern United States. Environ Model Software. 73:90–102.
- Billen G, Garnier J. 1997. The Phison River plume: coastal eutrophication in response to changes in land use and water management in the watershed. Aquat Microb Ecol. 13:3–17.
- Chen D, Hu M, Guo Y, Dahlgren RA. 2015. Reconstructing historical changes in phosphorus inputs to rivers from point and nonpoint sources in a rapidly developing watershed in eastern China, 1980–2010. Sci Total Environ. 533:196–204.
- Choi J, Min J, Song Y, Lee J, Kim K. 2015. Impacts of wind and dam operation on the flow dynamics and thermal stratification of Lake Euiam: a three dimensional monitoring and modeling study. Korean Society on Water Environment; p. 195–196. Korean.
- Chuncheon City. 2012. Sewer operation division database; [cited 13 Dec 2016]. Available from http://www.chuncheon.go.kr/index.chuncheon?menuCd=DOM_000000548000000000/
- Chung S. 2004. Density flow regime of turbidity current into a stratified reservoir and vertical two-dimensional modeling. J Korean Soc Environ Eng. 26:970–978. Korean.
- Forsberg C, Ryding SO. 1980. Eutrophication parameters and trophic state indices in 30 Swedish waste-receiving lakes. Arch Hydrobiol. 89:189–207.
- Fragoso CR Jr, Motta Marques DML, Ferreira TF, Janse JH, van Nes EH. 2011. Potential effects of climate change and eutrophication on a large subtropical shallow lake. Environ Model Software. 26(11):1337–1348.
- Gelda RK, King AT, Effler SW, Schweitzer SA, Cowen EA. 2015. Testing and application of a two-dimensional hydrothermal/transport model for a long, deep, and narrow lake with moderate Burger number. Inland Waters. 5(4):387–402.
- Huh I, Lee G, Ham K, Choi J, Jeong U. 2004. The study on decline plan of primary production organic matter of Uiam Lake basin. Korean J Environ Health Sci. 30:50–58. Korean.
- Ichiki A, Ohnishi T, Yamada K. 1998. Estimation of urban nonpoint source pollution in Lake Biwa basin. Water Sci Technol. 38(10):157–163.
- Jung S, Shin M, Kim J, Eum J, Lee Y, Lee J, Choi Y, You K, Owen J, Kim B. 2016. The effects of Asian summer monsoons on algal blooms in reservoirs. Inland Waters. 6(3):406–413.
- Kim D. 2010. The effect of phosphorus removal from sewage using CE-QUAL-W2 in Lake Uiam, Korea [master’s thesis]. Chuncheon: Kangwon National University. Korean.
- Kim Y, Kim B. 2006. Application of a 2-dimensional water quality model (CE-QUAL-W2) to the turbidity interflow in a deep reservoir (Lake Soyang, Korea). Lake Reserv Manage. 22(3):213–222.
- Kim Y, Kim B, Choi K, Seo D. 2001. Modelling of thermal stratification and transport of density flow in Soyang Reservoir using the 2-D hydrodynamic water quality model, CE-QUAL-W2. J Korean Soc Water and Wastewater. 15(1):40–49. Korean.
- Liu W, Chen W, Kimura N. 2009. Impact of phosphorus load reduction on water quality in a stratified reservoir-eutrophication modeling study. Environ Monit Assess. 159(1-4):393–406.
- Min J, Kim D, Kang M, Kim K, Rhew D. 2014. Management scenario evaluation for algal bloom in Lake Euiam based on the long-term data analysis and a numerical modeling approach. Korean Society on Water Environment; p. 88–89. Korean.
- [MOLIT] Ministry of Land, Infrastructure and Transport. 2002. North Han River system maintenance basic plan. Korean.
- [NIER] National Institute of Environmental Research. 2007. Han River (main stream and North Han River) system aquatic ecosystem water quality parameters research. Korean.
- [NIER] National Institute of Environmental Research. 2018. Water Environmental Information System. Water quality data of lakes and rivers database; [cited 11 Jul 2018]. Available from http://water.nier.go.kr/waterData/generalSearch.do?menuIdx=3_2_2&siteTypeCd=B
- Ostfeld A, Salomons S. 2005. A hybrid genetic-instance based learning algorithm for CE-QUAL-W2 calibration. J Hydrol. 310(1–4):122–142.
- Park S, Huh B, Huh I, Hyun G, Ham K, Jeong W, Koh S, Lee S, Kim N, Kim S. 2007. Assessments for loadings and water qualities of BOD, SS, and T-P effluent from Lake Soyang, Lake Chuncheon, Gongji Stream, and Chuncheon Wastewater Treatment Plant into Lake Uiam. Korean J Environ Health Sci. 18:70–83. Korean.
- Park S, Lee H, Lee Y, Park S. 2013. A hydrodynamic modeling study to analyze the water plume and mixing pattern of Lake Euiam. KJEE. 46(4):488–498. Korean.
- Ram BP, Kim Y, Kim B, Heo W. 2008. Application of CE-QUAL-W2 to Andong Reservoir: part 2: simulations of chlorophyll a and total phosphorus dynamics. Korean J Limno. 41(4):472–484.
- Reichwaldt ES, Ghadouani A. 2012. Effects of rainfall patterns on toxic cyanobacterial blooms in a changing climate: between simplistic scenarios and complex dynamics. Water Res. 46(5):1372–1393.
- [USEPA] US Environmental Protection Agency. 1976. Water quality criteria research of the U.S. Environmental Protection Agency, Proceeding of an EPA Sponsored Symposium. Washington (DC): EPA/600/3-76-079)/185.
- [WAMIS] Water Resources Management Information System. 2016. Hydrologic data of dam database; [cited 13 Dec 2016]. Available from http://www.wamis.go.kr/eng/mn_dammain.aspx/
- White J, Prochnow S, Filstrup C, Scott T, Byars B, Zygo-Flynn L. 2010. A combined watershed–water quality modeling analysis of the Lake Waco reservoir: I. Calibration and confirmation of predicted water quality. Lake Reserv Manage. 26(2):147–158.
- Zhao Y, Sharma A, Sivakumar B, Marshall L, Wang P, Jiang J. 2014. A Bayesian method for multi-pollution source water quality model and seasonal water quality management in river segments. Environ Model Software. 57:216–226.