
 ?Mathematical formulae have been encoded as MathML and are displayed in this HTML version using MathJax in order to improve their display. Uncheck the box to turn MathJax off. This feature requires Javascript. Click on a formula to zoom.
Abstract
Schellenger FL, Hellweger FL. Phosphorus loading from onsite wastewater systems to a lake (at long time scales). Lake Reserv Manage. 35:90–101.
Phosphorus from onsite wastewater systems (OWS, septic systems, cesspools) enters the groundwater and may migrate to and contribute to eutrophication of down-gradient lakes. Since phosphorus sorbs relatively strongly to soil solids, this source may be assumed negligible in lake management. However, phosphorus adsorption is reversible, and given enough time, some phosphorus will eventually reach the lake. We investigated the magnitude and timing of phosphorus loading to a case study lake in southeastern Massachusetts, using a model that accounts for cesspools and septic systems installed over a 270-yr time frame, the 1994 laundry detergent phosphorus ban, loss of phosphorus in the vadose zone, and transport and adsorption/desorption (retardation) in the surficial aquifer. We parameterized the model using literature and local information and applied it to all the OWS in a the lake watershed to estimate annual wastewater total phosphorus loading over a long time. Model results were compared to previous phosphorus budgets based on limited field measurements. The model predicts that groundwater transport of phosphorus from OWS by itself can account for the current eutrophic state of the lake and will continue to increase. Our results show that the OWS source can be significant and should not be ignored. We performed parameter sensitivity and Monte Carlo uncertainty analyses and illustrated the effects of removal in the vadose zone and travel time in the aquifer. Our model suggests that past management actions (cesspool to septic system conversion, laundry detergent phosphorus ban) effectively reduced the 2018 load by 31.4%. A centralized wastewater treatment facility would eliminate the OWS loading, but the half-life due to the existing phosphorus reservoir in the aquifer is long (20 yr).
Cultural eutrophication of lakes is a worldwide problem that is associated with harmful algae blooms and other symptoms (Schindler Citation2006; Dodds et al. Citation2009; Paerl et al. Citation2011), and phosphorus inputs are often considered the primary cause (Schindler Citation2006; Lewis and Wurtsbaugh Citation2008). Phosphorus can enter a lake from a number of sources, including wastewater treatment plants, tributaries, and direct runoff. Internal loading (i.e., recycling from the sediment bed) can also be an important source (Cooke et al. Citation2005; Wagner et al. Citation2017).
Groundwater is another source of nutrients to surface waters (Lewandowski, et al. Citation2015; Meinikmann et al. Citation2015), and onsite wastewater systems (OWS) have long been recognized as a possible source of groundwater contamination (Beal et al. Citation2005; Humphrey and Driscoll Citation2011; Oosting and Joy Citation2011; Eveborn et al. Citation2012). Nutrients from OWS may travel to down-gradient surface waters and contribute to their eutrophication. Based on studies of chemical reactions in OWS effluent plumes, a consensus developed that nitrogen (as nitrate) has the potential to travel great distances down-gradient from an OWS (e.g., Dudley and Stephenson Citation1973; Jones and Lee Citation1979; Bicki et al. Citation1984). On the other hand, these studies have reported that the unsaturated (vadose) zones of OWS soil absorption systems are highly efficient at sequestering phosphorus, and have concluded that phosphorus will be sufficiently retarded by sorption or immobilized by precipitation so that movement is limited to a few meters at most (Reneau and Pettry Citation1976; Stolt and Reneau Citation1991). For some older systems, down-gradient transport of phosphorus was found (Dudley and Stephenson Citation1973; Reneau and Pettry Citation1976; Gilliom and Patmont Citation1983); these were viewed as isolated cases, and down-gradient movement from a well-designed and maintained OWS is generally not considered a threat to surface waters (Sikora and Corey Citation1976; Jones and Lee Citation1979; Reneau et al. Citation1989). Consequently, the contemporary nutrient management process is based on this paradigm. Remediation and restoration efforts for eutrophic lakes and other surface waters generally focus on controlling above-ground nutrient sources and suppression of internal loading (Cooke et al. Citation2005; Wagner et al. Citation2017).
Ignoring the phosphorus contribution of OWS to a lake may not be warranted at long time scales. Some studies of phosphorus behavior in the OWS vadose zone have found that sorption of phosphate anions to aluminum and iron hydroxide coatings on soil particles, with the subsequent precipitation of mineral phosphates, is enhanced at groundwater pH values below circumneutral (e.g., Robertson Citation2003, Citation2012). Precipitation may be a permanent loss process, but phosphorus sorption is reversible (Dudley and Stephenson Citation1973; Whelan and Barrow Citation1984; Walter et al. Citation1996). There are a number of studies that explored the long-term transport of phosphorus from an OWS in groundwater (e.g., Koerner and Haws Citation1979; LeBlanc Citation1984; Robertson Citation2003; Andres and Sims Citation2013; Jarosiewicz and Witek Citation2014). Findings from these studies suggest that, given sufficient time, phosphorus can move down-gradient for a significant distance.
From the standpoint of eutrophication, the total load to a lake has to be considered, so studies of individual OWS are of limited utility. A number of studies have estimated groundwater phosphorus loading from the watershed to a surface water body, finding the load to be significant and suggesting OWS as a potential source (Vanek Citation1991; Moore et al. Citation2003; Jarosiewicz and Witek Citation2014; Meinikmann et al. Citation2015). However, these studies do not provide a quantitative link to OWS. To our knowledge there have been no studies that combine the estimated loading from all the OWS in a watershed with the long-term dynamics of transport and retardation in the groundwater and quantify the relationship to the trophic state of the receiving lake.
We estimated the cumulative loading of phosphorus from all the OWS in a lake watershed at a long time scale, from the installation of the first OWS to when the present-day loadings from all the OWS in the watershed reach the lake. We used a simple model of phosphorus transport to predict the time-variable phosphorus load from each system to a down-gradient lake (), and then summed the loads to obtain the total loading. This loading was then compared to results from studies intended to assess overall phosphorus loading to the lake.
Materials and methods
Study site
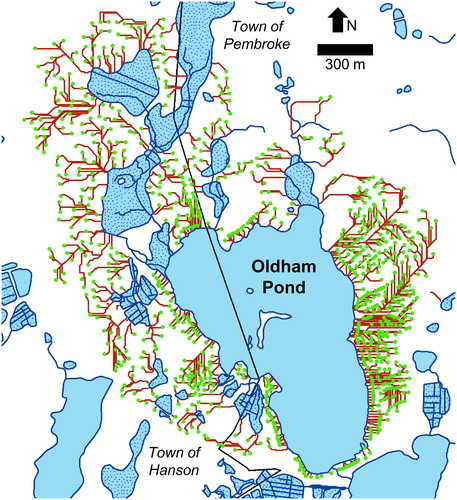
Oldham Pond is a 93.89-ha (232-ac) lake with mean depth of 2.65 m (8.7 ft), located on the border between the towns of Pembroke and Hanson in Plymouth County in southeastern Massachusetts (). The watershed is small, comprising 308.78 ha (763 ac), with 4 small tributary streams to the lake (CEI Citation2011). The watershed is located in a coastal plain that slopes gently toward Massachusetts Bay. The local climate is mild temperate. The lake occupies about 25% of the watershed, and two-thirds of the land area is medium-density residential households, while the remaining one-third is forest, open land, and wetlands (BEC Citation1993; CEI Citation2011). Like most of the lakes in southeastern Massachusetts, including Cape Cod, Oldham Pond lies in glacially deposited sand and gravel and is in contact with an underlying aquifer (Carlson and Lyford Citation2005). Groundwater studies (BEC Citation1993; Carlson and Lyford Citation2005) have concluded that the lake receives much of its inflow from groundwater, and that some outflow from the lake is recharge to the groundwater. The general flow of groundwater in the region is from west to east, under the lake, toward Massachusetts Bay (Carlson and Lyford Citation2005). Locally, along the shoreline the groundwater gradient is toward the lake.
The lake is surrounded by residential development and serves as a major recreation venue for swimming, boating, and fishing. It is eutrophic and supports blooms of algae each summer. In recent years, these blooms have been dominated by cyanobacteria and have often forced town officials to close the lake for swimming. Two studies have been performed to characterize the nutrient enrichment to the lake and to identify potential remedial actions (BEC Citation1993; CEI Citation2011). These studies have concluded that the lake is receiving excess phosphorus input from a number of sources, including overland and point-source runoff and recycling from the lake-bottom sediment. Inputs from groundwater were considered, but longer term inputs were discounted in the belief that phosphorus is readily sorbed to the iron-rich soil and thereby immobilized (BEC Citation1993; CEI Citation2011). Our study only addresses the phosphorus loads transported to the lake from OWS via the groundwater, and does not address the phosphorus loads from all sources. Our estimate of the P load delivered to the lake from OWS is independent of any other sources and not affected by them.
Model description
The model considers three stages of total phosphorus transport: (1) loading from the cesspool or septic tank, (2) loading to the groundwater, and (3) loading to the lake (). The equations for these three stages are described next. The focus of the model is on the long-term (10+ yr) dynamics resulting from development (i.e., installation of systems), cesspool to septic system conversion, laundry detergent phosphorus ban, and travel time (advection and retardation). Variability at shorter time scales (e.g., seasonality of hydrology or household occupancy) is not considered.
Figure 1. Model overview, illustrating the three stages of the model for a conventional septic system.
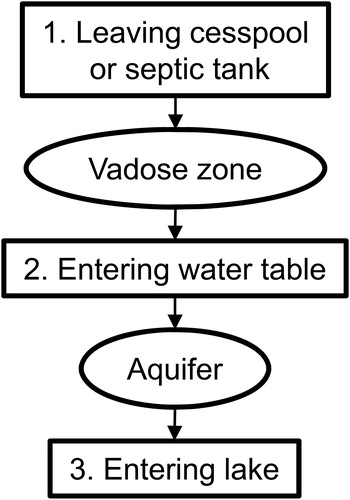
Figure 2. Oldham Pond Watershed, Pembroke and Hanson, Plymouth County, Massachusetts. All 859 OWS locations are shown as circles, and groundwater flow paths as lines. Stippled polygons are wetlands or cranberry bogs.
Stage 1: Loading from the cesspool or septic tank: Wastewater is conveyed to a cesspool or septic tank, where heavier solids sink to the bottom and lighter solids form a scum at the top (USEPA Citation2002). Solids and scum are periodically removed as part of regular system maintenance. The liquid between contains mostly dissolved species. In a conventional septic tank system, liquid effluent is piped to the soil adsorption system (SAS). Before the advent of regulations requiring the use of a septic tank and SAS, a cesspool was common. A cesspool serves the same purposes as the later septic tank, but is built with porous sides and bottom. Effluent is released primarily from the sides of the cesspool. With the advent of septic system regulations, many cesspools were replaced by septic systems and the cesspools were abandoned. In most states (including Massachusetts) replacement is not required until property is sold, at which time an inspection determines compliance with current regulations. The phosphorus loading from the cesspool or septic tank, Weff (M/T), is given by
(1)
(1)
where Ceff is the concentration of phosphorus in the effluent leaving the cesspool or septic tank (M/L3), and Qo is the effluent flow rate (L3/T). Averages of Ceff and Q0 are considered constant, but Ceff can change due to the laundry detergent phosphorus ban.
Stage 2: Loading to the groundwater: The effluent from the conventional septic system is distributed to the SAS via perforated pipes. Below these pipes are several feet of unsaturated soil, also called the vadose zone. After leaving the cesspool or septic tank, the effluent travels vertically through this vadose zone to the groundwater table. Depending on the soil texture, pH, content of metal hydroxides, and depth to the aquifer, a fraction of the phosphorus is sorbed or precipitated, preventing it from reaching the groundwater.
Typically, system installation depths and soil properties are not consistently available, so we use a removal efficiency. The efficiency of the vadose zone in removing phosphorus, η, is defined as
(2)
(2)
where Co is the concentration of phosphorus in the effluent as it reaches the water table (M/L3). The loading from the vadose zone to the groundwater, Wo (M/T), is given by
(3)
(3)
Wo is assumed to be a constant step input to the water table/saturated zone, which assumes that the septic system is mature enough to have reached a steady state. “Steady state” exists when phosphorus sorption and precipitation reactions are retarding phosphorus in the vadose zone at a rate that allows the same load to reach the water table at all times (Robertson Citation1995; Beal et al. Citation2005). The efficiency is different for cesspools and conventional septic systems. For cesspools, the bottom is typically deeper than a conventional SAS and the travel depth through and removal in the vadose zone is less, which can be accounted for by using a lower removal efficiency.
Stage 3: Loading to the lake: Stage 3 considers transport in the aquifer. Once in the aquifer, the effluent plume is advected in the direction of groundwater flow, as well as dispersed in all three dimensions, horizontal, vertical, and transverse to flow. Depending on the soil properties, phosphorus will be retarded by sorption, which is modeled as an instantaneous and reversible process (i.e., local equilibrium). In this conceptual model, the groundwater is an unconfined aquifer of glacially derived sand and gravel typical of southeastern Massachusetts, including Cape Cod, and the aquifer is underlain by an aquaclude, usually bedrock, but sometimes dense silt, clay, or glacial till that is much less permeable than the sand. The focus of our study is on the long-term dynamics, and for that purpose the groundwater hydraulics are considered constant in time (i.e., constant flow velocity). These processes can be described using the advection–dispersion–sorption (ADS) equation (Domenico and Schwartz Citation1990; Schnoor Citation1996). Here, we are concerned with the total loading to the lake by groundwater. Although there will be some vertical and lateral dispersion of the plume, this will not affect the total load to the lake. We therefore use the one-dimensional (1-D) version of the ADS equation. For a continuous step input, and in terms of loading, W, the analytical solution to the 1-D ADS equation is (Ogata and Banks Citation1961):
(4)
(4)
In this equation, erfc is the complimentary error function, t is time (T), and x is distance in the direction of groundwater flow (L); ux is the average pore water velocity in the x direction (L/T2); αx is the dispersion coefficient in the x direction (L); ρb is the soil bulk density (M/L3); n is the effective porosity (L3/L3); Kd is the linear sorption distribution coefficient (L3/M); and R is the retardation due to sorption (dimensionless). The model accounts for the time lag between the input to and output from the aquifer (to the lake) due to advection and adsorption/desorption (retardation).
The total phosphorus load to the lake, W, is calculated using Equationequation 4(4)
(4) for each OWS in the watershed. Calculations were done in MS Excel, using a custom function written in Visual Basic. The input loading, Wo, can change in time for any OWS, by replacement of a cesspool with a conventional septic system and/or a switch to use of a nonphosphorus detergent. Even for those cases when a cesspool was replaced by a conventional septic system, the long time scale of phosphorus transport in groundwater necessitates explicit consideration; the cesspool may have been eliminated, but the plume from it is still “en route” to the down-gradient lake. The analytical solution assumes a continuous step input, but time-variable input can be modeled by combining multiple solutions using the principle of superposition (Freeze and Cherry Citation1979); see Supplement A for an illustration of this superposition calculation.
Model inputs
The Oldham Pond watershed contains 859 OWS serving residences and a few small commercial facilities. We assumed that this number will remain constant in the future, as the watershed is nearly completely developed. A build-out analysis by CEI (Citation2011) indicates that infill development of less than 2% on an area basis (about 13 residences) can be accommodated in the watershed.
The model inputs include, for each of the 859 OWS, the installation time and cesspool to septic system conversion date (if applicable) and the location in the watershed, which was used to derive the flow path using GIS functions (see Supplement B for details). The flow rate (Qo) was based on census data on household occupancy. Groundwater water elevations were based on observations or estimated from ground level and used to calculate the hydraulic slope. The cesspool and septic tank effluent concentrations (Ceff) were based on literature values reported by McCray et al. (Citation2005). Vadose zone efficiency (η) was based on a review of a number of literature sources and local expertise (see Supplement B). Hydraulic conductivity (Ks), effective porosity (n), and longitudinal dispersivity (αx) were based on reported literature values. The distribution coefficient (Kd) was determined from data on the phosphorus plume from the Otis Air Force Base infiltration beds (LeBlanc Citation1984), using a curve-fitting approach. Model inputs are provided () with literature references, and further described in Supplement B.
Table 1. Parameter values.
Results and discussion
Time series of P loading to the lake
Phosphorus loading calculations were performed for the 859 OWS in the Oldham Pond watershed at a time step of 1 year and summed to give the total phosphorus loading to the lake for each year from 1750 to 2250 (); see Supplement C for sample loading time series for 5 OWS. This time period starts when the first OWS was installed and ends when the present-day loading (i.e., assuming no additional development in the watershed going forward) from all OWS reaches the lake. The loading increases with time as the phosphorus from more systems reaches the lake. After the 1994 laundry detergent ban, the predicted loading declined briefly, but then resumed an increasing trend by 2010. This increase is not due to an increase in OWS after 2010 (see earlier discussion), but to a continuous increase in the number of OWS plumes reaching the lake. After about 2070 all the OWS plumes are contributing and the total loading is relatively constant. The model predicts that phosphorus loading from OWS will continue to increase in the future, even with no further development in the watershed.
Figure 3. Estimated total phosphorus loading to Oldham Pond from OWS versus time, 1750 through 2250. Circles are loading estimates by Baystate Environmental Consultants, Inc. (BEC Citation1993; K. Wagner Citation2018, personal communication), and Comprehensive Environmental, Inc. (CEI Citation2011), respectively, as described in the text.
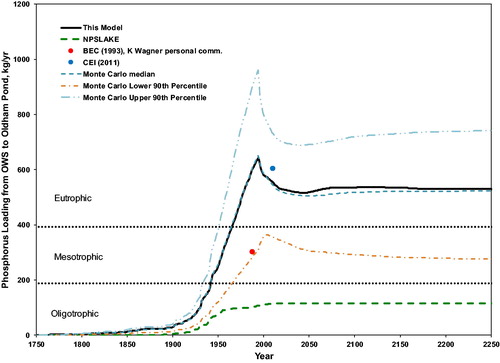
Our model estimates a relatively steep increase in loading from 1930 to 1994. The slope of this increase is consistent with observations of in-lake phosphorus concentration. Specifically, the model slope corresponds to a loading increase by about 15.6% per decade for 1930 to 1996. Observations of average in-lake total phosphorus concentration of 40 μg/L for 1987–1988 (BEC Citation1993) and 66 μg/L for 2006 through 2010 (CEI Citation2011) show that the in-lake total phosphorus concentration increased by about 17.9% per decade from 1988 to 2010. There is a temporal mismatch: For the years corresponding to the observations, the model already predicts a decrease due to the phosphorus detergent ban (discussed further in the next section).
Relation to trophic state and other loading estimates
Trophic status bands for “permissible” and “dangerous” loading (Vollenweider Citation1975) put these loads into the context of lake eutrophication (). Oldham Pond phosphorus loading predicted by the model from OWS alone passed the “dangerous” level into the eutrophic zone by about 1965 and continues to be sufficient to maintain a eutrophic state, without considering any other source of phosphorus to the lake.
We compared our results to an estimate using the NPSLAKE procedure of Mattson and Isaac (Citation1999), that is, 0.5 kg/yr for each household within 100 m of the lake. This procedure is recommended by the Massachusetts Department of Environmental Protection to estimate phosphorus loading when establishing total maximum daily loads (TMDLs) according to the Clean Water Act (CWA Citation2002). Similar procedures based on export coefficients are used elsewhere in the United States and Canada (e.g., Paterson et al. Citation2006; Dillon et al. Citation1994). In 2016, there were 241 households within 100 m of Oldham Pond in the watershed; the NPSLAKE procedure yields an estimated phosphorus loading substantially below our estimate (). Loading estimates based on static export coefficients do not account for variation over time, and the NPSLAKE model does not account for OWS beyond 100 m.
Our estimate of phosphorus loading from OWS via groundwater can be compared to independent estimates based on nutrient budgets. For 1988, our model estimate is 605 kg/yr and considerably above the 302 kg/yr from a study by Baystate Environmental Consultants (BEC Citation1993, revised using improved methods by K. Wagner, original author of the BEC 1993 study, Citation2018, personal communication).
Comprehensive Environmental, Inc. (CEI), estimated the phosphorus input by groundwater in 2010 (CEI Citation2011). It based its estimate on runoff coefficient models and the concentration measurements by BEC (Citation1993). When CEI compared its estimated total load (from all sources) to a value back-calculated from the in-lake phosphorus concentration (using the method of Reckhow (Citation1979)), it concluded that there is a large unaccounted-for source. We attribute that source to groundwater, and the resulting phosphorus loading by groundwater is substantially higher, 604 kg/yr, and comparable to our model estimate for 2010, 556 kg/yr.
Comparison of the model-estimated load to those of the two studies (and their P concentrations, mentioned in the previous section) shows that there is a timing mismatch. The observations suggest a later rise in OWS loading, which may be due to retention in or on the sediment bed, a mechanism not accounted for in the model. Specifically, P entering the lake via groundwater may sorb onto iron oxide on the sediment bed surface or iron oxides precipitated from dissolved iron also carried by the groundwater. In that case the P would enter the lake as part of the “internal loading” at a later time, consistent with the observed mismatch.
Parameter sensitivity analysis and uncertainty (Monte Carlo) analysis
There are a number of sources of uncertainty in our model, including assumptions in the model (e.g., constant vadose zone removal efficiency), spatial input data (number of contributing OWS and their flowpaths), and parameter values. To quantify the sensitivity of the model to the input parameters we performed a parameter sensitivity analysis (see Supplement E.1). The results show that the magnitude of the loading is most sensitive to the effluent concentration (Ceff), and to a lesser extent, to the vadose removal efficiency (η). The timing of loading is sensitive to the hydraulic conductivity (Ks) and distribution coefficient (Kd). To quantify the overall uncertainty in the model results we performed a Monte Carlo analysis (). The results show uncertainty in timing and magnitude. For example, the upper and lower 90% confidence intervals have final loading magnitudes about a factor of 2.0 and 3.1 different from the median or base values, respectively. This level of uncertainty is relatively high, and illustrates the need for more data specific to the Oldham Pond watershed. However, the model still provides important information for management. In climate science, models also have a high level of uncertainty, but it is recognized that they represent our best estimate, and their predictions are used for management (Maslin and Austin Citation2012). We also performed the Monte Carlo analysis using the full literature ranges of parameters (vs. the local ranges used in the preceding). The resulting uncertainty is substantially higher, further highlighting the need for site specific parameter estimates in these types of studies (see Supplement E.3).
Effect of vadose zone immobilization and travel time
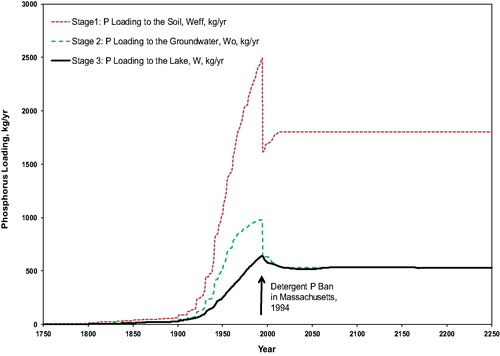
To illustrate the effect of phosphorus immobilization in the vadose/unsaturated zone and retardation in the aquifer/saturated zone, we compared the loading to the lake to that leaving the OWS and entering the groundwater (). The total load leaving all the OWS increased with development of the watershed and exhibits an abrupt drop in 1994 due to the detergent phosphorus ban. The load entering the groundwater is approximately proportional to this, although there are temporal differences in the vadose zone efficiency as cesspools are replaced by septic systems. The load to the lake reflects the retardation and travel time in the groundwater, and shows that the plumes of a substantial fraction of the OWS are still en route to the lake.
Figure 4. Comparison of phosphorus loading by model stage.
Effectiveness of past and potential future management actions
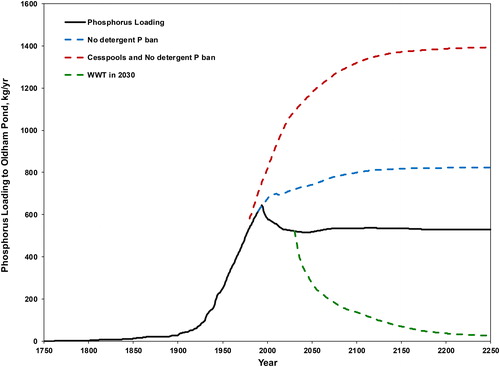
We explored the effect of past management actions, including the 1994 detergent phosphorus ban and the conversion of cesspools to septic systems. If these management actions had not been implemented, phosphorus loading to the lake in 2018 would be 31.4% higher with no detergent phosphorus ban, and 89.5% higher with no ban and continued use of cesspools (). These differences increase for future years. In addition, the model is used to estimate the impact of replacing all OWS by a sewer system and wastewater treatment facility (WWTF). Because design, site selection, licensing, and construction would take time, the year 2030 is used as a facility start date for illustration. We assume the effluent from the WWTF is discharged to the lake. Based on tertiary treatment for phosphorus removal that achieves 100 μg/L P in the effluent (USEPA Citation2007; MADEP Citation2004), the phosphorus loading from the facility could be as low as 18.73 kg/yr. Although the loading to the lake decreases rapidly at first, residual loading continues for many years due to the present reservoir of phosphorus in the aquifer (). The time from installation to when the loading from OWS and WWTF to the lake is cut in half is 20 yr. The loading is estimated to decrease to Vollenweider’s “permissible” load by 2069.
Figure 5. Comparison of model estimated phosphorus loading to estimates (1) if there were no laundry detergent phosphorus ban (blue dashed curve), (2) if all OWS were built as cesspools (red dashed curve), and (3) if all OWS were replaced by a sewer system and WWTP in 2030 (green dashed curve).
Relation to other studies
Our results add to the growing body of evidence that suggests phosphorus from OWS can be a substantial contributor to eutrophication of downstream lakes. Our study is unique in that it explicitly links the OWS source to the lake loading and accounts for the dynamics of system installation, cesspool to septic system conversion, laundry detergent phosphorus ban, and transport and retardation in the groundwater. Past studies have established that groundwater input is significant and have implicated OWS (Vanek Citation1991; Jarosiewicz and Witek Citation2014; Meinikmann et al. Citation2015), or have estimated loadings from OWS, but have not considered the dynamics of transport to the downstream lake (Valiela and Costa Citation1988; Weiskel and Howes Citation1992; Dudley and May Citation2007). Our results suggest that long-term dynamics are important. For example, the model predicts the loading to the lake will continue to increase for several hundred years, even without additional OWS, so long-term dynamics need to be considered. Even with potential overestimation, it is clear that loading from OWS will not decline and represents an ongoing and significant threat to water quality in Oldham Pond.
Management perspective
Our results have serious implications for lakes with similar hydrology, watershed development, and wastewater disposal methods. They suggest that the assumption that OWS are not an important P source due to sorption and precipitation is not justified. This study suggests that current lake management methods to prevent or remediate algae blooms and nuisance plants are not likely to be successful in the long term until the OWS source is addressed. A feature of the OWS groundwater load important for management is the time lag, due to the travel time in the groundwater plus possible temporary incorporation into the sediment bed. That means any management action will affect the lake water column with a substantial time delay. Also, if the groundwater load enters the sediment bed and becomes part of the internal loading, this ongoing input may compromise in-lake management actions (e.g., alum treatment).
If continued use of OWS is elected in lieu of a sewer system and wastewater treatment facility, regulations for OWS should be changed to ensure vadose zone efficiency in immobilizing phosphorus is as high as possible. Additional and continued education of OWS users should emphasize decreased water use to lower the phosphorus load to the OWS, as well.
Further research is needed to quantify the impact of OWS at the watershed level over extended times. More field research is also needed to establish local soil parameters at a watershed scale, especially local average values for Ks, Kd, and vadose zone efficiency, η, to reduce the uncertainty inherent in using average literature values from other watersheds.
Outlook
The model we have presented here can be applied to other lake watersheds and, with some modifications, to a larger scale—regional and national—to characterize the long-term impact of OWS. Many of the required data are available in national databases—for example, population and household data from the U.S. Census; water use data from the U.S. Geological Survey; watershed and surface water body data from the National Hydrography Dataset (USGS); soils data from the USDA-NRCS Soils Survey Manual; and elevation data from the National Elevation Dataset (USGS). These data must be supplemented by local and regional data regarding groundwater aquifers. As in the Oldham Pond study, there will be substantial uncertainty associated with the estimated OWS loading in such a study. However, even “best estimate” or “worst case” loadings will be quite useful for lake managers.
Supplemental Material
Download MS Word (306.6 KB)Acknowledgments
The authors thank Donna Tremontana and Theresa Cocio of the Hanson Health Department and Lisa Cullity of the Pembroke Health Department, who provided data. The lead author thanks Eileen M. Penney for financial support. This article was improved by review and comment by Dr. Ken Wagner and two anonymous reviewers. This research did not receive funding from agencies in the public, commercial, or not-for profit sectors.
Related Research Data
References
- Andres AS, Sims JT. 2013. Assessing potential impacts of a wastewater rapid infiltration basin system on groundwater quality: a Delaware case study. J Environ Qual. 42:391–404.
- Baystate Environmental Consultants, Inc (BEC). 1993. Diagnostic/feasibility study of the Pembroke ponds: Oldham, furnace, little sandy bottom and Stetson ponds. Pembroke, Massachusetts, Longmeadow (MA): BEC.
- Beal CD, Gardner EA, Menzies NW. 2005. Process, performance, and pollution potential: a review of septic tank–soil absorption system performance. Aust J Soil Res. 43(8):781–802.
- Bicki TJ, Brown RB, Collins ME, Mansell RS, Rothwell DF. 1984. Impact of on-site sewage disposal systems on surface and ground water quality. Gainesville (FL): University of Florida, Soil Science Department. Available from: http://www.floridahealth.gov/environmental-health/onsite-sewage/research/_documents/research-reports/_documents/impact-ostds.pdf
- Carlson CS, Lyford FP. 2005. Simulated ground-water flow for a pond-dominated aquifer system near Great Sandy Bottom Pond, Pembroke, Massachusetts: USGS Scientific Investigations Report 2004–5269.
- Comprehensive Environmental Inc (CEI). 2011. Furnace & Oldham Ponds watershed restoration project. Section 604b Project # 2009-07/ARRA 604.
- Cooke GD, Welch EB, Peterson SA, Nichols SA. 2005. Restoration and management of lakes and reservoirs. 3rd ed. Boca Raton (FL): CRC Press.
- Dillon PJ, Scheider WA, Reid RA, Jeffries, DS. 1994. Lakeshore capacity study: part I: test of effects of shoreline development on the trophic status of lakes. Lake Reserv Manage. 8(2): 121–129.
- Dodds WK, Bouska WW, Eitzmann JL, Pilger TJ, Pitts KL, Riley AJ, Schloesser JT, Thornbrugh DJ. 2009. Eutrophication of U.S. freshwaters: analysis of potential economic damages. Environ Sci Technol. 43(1):12–19.
- Domenico PA, Schwartz FA. 1990. Physical and chemical hydrogeology. New York (NY): John Wiley & Sons.
- Dudley B, May L. 2007. Estimating the phosphorus load to waterbodies from septic tanks. Centre for Ecology and Hydrology. Available from: http://nora.nerc.ac.uk/2531/
- Dudley JG, Stephenson DA. 1973. Nutrient enrichment of ground water from septic tank disposal systems. Madison, (WI): Upper Great Lakes Regional Commission, Univ. of Wisconsin, Inland Lake Demonstration Project.
- Eveborn D, Kong D, Gustafsson JP. 2012. Wastewater treatment by soil infiltration: long-term phosphorus removal. J Contam Hydrol. 140–141:24–33.
- Federal Water Pollution Control Act of 1972 (Clean Water Act) [CWA]. 2002. 33 U.S.C. §1251 et seq. (1972). Available from: http://www.epa.gov/laws-regulations/summary-clean-water-act
- Freeze RA, Cherry JA. 1979. Groundwater. Englewood Cliffs (NJ): Prentice-Hall.
- Garabedian SP, LeBlanc DR, Gelhar LW, Celia MA. 1991. Large-scale natural gradient tracer test in sand and gravel, Cape Cod, Massachusetts: 2. analysis of spatial moments for a nonreactive tracer. Water Resour Res 27(5):911–924.
- Gilliom RJ, Patmont CR. 1983. Lake phosphorus loading from septic systems by seasonally perched groundwater. JWPCF. 55(10):1297–1305.
- Heufelder G, Mrockza K. 2006. Evaluation of methods to control phosphorus in areas served by onsite septic systems: the state of the art. Massachusetts: Alternative Septic System Test Center, Barnstable County (MA): Department of Health and Environment. Available from: http://www.barnstablecountyhealth.org/program/wastewater-treatment-systems
- Humphrey CP, Driscoll MA 2011. Biogeochemistry of groundwater beneath on-site wastewater systems in a coastal watershed. Universal J Environ Res Technol. 1(3):320–328.
- Jarosiewicz A, Witek Z. 2014. Where do nutrients in an inlet-less lake come from? The water and nutrient balance of a small mesotrophic lake. Hydrobiologia. 724:157–173.
- Jones RA, Lee GF. 1979. Septic tank wastewater disposal systems as phosphorus sources for surface waters. JWPCF. 51(11):2764–2775.
- Koerner EL, Haws DA. 1979. Long-term effects of land application of domestic wastewater: Vineland, New Jersey rapid infiltration site. US Environmental Protection Agency, Office of Research and Development, EPA-600/2-79–072.
- LeBlanc DR. 1984. Sewage plume in a sand and gravel aquifer, Cape Cod, Massachusetts. USGS Water-Supply Paper 2218.
- Lewandowski J, Meinikmann K, Nützmann G, Rosenberry DO. 2015. Groundwater–the disregarded component in lake water and nutrient budgets. Part 2: effects of groundwater on nutrients. Hydrol Process. 29:2922–2955.
- Lewis WM, Wurtsbaugh WA. 2008. Control of lacustrine phytoplankton by nutrients: erosion of the phosphorus paradigm. Int Rvw Hydrobiol. 93(4–5):446–465.
- Maslin M, Austin P. 2012. Uncertainty: climate models at their limit? Nature. 486: 183–184.
- Massachusetts Department of Environmental Protection [MassDEP]. 2004. Assabet river total maximum daily load for total phosphorus, report number: MA82B-01-2004-01. Available from: www.mass.gov/eea/docs/dep/water/resources/a-thru-m/anuttmdl.pdf
- Mattson MD, Isaac RA. 1999. Calibration of phosphorus export coefficients for total maximum daily loads of Massachusetts lakes. Lake Reserv Manage. 15(3):209–219.
- McCray JE, Kirkland SL, Siegrist RL, Thyne GD. 2005. Model parameters for simulating fate and transport of on-site wastewater nutrients. Ground Water 43(4):628–639.
- Meinikmann K, Hupfer M, Lewandowski J. 2015. Phosphorus in groundwater discharge – a potential source for lake eutrophication. J Hydrol. 524:214–226.
- Moore JW, Schindler DE, Scheuerell MD, Frodge J. 2003. Lake eutrophication at the urban fringe, Seattle Region, USA. AMBIO. 32(1):13–18.
- Ogata A, Banks RB. 1961. A solution of the differential equation of longitudinal dispersion in porous media. USGS Professional Paper 411–A.
- Oosting A, Joy D. 2011. A GIS-based model to assess the risk of on-site wastewater systems impacting groundwater and surface water resources. Can Water Resour J. 36(3):229.
- Paerl HW, Hall NS, Calandrino ES. 2011. Controlling harmful cyanobacterial blooms in a world experiencing anthropogenic and climatic-induced change. Sci Total Environ. 409:1739–1745.
- Paterson AM, Dillon PJ, Hutchinson NJ, Futter MN, Clark BJ, Mills RB, Reid RA, Scheider WA. 2006. A review of the components, coefficients and technical assumptions of Ontario’s lakeshore capacity model. Lake Reserv Manage. 22(1):7–18.
- Reckhow KH. 1979. Uncertainty analysis applied to Vollenweider’s phosphorus loading criterion. JWPCF. 51(8):2123–2128.
- Reneau RB, Hagedorn C, Degen MJ. 1989. Fate and transport of biological and inorganic contaminants from on-site disposal of domestic wastewater. J Environ Qual. 18(2):135–144.
- Reneau RB, Pettry DE 1976. Phosphorus distribution from septic tank effluent in coastal plain soils. J Environ Qual. 5(1):34–39.
- Robertson WD. 1995. Development of steady-state phosphate concentrations in septic system plumes. J Contam Hydrol. 19:289–305.
- Robertson WD. 2003. Enhanced attenuation of septic system phosphate in noncalcareous sediments. Ground Water. 41(1):48–56.
- Robertson WD. 2008. Irreversible phosphorus sorption in septic system plumes? Ground Water 46(1):51–60.
- Robertson WD. 2012. Phosphorus retention in a 20-year-old septic system filter bed. J Environ Qual. 41:1437–1444.
- Robertson WD, Cherry JA, Sudicky EA. 1991. Ground-water contamination from two small septic systems on sand aquifers. Ground Water 29(1):82–92.
- Robertson WD, Schiff SL, Ptacek CJ. 1998. Review of phosphate mobility and persistence in 10 septic system plumes. Ground Water 36(6):1000–1010.
- Schindler DW. 2006. Recent advances in the understanding and management of eutrophication. Limnol and Oceanogr. 51(1, Part 2):356–363.
- Schnoor JL. 1996. Environmental modeling: fate and transport of pollutants in water, air, and soil. New York (NY): John Wiley and Sons, Inc.
- Sikora LJ, Corey RB. 1976. Fate of nitrogen and phosphorus in soils under septic tank waste disposal fields. Presentation at the American Society of Agricultural Engineers 1975 Winter Meeting, Chicago, IL, December 1975. Available from: http://www.soils.wisc.edu/sswmp/pubs/7.5.pdf
- Stolt MH, Reneau RB 1991. Potential for contamination of ground and surface waters from on-site wastewater disposal systems. Final Report to the Virginia Department of Health. Available from: https://www.vdh.virginia.gov/EnvironmentalHealth/ONSITE/technicalresources/documents/2011/pdfs/Potential%20for%20Contamination%20of%20Ground%20and%20Surface%20Waters%20from%-site%20Wastewater%20Disposal%20Systems%20.pdf
- US Environmental Protection Agency (USEPA). 2002. Onsite Wastewater Treatment Manual. EPA 625-R-00.
- U.S. Environmental Protection Agency (USEPA). 2007. Advanced Wastewater Treatment to Achieve Low Concentration of Phosphorus. EPA 910-R-07-002.
- Valiela I, Costa JE. 1988. Eutrophication of Buttermilk Bay, a Cape Cod coastal embayment: concentrations of nutrients and watershed nutrient budgets. Environ Manage. 12(4):539–553.
- Vanek V. 1991. Riparian zone as a source of phosphorus for a groundwater-dominated lake. Water Res. 25(4):409–418.
- Vollenweider RA. 1975. Input-output models, with special reference to the phosphorus loading concept in limnology. Hydrologie. 37(1):53–84.
- Wagner, K. editor, Lake Res Manage, 2018, personal communication.
- Wagner KJ, Meringolo D, Mitchell DF, Moran E, Smith S. 2017. Aluminum treatments to control internal phosphorus loading in lakes on Cape Cod, Massachusetts. Lake Reserv Manage. 33(2): 171–186.
- Walter DA, Rea BA, Stollenwerk KG, Savoie J. 1996. Geochemical and hydrologic controls on phosphorus transport in a sewage-contaminated sand and gravel aquifer near Ashumet Pond, Cape Cod, Massachusetts. USGS Water-Supply Paper 2463.
- Weiskel PK, Howes BL. 1992. Differential transport of sewage-derived nitrogen and phosphorus through a coastal watershed. Environ Sci Technol. 26(2):352–360.
- Whelan BR, Barrow NJ. 1984. The movement of septic tank effluent through sandy soils near Perth. II. Movement of phosphorus. Aust J Soil Res. 22:293–302.