
 ?Mathematical formulae have been encoded as MathML and are displayed in this HTML version using MathJax in order to improve their display. Uncheck the box to turn MathJax off. This feature requires Javascript. Click on a formula to zoom.
Abstract
Munger ZW, Carey CC, Gerling AB, Doubek JP, Hamre KD, McClure RP, Schreiber ME. 2018. Oxygenation and hydrologic controls on iron and manganese mass budgets in a drinking-water reservoir. Lake Reserv Manage. 35:277–291.
In seasonally stratified lakes and reservoirs, fluctuating hypolimnetic oxygen and hydrologic conditions in the watershed can influence the retention of metals and their exchange between the sediments and water column. In particular, iron (Fe) and manganese (Mn) cycling at the sediment–water interface can be dynamic in response to variability in the watershed and within the waterbody, which has substantial implications for drinking water quality. We calculated a mass budget for Fe and Mn in a shallow drinking-water reservoir over a 2-year period in which we manipulated the tributary inflow rate and dissolved oxygen (DO) concentrations in the hypolimnion at the reservoir scale. We found that the net Fe and Mn release from the sediments into the water column was suppressed during oxygenation; however, both metals continued to be released from the sediments, even during well-oxygenated conditions. Oxygenation in the hypolimnion had no effect on the net export of metals from the reservoir to downstream. Instead, the overall net export of Fe and Mn during the stratified period was influenced by hydrologic inflows. In summary, we found that manipulating hypolimnetic oxygenation had an important effect on the cycling of Fe and Mn within the hypolimnion, but that the net retention of metals in the reservoir was driven primarily by hydrology.
Keywords:
The biogeochemical cycles of iron (Fe) and manganese (Mn) can have substantial effects on water quality in freshwater lakes and reservoirs. Elevated concentrations of Fe and Mn in the water column cause staining, odor, and undesirable taste, which require treatment prior to potable use (USEPA Citation2017; WHO Citation2008). Furthermore, the reductive dissolution of oxidized, insoluble Fe- and Mn-oxyhydroxides in lake and reservoir sediments can release adsorbed trace metals, some of which are toxic at low concentrations (e.g., arsenic and cadmium), into the water column (Balistrieri et al. Citation1994; Olivie-Lauquet et al. Citation2001). Consequently, determining the controls of Fe and Mn cycling in lakes and reservoirs is paramount for communities that rely on these freshwater ecosystems for drinking-water supply.
Metal cycling within lakes and reservoirs is influenced by redox conditions, which affect the transformation of metals from oxidized, insoluble to reduced, soluble forms (Davison and Woof Citation1984; Aguilar and Nealson Citation1998; Zaw and Chiswell Citation1999; Beutel et al. Citation2008; Giles et al. Citation2016). Under oxic (dissolved oxygen [DO] concentrations >2 mg/L) conditions, Fe and Mn generally occur as stable oxyhydroxides in sediments. However, the establishment of anoxic conditions (DO concentrations <0.5 mg/L) in sediments during thermal stratification favors soluble forms of Fe and Mn, which accumulate in the sediment pore waters and diffuse into the overlying water column (Davison Citation1993).
As DO depletion is an important factor controlling the release of Fe and Mn from sediments into the overlying water column, oxygenation is increasingly used to manage Fe and Mn in drinking water reservoirs (Beutel and Horne Citation1999; Engstrom Citation2005). Some oxygenation systems are able to successfully reduce the rate of Fe and Mn release from the sediments into the water column (Gantzer et al. Citation2009; Bryant et al. Citation2011; Munger et al. Citation2016), but Fe and Mn release can still occur in oxygenated conditions, necessitating additional examination of the hydrological and biogeochemical processes that interact to influence Fe and Mn budgets in lakes and reservoirs.
Loading from hydrologic inputs also has important effects on water column metal concentrations. Fe and Mn loads from hydrologic inputs to lakes and reservoirs have been estimated to contribute between 10 and 50% of the total water column metal mass annually (Davison Citation1981; Hongve Citation1997; Graham et al. Citation2002). There is inherent seasonal variability in the metal loading from hydrologic inputs to lake and reservoir ecosystems. For example, Hongve (Citation1997) reported hydrologic loading of Fe and Mn into a reservoir that varied by more than a factor of 10 during a year in response to changing streamflow conditions. Metals are also exported from waterbodies; for example, Davison (Citation1993) found that ∼10% of the soluble Fe released from sediments into the water column of a meromictic lake was lost via surface water outflows, while the remaining 90% was eventually oxidized and returned to the sediments. Understanding the effects of changing hydrologic loads to lakes and reservoirs is needed for predicting how changes in watershed hydrology (e.g., resulting from storms, channelization, or flow regulation) can alter Fe and Mn cycles.
While both redox-mediated release from the sediments and hydrologic loading contribute substantial quantities of Fe and Mn to the water column of lakes and reservoirs, which processes dominate metal budgets under different environmental conditions remains unknown. Determining the relative importance of loads for Fe and Mn budgets is critical because the magnitude and timing of these loads may become more variable for many waterbodies as a result of global change. Many lakes and reservoirs are experiencing increased anoxia due to land use and climate (Jenny et al. Citation2016), which can affect loading of metals from sediment into the water column. In addition, some lakes and reservoirs are also experiencing increased storm frequency and intensity (Prein et al. Citation2017), which can mobilize sediments from the catchment, thus increasing hydrologic loads of metals. Untangling the relative contributions of these sources of metals to waterbodies is challenging, as these loads are not easily manipulated simultaneously. Accurately characterizing the processes controlling metal cycling requires manipulations at the waterbody scale to quantify how these processes interact to control Fe and Mn budgets. Results from these experiments can be used to optimize management strategies for controlling Fe and Mn in drinking-water supply waterbodies.
We conducted a reservoir-scale experiment in which we manipulated both hydrologic and redox-mediated loads to examine their relative importance for reservoir Fe and Mn budgets. Our experiments were centered on testing 2 predictions: (1) Increased oxygenation would increase metal retention; and (2) increased hydrological inputs would increase the export of metals from the reservoir downstream. By manipulating a hypolimnetic oxygenation system in the reservoir, we established either alternating oxic and anoxic hypolimnetic conditions (2014) or continuous oxygenation (2015) during the summer stratified period. Simultaneously, by manipulating the tributary inflow entering the reservoir, we also created periods of elevated and lower flow conditions. In addition to our manipulations, seasonal precipitation created periods of elevated loads of other hydrologic inputs (groundwater/runoff) to the reservoir. Our overarching goal was to evaluate how changing selected hydrologic inputs and hypolimnetic oxygen conditions impacted the ability of the reservoir to serve as a sink or source of Fe and Mn to downstream environments.
Study site
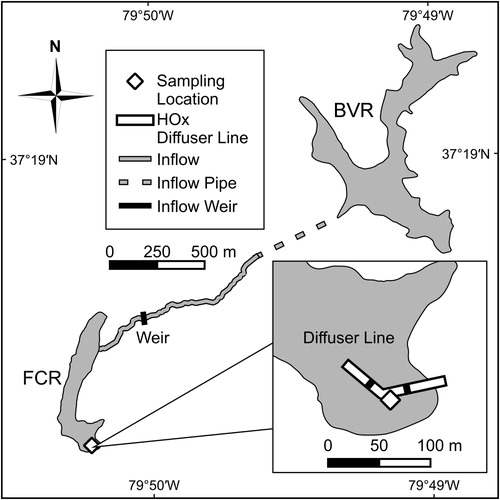
Falling Creek Reservoir (FCR) is a shallow (maximum depth 9.3 m), small (119,900 m2; ∼12 ha), and old (constructed in 1898) dimictic drinking-water reservoir located in a forested watershed in southwestern Virginia (). FCR is primarily fed by a tributary that receives water from upgradient Beaverdam Reservoir (BVR; ) Both reservoirs develop hypolimnetic anoxia in response to thermal stratification between April and October and have similar catchment land use history and water chemistry (Gerling et al. Citation2016). During the summer stratified period, phytoplankton blooms and elevated concentrations of Fe, Mn, and P associated with hypolimnetic anoxia have been documented in FCR (Gerling et al. Citation2014, Citation2016). Hypolimnetic concentrations of nitrate + nitrite and sulfate in FCR are less than 100 μg/L and 200 μg/L, respectively (Gerling et al., Citation2016; Munger, Citation2016).
Figure 1. A map of the Falling Creek Reservoir (FCR), located in Vinton, VA. Beaverdam Reservoir (BVR) drains into the primary inflow feeding FCR. Water samples were collected at the deepest site in the reservoir; tributary inflow samples were collected at the weir. Inset shows the approximate orientation of the hypolimnetic oxygenation (HOx) diffuser line.
Materials and methods
Oxygen manipulation
A side stream supersaturation oxygenation system was deployed at FCR in 2012 to mitigate the effects of hypolimnetic anoxia. The hypolimnetic oxygenation (HOx) system withdraws water from the reservoir at 8.5 m depth and pipes it to an onshore oxygen contact chamber. Oxygen gas is injected into the water in the contact chamber, resulting in DO concentrations that are supersaturated with respect to hypolimnetic conditions. The oxygenated water is transferred back to the hypolimnion and released through a distribution header positioned at 8.5 m depth. Evenly spaced eductor nozzles on the distribution header promote mixing of oxygenated water throughout the hypolimnion without disturbing the bottom sediments. See Gerling et al. (Citation2014) for a more detailed description of the oxygenation system.
We created alternating intervals of anoxic and well-oxygenated conditions in the hypolimnion of FCR by manipulating HOx system operation (). The HOx system was not operated prior to the onset of thermal stratification each year. We activated the HOx system after DO concentrations near the bottom sediments reached approximately 50% saturation after the onset of stratification in both May 2014 and May 2015. In 2014, we deactivated the HOx system during 2 summer intervals each lasting ∼4 weeks; during each period of deactivation, the bottom of the hypolimnion became anoxic. In 2015, we continuously operated the HOx system throughout the summer stratified period, except for a 1-week interval beginning 1 June, and several hours on 27 July for HOx system maintenance.
Table 1. Dates of HOx system activation.
Tributary inflow manipulations
The tributary inflow that enters FCR from the epilimnion of BVR can be manipulated by opening or closing an intake valve in BVR. Flow from BVR is channeled through an underground pipe for ∼750 m before discharging into the tributary (). After entering the tributary, the water flows an additional ∼950 m in a shallow (<1 m depth) stream before entering FCR. Discharge in the tributary inflow is measured with a contracted rectangular weir located ∼150 m upgradient from FCR. Over 90% of the surface inflow volume to FCR comes through the weir (Gerling et al. Citation2016).
We manipulated discharge in the tributary inflow by opening the epilimnetic intake valve within BVR. On 28 April 2014, we opened the intake valve to match the elevated flow conditions measured at the weir after large storms in the watershed in 2013. The intake remained open throughout the summer of 2014, resulting in continuously elevated flow rates of water entering FCR that were approximately 4 times higher than when the valve was closed (Gerling et al. Citation2016). By early September 2014, the water level in BVR had decreased to a depth below the intake opening and discharge in the tributary inflow returned to normal (closed valve) levels. The flow rate in the inflow tributary remained at these low levels for the duration of our monitoring period.
Data collection
We monitored temperature and DO at least weekly in FCR and in the tributary inflow between April and October in 2014 and 2015. Depth profiles of temperature and DO were collected at the deepest site in FCR (Sampling Location, ) 1–3 times per week using a Seabird Electronics SBE 19plus high-resolution profiler (CTD) (Gerling et al. Citation2014). Temperature and water level in the tributary inflow were measured every 15 min at the weir () using an INW Aquistar PT2X pressure sensor. We also measured the water level in the reservoir and the stage over the spillway each day using a staff gage. The flow velocity over the dam spillway was measured using a current meter and the discharge was calculated using the velocity–area method (Fetter Citation2001). Measurements of flow velocity over the spillway were collected to construct a rating curve. Daily measurements of precipitation were collected using a rain gauge at the water sample collection site.
We measured Fe and Mn concentrations weekly in FCR and its tributary inflow between April and October in 2014 and 2015. Water samples were collected from 9 depths in the water column of FCR in 2014 (0.1, 0.8, 1.6, 2.8, 3.8, 5.0, 6.2, 8.0, and 9.0 m) and 7 depths in 2015 (0.1, 1.6, 3.8, 5.0, 6.2, 8.0, and 9.0 m) using a 4-L Van Dorn sampler (Wildlife Supply Company). These sampling depths matched the depths of the outflow valves of the reservoir to the water treatment plant. We also collected water samples in the inflow stream at the weir (∼150 m upgradient from FCR). We collected both total and soluble (filtered through 0.45 μm pore size filters) water samples from the reservoir and the tributary. Samples were preserved by lowering the pH to <2 with trace metal grade nitric acid after collection. We analyzed the samples for total and soluble Fe and Mn using an ICP-MS (Thermo Electron X-Series) following APHA Standard Method 3125-B (APHA Citation1992).
Data analysis
We calculated a metals budget in FCR using discharge measurements of the inflows and outflows to FCR and their concentrations of Fe and Mn. We used the metals budget to quantify the net release of Fe and Mn from the sediments into the hypolimnion and the net retention of these metals in the reservoir under different tributary inflow and hypolimnion oxygen scenarios.
Water budget
The water budget was calculated using
(1)
(1)
where dV/dt (m3/d) is the daily change in reservoir volume, Qtrib (m3/d) is the daily tributary inflow discharge, P (m/d) is the daily precipitation, A (m2) is the reservoir surface area at full pond (119,900 m2), Qspw (m3/d) is the daily spillway discharge, Qwtp (m3/d) is the daily water treatment withdrawal rate, E (m/d) is the daily direct evaporation rate, and Qgwr (m3/d) is the inflow unaccounted for by the other terms, which includes other unmeasured flows such as groundwater and direct surface runoff. We measured all inflows and outflows with the exception of E, which we estimated using the Priestley–Taylor method (see further discussion below) and Qgwr, the net groundwater/runoff term, which we solved for using EquationEquation 1
(1)
(1) on a daily time step to balance the water budget.
We calculated the daily change in reservoir volume using the water-level measurements in FCR from
(2)
(2)
where z (m) is the depth of the water level in FCR below full pond (508 m above mean sea level). The coefficients in Equationequation 2
(2)
(2) were determined from a polynomial regression of the cumulative reservoir volume as a function of depth. We calculated the mean daily discharge in the tributary inflow using the water-level measurements at the weir (Gerling et al. Citation2014). We calculated the discharge over the spillway using an empirical equation derived from the measured discharge and water-level measurements:
(3)
(3)
where zs (m) is the water level above the spillway crest, and the coefficients in Equationequation 3
(3)
(3) were determined from a polynomial regression of discharge as a function of stage at the spillway crest (Fig. S1), following Holmes et al. (Citation2001). Direct evaporation from the reservoir was calculated using the Priestley-Taylor method modified from Rosenberry et al. (Citation2007):
(4)
(4)
where α (1.26) is the Priestley–Taylor constant, mvap (kPa/C) is the slope of the saturated vapor pressure–temperature curve at the mean daily temperature, γ (kPa/C) is the psychometric constant, Rnet (MJ/m2d) is the net radiation, lvap (2.26 MJ/kg) is the latent heat of vaporization, and ρ (998 kg/m3) is the density of water. Daily air temperature data were obtained from the Roanoke–Blacksburg Regional Airport via the National Oceanic and Atmospheric Administration (NOAA) National Centers for Environmental Information (Menne et al. Citation2016). Radiation fluxes were obtained from the NASA CERES SYN1deg-Day Ed3A dataset (Wielicki et al. Citation1996). Although the Priestley–Taylor method produces an estimate of evaporation, the method yields estimates with high accuracy (within measurement error of direct measurements), as shown by Rosenberry et al. (Citation2007).
The tributary inflow water was consistently >2 C colder than the water column of FCR; thus, we assumed that the tributary water entered the hypolimnion after reaching FCR (Gerling et al. Citation2016). To balance the addition of the tributary inflow into the constant hypolimnion volume, we assumed that water was being entrained from the hypolimnion across the thermocline at a rate equivalent to the tributary inflow discharge into the hypolimnion (Gerling et al. Citation2016). We determined the thermocline depth for each CTD temperature profile by analyzing those data with Lake Analyzer, a Matlab program (Read et al. Citation2011).
Metals budget
We calculated the metals budget in the hypolimnion at weekly intervals using
(5)
(5)
where dMhyp/dt (kg/d) is the rate of change in metal (Fe or Mn) volume-weighted mass in the hypolimnion between weekly measurements, Linf (kg/d) is the metal loading in the tributary, Lth (kg/d) is the metal loading across the thermocline, and Lexch (kg/d) is the net metal loading from the sediments into the hypolimnion water column.
Although we solved for groundwater/runoff inflow using the water balance (Equationequation 1(1)
(1) ), and installed 4 shallow wells around the reservoir to measure metals concentrations in shallow groundwater (Munger Citation2016), we did not use Qgwr to calculate groundwater metals loading for several reasons: (1) Our estimate of groundwater inflow is combined with surface runoff and other unmeasured flows, so it is not specific to groundwater; (2) previous studies have documented that shallow groundwater chemistry is not indicative of chemistry that actually enters lakes/reservoirs due to spatial heterogeneity of concentrations (Brock et al. Citation1982); (3) three-dimensional flowpaths of groundwater to surface-water bodies are complex and difficult to map without extensive field monitoring and modeling (Lewandowski et al. Citation2015, Rosenberry et al. Citation2015); (4) redox conditions can change rapidly across the sediment–water interface (i.e., the hyporheic zone), and strongly control the transport of redox-sensitive metals (Harvey and Fuller Citation1998, Brown et al. Citation2007); and (5) the sediment–water interface is highly reactive, affecting transport of metals and other elements that can react with surfaces of minerals and organic matter (Lewandowski et al. Citation2015). Thus, to calculate the metals budget, we assumed that groundwater that entered the reservoir subsequently mixed and became integrated with sediment pore water.
The net metal loading term, Lexch, represents the balance between the rate of metal release from the sediments into the water column and the return of metals from the water column back to the sediments, where positive Lexch values indicate that the rate of metal release from the sediments into the water column was greater than the rate at which metals returned to the sediments. We used metal concentrations measured at 5 m depth, which was always just below the thermocline in both years, to calculate the metal loading across the thermocline. The vertical transfer of water across the thermocline into the epilimnion was the only outflow from the hypolimnion; the spillway and intakes for the water treatment plant removed water from the epilimnion throughout the monitoring period.
The metal mass in the hypolimnion was calculated for each sampling date by linearly interpolating the measured weekly metal concentrations in the hypolimnion at the sampling depths using bathymetry data from Gerling et al. (Citation2014) and multiplying the interpolated metal concentration data by the volume of water in each layer corresponding to those depths. The hypolimnion mass was the sum of the masses in each water layer below the thermocline. We calculated dMhyp/dt as the difference between the hypolimnion metal mass over the preceding week divided by 7 days.
We calculated weekly inflow and outflow metal loadings as the sum of the daily loads divided by 7 days. To calculate daily loadings, we first linearly interpolated the metal concentrations in the tributary, spillway, and water treatment at each day. The loadings were then calculated using the daily flow measurements with
(6)
(6)
where Lj (kg/d) is the metal (Fe or Mn) loading at location j (e.g., tributary inflow, spillway outflow, water treatment intakes), Cj (kg/m3) is the metal concentration at j, and Qj (m3/d) is the flow rate at j.
Finally, we calculated the net export of Fe and Mn from the reservoir following the approach used in Cook et al. (Citation2010):
(7)
(7)
where Lnet (kg/d) is the net export metal (Fe or Mn) loading from the reservoir, Linf (kg/d) is the metal input from the tributary, Lspw (kg/d) is the metal export in the spillway, and Lwtp (kg/d) is the metal export through the water treatment plant (WTP) intakes. The net retention rate, Lnet, represents the balance between metal export and import in the reservoir, where positive Lnet indicates that more metal mass is being exported from the reservoir via the spillway and water treatment intakes than is being imported via the inflows—that is, the reservoir acts as a source of metals to downstream. Over time, consistently negative Lnet indicates that metal mass is retained in the reservoir and its sediments.
Results
Water balance and tributary flow
Inflow from the upstream tributary was the largest water source to the reservoir during our study, comprising an average of 56 ± 23% and 66 ± 31% of the total water input in 2014 and 2015, respectively (±1 standard deviation [SD]; ). During the 4-month period after opening the intake in BVR in April 2014, the mean tributary inflow (8.1 ± 0.3 ML/d) was ∼144% higher than the mean tributary inflow observed during the rest of the study (3.3 ± 1.8 ML/d; ). Inflows from groundwater/runoff (unmeasured inflows), which were estimated from Equationequation 1(1)
(1) , were also a substantial water source to FCR, comprising 42 ± 21% and 29 ± 30% of the total water input on average in 2014 and 2015, respectively. Direct inputs from precipitation were generally a minor component of the total input, comprising 3 ± 7% and 5 ± 13% of the input on average in 2014 and 2015, respectively.
Figure 2. Daily change in reservoir volume (top); inflows (tributary, groundwater (GW)/runoff, and precipitation entering FCR; middle); and outflows (spillway discharge, water treatment plant [WTP] withdrawals, and direct evaporation from FCR; bottom) in 2014 (left) and 2015 (right). Horizontal bars above plot indicate periods of elevated tributary and groundwater/runoff inflow.
![Figure 2. Daily change in reservoir volume (top); inflows (tributary, groundwater (GW)/runoff, and precipitation entering FCR; middle); and outflows (spillway discharge, water treatment plant [WTP] withdrawals, and direct evaporation from FCR; bottom) in 2014 (left) and 2015 (right). Horizontal bars above plot indicate periods of elevated tributary and groundwater/runoff inflow.](/cms/asset/dfe64fff-4a1e-49fa-898c-0a1358903cd3/ulrm_a_1545811_f0002_b.jpg)
The outflows were dominated by the spillway at the surface of the reservoir, which contributed 56 ± 27% of the total outflow on average in both years (). The water treatment intakes removed ∼3.3 ML/d (27 ± 14% of the total outflow on average in both years) when the treatment plant was operational; however, no water was removed from FCR via the water treatment intakes after 19 September 2014 or after 9 July 2015 throughout autumn. Direct evaporation from the surface of FCR contributed 13 ± 18% of the total outflow on average.
Dissolved oxygen conditions
The water column in FCR began to stratify in April of 2014 and 2015 and remained stratified until October in both years (Fig. S2). Prior to April in each year, DO concentrations and temperature were relatively uniform with depth through the water column in FCR. By mid-April in each year, a thermocline developed between the warmer, top ∼4 m in the water column and deeper, cooler water. The temperature gradient persisted between April and October in both years, during which time we observed greater DO consumption in the hypolimnion in the absence of oxygenation.
By manipulating the HOx system, we substantially altered DO concentrations in the hypolimnion of FCR during the summer stratified periods in 2014 and 2015 (). When the HOx system was deactivated in 2014 and 2015, the volume-weighted mean hypolimnion (VWH) DO concentration rapidly decreased at a mean rate of 0.16 ± 0.04 mg/L/d in both years (1 SD; ). When the HOx system was activated, the VWH DO concentration increased at a mean rate of 0.04 ± 0.03 mg/L/d in both years. DO concentrations rapidly homogenized throughout the hypolimnion due to mixing induced by the HOx system.
Figure 3. Mean volume-weighted hypolimnion (VWH) DO concentrations and DO concentrations just above the sediments (“Bottom”; 9.3 m depth) in 2014 (left) and 2015 (right). Vertical dashed and solid lines indicate when the HOx system was activated and deactivated, respectively. Periods of activation (“Oxygenated”) or deactivation (“Non-oxygenated”) are shown in horizontal bars above plot. Note short period of deactivation in late July 2015 that is not visible in the horizontal bar. HOx system turned off in mid-November of both years (not shown on figure).
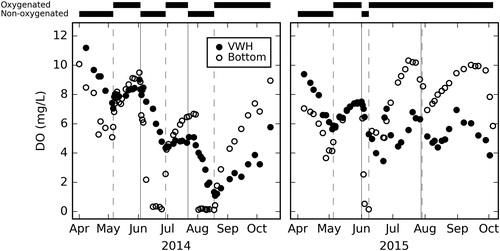
Operation of the HOx system prevented the development of anoxic conditions above the sediment–water interface (). DO rapidly depleted above the sediments when the HOx system was deactivated, which resulted in anoxic conditions at the bottom waters during 2 periods in the summer of 2014 and one period in the summer of 2015. During the 2 deactivation periods in summer 2014, anoxic conditions developed above the sediments within a week after deactivation. We continuously operated the HOx system for most of the summer stratified period in 2015 and anoxic conditions above the sediments were only observed () during a 1-week period of deactivation in early June 2015. Oxic conditions persisted above the sediments whenever the HOx system was activated.
Hypolimnetic Fe and Mn mass
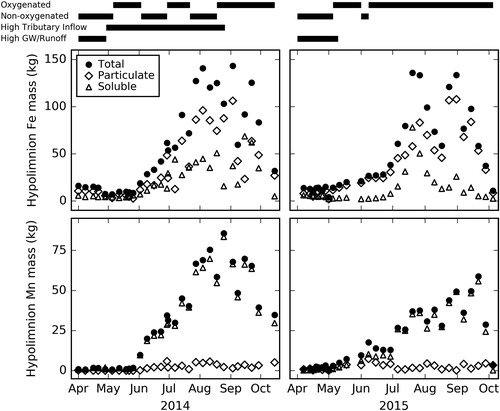
Total Fe and Mn mass increased in the hypolimnion during the summer stratified period regardless of HOx system operation (). Overall, the total Fe fraction was dominated by particulate (total – soluble) forms, while the total Mn fraction was dominated by soluble forms. During the early stratified period (between April and May), total Fe and Mn mass in the hypolimnion was low, but later in the summer stratified period (between June and September), the total Fe mass in the hypolimnion increased by a factor of ≥8 and total Mn mass increased by a factor of ≥60 (). When the HOx system was activated in June and August 2015, the mean soluble Fe and Mn masses in the hypolimnion were 43% and 39% lower, respectively, compared to the same time periods in 2014 when the HOx system was deactivated and we observed anoxic conditions above the sediments (; Fig. S3). In both years, Fe mass and, to a lesser extent, Mn mass sharply decreased concomitant with the activation of the HOx system; this pattern is observed in mid-August in 2014, after a 3-week period of inactivation, and in late July (27–28 July) in 2015 after a very short period (<1 day) of inactivation.
Figure 4. Mass of total Fe (top) and Mn (bottom) in the hypolimnion in 2014 (left) and 2015 (right). Horizontal bars above plot indicate periods when the HOx system was activated (“Oxygenated”) or deactivated (“Non-oxygenated”) and periods of elevated tributary and groundwater/runoff inflow (see ). Note short period of deactivation in late July 2015 that is not visible in the horizontal bar.
Fe and Mn exchange between sediments and the hypolimnion
We observed net release (positive Lexch; Equationequation 5(5)
(5) ) of total and soluble Fe and Mn from the sediments into the hypolimnion during most of the summer stratified period in 2014 and 2015 (). Early in the summer stratified period (between April and May), the release of total and soluble Fe and Mn from sediments to the water column was negligible; however, between May and June 2014 when the tributary inflow discharge was elevated, we calculated negative Lexch values for total Fe and, to a lesser degree, soluble Fe and total Mn, indicating that these metal fractions accumulated in the reservoir sediments faster than they were released into the water column (). Between June and September in both years, when the water column was stratified, we observed net release of total and soluble Fe (maximum 20 kg/d; mean 4.2 ± 5.9 kg/d) and Mn (maximum 14 kg/d; mean 3.4 ± 3.8 kg/d) into the water column, including when the hypolimnion was well oxygenated in 2015 ().
Figure 5. Exchange (Lexch) of total (top) and soluble (bottom) Fe and Mn between sediments and the hypolimnion in 2014 (left) and 2015 (right). Positive exchange indicates release of mass from sediments to the water column exceeds return of metals from water column to sediments. Horizontal bars above plot indicate periods when the HOx system was activated (“Oxygenated”) or deactivated (“Non-oxygenated”) and periods of elevated tributary and groundwater/runoff inflow (see ). Note short period of deactivation in late July 2015 that is not visible in the horizontal bar.
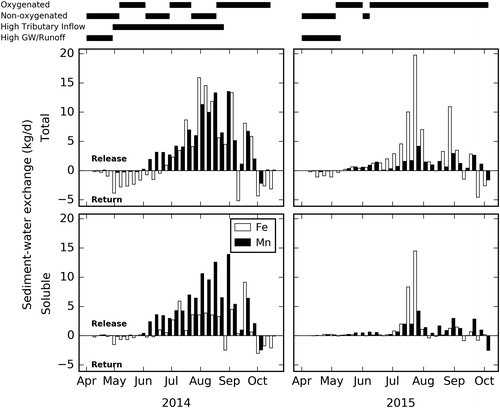
The net release of both total and soluble metals was higher in 2014, which experienced 53 days of HOx system deactivation, compared to 2015, which had only 8 days of HOx system deactivation (). Over the monitoring period in 2014, the mean loading of total Fe and Mn from sediments was 137% and 200% higher, respectively, than the mean loading of total Fe and Mn in 2015 (). We observed the largest positive Lexch values for both fractions of Fe and Mn in July and August in both years, indicating that the largest net release of metal mass from the sediments into the water column occurred during these 2 months of the summer stratified period, regardless of oxygenation.
Retention and export of Fe and Mn
After opening the inflow intake in BVR in late April 2014, the loading of total and soluble Fe and Mn into the reservoir from the tributary inflow (Linf) increased by a factor of 3 and remained elevated until September 2014 (). Between late April and late August 2014, the loading of total Fe and Mn in the tributary inflow was more than twice as high as the tributary loading measured during the rest of the study, on average. Although the loading of soluble Fe and Mn in the tributary inflow was generally low in comparison to the total fractions, the soluble fraction loadings were also much higher (by a factor of 5 or more) during the period of elevated tributary flow (between late April and late August 2014) compared to the rest of the study ().
Figure 6. Loading of Fe and Mn in the tributary inflow and outflows (top 4 panels) and net export of total and soluble Fe and Mn (Lnet; bottom 4 panels) from FCR to downstream in 2014 (left) and 2015 (right); left y-axes show Fe data and right y-axes show Mn data. Positive net export indicates reservoir is a metal source to downstream; negative net export indicates reservoir is a metal sink. Horizontal bars above plot indicate periods when the HOx system was activated (“Oxygenated”) or deactivated (“Non-oxygenated”) and periods of elevated tributary and groundwater/runoff inflow. Note short period of deactivation in late July 2015 that is not visible in the horizontal bar.
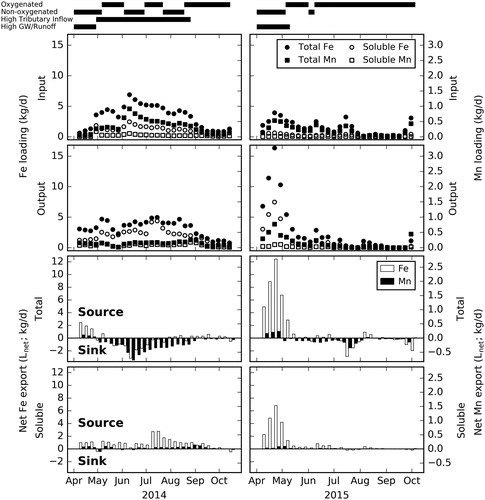
We observed net export of total and soluble Fe and Mn in April and May in 2014 and 2015 (). In 2014, the output loading of Fe and Mn did not vary substantially between April and September. However, input loading from the tributary inflow between April and early May 2014 was 42% and 62% lower, respectively, compared to the rest of the monitoring period in 2014. This resulted in a shift from net export when the tributary inflow inputs were smaller to net retention when the tributary inflow discharge increased later in the monitoring period. In 2015, the output loading of Fe and Mn was 127% and 115% higher, respectively, between April and May 2015 compared to the rest of the monitoring period, which we attribute to the much higher precipitation and elevated groundwater/surface runoff in April and May 2015 ().
As the summer progressed in both years, we observed a shift from net export to net retention of the total fraction of Fe and Mn into the reservoir (negative Lnet; ), and the reservoir served as a net sink of total metals for most of the stratified period. The transition to net retention of total metals occurred concurrent with opening the intake valve in BVR in late April 2014. The net retention of the total metal fractions into FCR persisted while the tributary inflow loading remained elevated between May and September 2014 (). In 2015, we also observed a transition from net export to net retention of total metals in response to a pattern of decreasing outflow discharge in May 2015. Between May and August, a large decrease in outflow resulted in net retention. In contrast to the total metal fractions, soluble Fe and Mn fractions were exported from FCR downstream during spring and throughout the summer stratified period in both years.
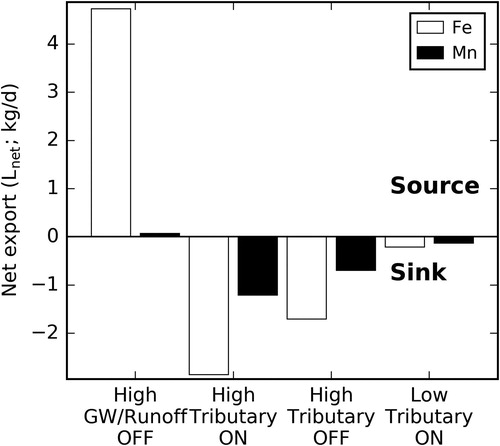
Examining the combination of oxygen and hydrologic conditions on the net export of metals from FCR, we observe that the reservoir behaves predominantly as a sink for total metals in the watershed (). The only condition under which the reservoir consistently behaved as a source of total metals downstream was in April–May when groundwater/surface runoff inflow was elevated. Comparing the high tributary inflow coupled with oxygenation in 2014 to the high tributary inflow coupled with non-oxygenation in 2014 shows that the net export of both total Fe and Mn was similar even under these 2 different oxygenation conditions, suggesting that oxygenation has only a minor influence on the net export of metals from the reservoir (). In 2014, only 0.1% and 2% of the total Fe and Mn mass, respectively, entering the reservoir from hydrologic inputs retained during the monitoring period; in 2015, the retained total Fe and Mn mass was −0.02% and 5%, respectively.
Figure 7. Net export of total Fe and Mn (Lnet) in FCR during 4 field manipulations: high groundwater/runoff and oxygenated (“ON”) conditions (1–28 April 2014 and 1 April–10 May 2015), high tributary inflow discharge and oxygenated conditions (28 April–9 June, 29 June–30 July, and 19–26 August 2014), high tributary inflow discharge and non-oxygenated conditions (“OFF”) (9–29 June and 30 July–19 August 2014), and low tributary inflow discharge and oxygenated conditions (19 August–15 October 2014, 10 May–4 June 2015, and 8 June–5 October 2015). Positive net export indicates reservoir is a metal source to downstream; negative net export indicates reservoir is a metal sink.
Discussion
The Fe and Mn budget in FCR was affected by both oxygenation and hydrologic conditions during the 2-year study period. In the following discussion, we discuss the effects of hypolimnetic oxygenation and hydrologic inflows on the exchange of Fe and Mn between the sediments and water column and on the retention of metals in the reservoir, and the implications of manipulating reservoir conditions for water quality management.
Release from sediments control Fe and Mn hypolimnetic mass
Our results show that release of metals from the sediments into the water column had a substantial effect on the Fe and Mn mass in the hypolimnion. Later in the summer stratified period of both years, we observed large increases in the masses of both total and soluble Fe and Mn in the hypolimnion (). The hypolimnion total and soluble Fe and Mn masses reached their highest levels between July and August (), when FCR was stratified and anoxic conditions at depth in the water column () were well established, similar to results of other work in seasonally stratified lakes and reservoirs (Davison Citation1993; Gantzer et al. Citation2009; Bryant et al. Citation2011; Wildman and Forde Citation2016).
As expected, the release of total and soluble Fe and Mn from the sediments into the water column was sensitive to DO concentrations in the hypolimnion. The net release of Fe and Mn from the sediments to the water column was higher (positive Lexch) for most of the summer stratified period when the HOx system was intermittently deactivated in 2014, in comparison to extended periods of oxygenation in 2015 (). When the HOx system was deactivated for the two 4-week intervals in 2014, the mean net release rate of Fe and Mn into the hypolimnion was 1.4 and 4.5 times higher, respectively, than during the same times in 2015 under continuous HOx system operation. These results suggest that temporary, short periods of anoxic conditions above the sediment–water interface greatly increased the internal loading of metals into the water column.
The continued release of Fe and Mn after oxygenated conditions were reestablished in 2014 suggests that conditions in the sediments, where the reduced Fe and Mn largely originate, are decoupled from the well-oxygenated conditions in the water column (). Fe and Mn release was still evident in continuously oxygenated conditions in both years, although the release rates were lower in comparison to anoxic conditions above the sediment–water interface in 2014 (). Bryant et al. (Citation2011) found that although Mn concentrations in the water column decreased by up to 97% under oxygenated conditions in a nearby reservoir, that Mn concentrations in the sediment pore water continued to increase in the summer stratified period, despite HOx operation. Although we did not measure sediment pore water, our water column data support the findings of Bryant et al. (Citation2011).
The tributary loading of Fe and Mn into FCR had a negligible short-term effect on metal mass in the water column. Early in the stratified period in both years (between April and May), we observed relatively minor changes to the masses of Fe and Mn in the hypolimnion (). Between April and May in 2014, the tributary loading of total Fe and Mn increased by a factor of 6 or more, up to 4.4 kg/d and 0.32 kg/d, respectively (); however, the metal masses in the hypolimnion did not substantially increase until early June (). The lack of an increase in hypolimnion metal masses in response to increasing tributary loading suggests that while the tributary inflow imported a large amount of metal mass daily compared to the total amount in the hypolimnion, the metals entering the reservoir from the tributary likely accumulated in sediments.
Falling Creek Reservoir is largely a metal sink
Over the 2-year study period, our results show that overall, FCR behaved as a sink for total Fe and Mn. Our results are generally consistent with a nutrient retention study in the same reservoir, which found that under most conditions, FCR is also a sink for total forms of nutrients (nitrogen, phosphorus: TN, TP; Gerling et al., Citation2016). Older reservoirs such as FCR, which was constructed >100 years ago, are important sites for nutrient and metal retention in the landscape (Harrison et al. Citation2009; Powers et al. Citation2013), but they can also be sources of these important water quality parameters under certain biogeochemical and hydrologic conditions, such as in the early stratified period (April–May) in the 2-year monitoring period of our study.
In general, total Fe and Mn concentrations exhibited negligible changes in the inflows or outflows during thermal stratification in FCR, suggesting that although oxygenation influenced the net exchange of metals between the sediment and the water column, it had little effect on the amount of total Fe and Mn mass being retained in the reservoir (e.g., compare high tributary inflow-oxygenation “on” to high tributary inflow-oxygenation “off” in ). These results contrast with the findings from Gerling et al. (Citation2016), who observed in 2013 and 2014 that NH4+ that accumulates in the hypolimnion under hypoxic conditions in FCR can be entrained into the epilimnion and exported downstream via the reservoir outflows. Although we also observed an increase in metal accumulation in the hypolimnion during the summer stratified period, entrainment of hypolimnetic water with high metal concentrations into the epilimnion did not have a substantial effect on the net export of metals from the reservoir. This difference may be because NH4+ accumulation occurred throughout the water column of the hypolimnion, enhancing entrainment rates at the thermocline; in contrast, the Fe and Mn accumulation was primarily at the bottom of the hypolimnion, just above the sediments, so metal entrainment rates were lower.
We note multiple limitations to this work. Although we were able to manipulate the tributary inflow to FCR, we were not able to control the discharge rate and loading of other hydrologic inputs, such as groundwater and surface runoff. While it is unlikely that all hydrologic inputs could be fully controlled in a whole-reservoir experiment such as ours, further work measuring groundwater discharge and surface runoff during precipitation events and the associated metal fluxes from these two hydrologic inputs is needed to improve the metal mass budget calculations for this reservoir. In addition, we were unable to conduct a statistical comparison of the manipulation periods because of autocorrelation between sequential treatments and interannual variability. Regardless, the standardization of hypolimnetic metal masses as loading per day () allows us to segregate the effects of hydrologic versus redox-mediated loads of Fe and Mn to the water column. We did not have data from a reference ecosystem for comparison to the FCR manipulations, which limits the extrapolation of our findings to other reservoirs.
Implications for reservoir management
Our study supports previous work (e.g., Engstrom Citation2005; Gantzer et al. Citation2009) showing that oxygenation can be successfully used as a management strategy for controlling Fe and Mn in drinking water reservoirs, but the design and implementation of oxygenation may need to be modified to account for longer term buildup of particulate metals in the reservoir sediments. In our study reservoir, we found that oxygenation hinders release of metals from sediment during thermal stratification and allows for oxidation of metals in the water column. However, because the reservoir’s 2 primary withdrawals (water treatment plant and spillway) are from the epilimnion, there was no net loss of metals from the hypolimnion. If the withdrawals were from the hypolimnion, FCR’s ability to serve as a metal sink would likely be decreased. Because land use and climate are simultaneously increasing hypolimnetic anoxia in many lakes and reservoirs (Marcè et al. Citation2010; Jenny et al. Citation2016) and storm intensity and frequency are increasing in many regions (Prein et al. Citation2017), thereby increasing tributary inflows, evaluating the effects of these forcings on metal budgets is critical for protection of drinking-water supplies.
Supplemental Material
Download MS Word (759.6 KB)Acknowledgments
We thank the staff at the Western Virginia Water Authority for their long-term support. In particular, we thank Cheryl Brewer, Jamie Morris, Jeff Booth, Bob Benninger, and Gary Robertson. Jeffrey Parks, Mariah Redmond, Mariah Haberman, Madeline Ryan, Charlotte Harrell, Spencer Klepatzki, Athena Tilley, and Bobbie Niederlehner provided critical help in the field and laboratory.
Additional information
Funding
References
- Aguilar C, Nealson KH. 1998. Biogeochemical cycling of manganese in Oneida Lake, New York: whole lake studies of manganese. J Great Lakes Res. 24(1):93–104.
- American Public Health Association (APHA). 1992. Standard methods for the examination of water and wastewater, 18th ed. American Public Health Association/American Water Works Association/Water Environment Federation, Washington (DC).
- Balistrieri LS, Murray JW, Paul B. 1994. The geochemical cycling of trace elements in a biogenic meromictic lake. Geochim Cosmochim Acta. 58(19):3993–4008. doi:10.1016/0016-7037(94)90262-3.
- Beutel MW, Horne AJ. 1999. A review of the effects of hypolimnetic oxygenation on lake and reservoir water quality. Lake Reserv Manage. 15(4):285–297. doi:10.1080/07438149909354124.
- Beutel MW, Leonard TM, Dent SR, Moore BC. 2008. Effects of aerobic and anaerobic conditions on P, N, Fe, Mn, and Hg accumulation in waters overlaying profundal sediments of an oligo-mesotrophic lake. Water Res. 42(8–9):1953–1962. doi:10.1016/j.watres.2007.11.027.
- Brock TD, Lee DR, Janes D, Winek D. 1982. Groundwater seepage as a nutrient source to a drainage lake; Lake Mendota, Wisconsin. Water Res. 16(7):1255–1263. doi:10.1016/0043-1354(82)90144-0.
- Brown BV, Valett HM, Schreiber ME. 2007. Arsenic transport in groundwater, surface water, and the hyporheic zone of a mine‐influenced stream‐aquifer system. Water Resour Res. 43(11): 1–14.
- Bryant LD, Hsu-Kim H, Gantzer PA, Little JC. 2011. Solving the problem at the source: controlling Mn release at the sediment-water interface via hypolimnetic oxygenation. Water Res. 45(19):6381–6392. doi:10.1016/j.watres.2011.09.030.
- Cook PL, Aldridge K, Lamontagne S, Brookes J. 2010. Retention of nitrogen, phosphorus and silicon in a large semi-arid riverine lake system. Biogeochem. 99(1–3):49–63. doi:10.1007/s10533-009-9389-6.
- Davison W. 1981. Supply of iron and manganese to an anoxic lake basin. Nature. 290(5803):241–243. doi:10.1038/290241a0.
- Davison W. 1993. Iron and manganese in lakes. Earth Sci Rev. 34(2):119–163. doi:10.1016/0012-8252(93)90029-7.
- Davison W, Woof C. 1984. A study of the cycling of manganese and other elements in a seasonally anoxic lake, Rostherne Mere, UK. Water Res. 18(6):727–734. doi:10.1016/0043-1354(84)90168-4.
- Engstrom DR. 2005. Long-term changes in iron and phosphorus sedimentation in Vadnais Lake, Minnesota, resulting from ferric chloride addition and hypolimnetic aeration. Lake Reserv Manage. 21(1):95–105. doi:10.1080/07438140509354417.
- Fetter CW. 2001. Applied hydrogeology. Upper Saddle River, NJ: Prentice Hall.
- Gantzer PA, Bryant LD, Little JC. 2009. Controlling soluble iron and manganese in a water-supply reservoir using hypolimnetic oxygenation. Water Res. 43(5):1285–1294. doi:10.1016/j.watres.2008.12.019.
- Gerling AB, Browne RG, Gantzer PA, Mobley MH, Little JC, Carey CC. 2014. First report of the successful operation of a side stream supersaturation hypolimnetic oxygenation system in a eutrophic, shallow reservoir. Water Res. 67129–143. doi:10.1016/j.watres.2014.09.002.
- Gerling AB, Munger ZW, Doubek JP, Hamre KD, Gantzer PA, Little JC, Carey CC. 2016. Whole-catchment manipulations of internal and external loading reveal the sensitivity of a century-old reservoir to hypoxia. Ecosystems. 19(3):555–571. doi:10.1007/s10021-015-9951-0.
- Giles CD, Isles PD, Manley T, Xu Y, Druschel GK, Schroth AW. 2016. The mobility of phosphorus, iron, and manganese through the sediment-water continuum of a shallow eutrophic freshwater lake under stratified and mixed water-column conditions. Biogeochem. 127(1):15–34. doi:10.1007/s10533-015-0144-x.
- Graham MC, Gavin KG, Farmer JG, Kirika A, Britton A. 2002. Processes controlling the retention and release of manganese in the organic-rich catchment of Loch Bradan, SW Scotland. Appl Geochem. 17(8):1061–1067. doi:10.1016/S0883-2927(02)00012-4.
- Harrison JA, Maranger RJ, Alexander RB, Giblin AE, Jacinthe P-A, Mayorga E, Seitzinger SP, Sobota DJ, Wollheim WM. 2009. The regional and global significance of nitrogen removal in lakes and reservoirs. Biogeochem. 93(1–2):143–157. doi:10.1007/s10533-008-9272-x.
- Harvey JW, Fuller CC. 1998. Effect of enhanced manganese oxidation in the hyporheic zone on basin-scale geochemical mass balance. Water Resour Res. 34(4):623–636. doi:10.1029/97WR03606.
- Holmes RR, Jr., Terrio PJ, Harris MA, Mills P. 2001. Introduction to field methods for hydrologic and environmental studies. Urbana (IL): U.S. Geological Survey Open-File Report 01-50.
- Hongve D. 1997. Cycling of iron, manganese, and phosphate in a meromictic lake. Limnol Oceanogr. 42(4):635–647. doi:10.4319/lo.1997.42.4.0635.
- Jenny JP, Francus P, Normandeau A, Lapointe F, Perga ME, Ojala A, Schimmelmann A, Zolitschka B. 2016. Global spread of hypoxia in freshwater ecosystems during the last three centuries is caused by rising local human pressure. Glob Chang Biol. 22(4):1481–1489.
- Lewandowski J, Meinikmann K, Nützmann G, Rosenberry DO. 2015. Groundwater–the disregarded component in lake water and nutrient budgets. Part 2: effects of groundwater on nutrients. Hydrol Process. 29(13):2922–2955. doi:10.1002/hyp.10384.
- Marcè R, Rodriguez-Aria MA, García JC, Armengol J. 2010. El Niño Southern Oscillation and climate trends impact reservoir water quality. Global Change Biol. 16(10):2857–2865. doi:10.1111/j.1365-2486.2010.02163.x.
- Menne M, Durre I, Korzeniewski B, McNeal S, Thomas K, Yin X, Anthony S, Ray R, Vose RS, Gleason BE. 2016. Global Historical Climatology Network-Daily (GHCN-Daily. version. 322), NOAA National Climatic Data Center.
- Munger ZW. 2016. The sources and cycles of iron and manganese in surface water supplies. [dissertation]. Blacksburg, VA: Virginia Tech.
- Munger ZW, Carey CC, Gerling AB, Hamre KD, Doubek JP, Klepatzki SD, McClure RP, Schreiber ME. 2016. Effectiveness of hypolimnetic oxygenation for preventing accumulation of Fe and Mn in a drinking water reservoir. Water Res. 1061–14. doi:10.1016/j.watres.2016.09.038.
- Olivie-Lauquet G, Gruau G, Dia A, Riou C, Jaffrezic A, Henin O. 2001. Release of trace elements in wetlands: role of seasonal variability. Water Res. 35(4):943–952.
- Powers S, Julian J, Doyle M, Stanley E. 2013. Retention and transport of nutrients in a mature agricultural impoundment. J Geophys Res Biogeosci. 118(1):91–103. doi:10.1029/2012JG002148.
- Prein AF, Rasmussen RM, Ikeda K, Liu C, Clark MP, Holland GJ. 2017. The future intensification of hourly precipitation extremes. Nature Clim Change. 7(1):48–52. doi:10.1038/nclimate3168.
- Read JS, Hamilton DP, Jones ID, Muraoka K, Winslow LA, Kroiss R, Wu CH, Gaiser E. 2011. Derivation of lake mixing and stratification indices from high-resolution lake buoy data. Environ Model Soft. 26(11):1325–1336. doi:10.1016/j.envsoft.2011.05.006.
- Rosenberry DO, Lewandowski J, Meinikmann K, Nützmann G. 2015. Groundwater‐the disregarded component in lake water and nutrient budgets. Part 1: effects of groundwater on hydrology. Hydrol Process. 29(13):2895–2921. doi:10.1002/hyp.10403.
- Rosenberry DO, Winter TC, Buso DC, Likens GE. 2007. Comparison of 15 evaporation methods applied to a small mountain lake in the northeastern USA. J Hydrol. 340(3-4):149–166.
- US Environmental Protection Agency (USEPA). 2017. Table of regulated drinking water contaminants. [accessed 8 Feb 2018]. https://www.epa.gov/ground-water-and-drinking-water/table-regulated-drinking-water-contaminants.
- Wielicki BA, Barkstrom BR, Harrison EF, Lee RB, III, Louis Smith G, Cooper JE. 1996. Clouds and the Earth's Radiant Energy System (CERES): an earth observing system experiment. Bull Amer Meteor Soc. 77(5):853–868. doi:10.1175/1520-0477(1996)077<0853:CATERE>2.0.CO;2.
- Wildman RA, Forde NA. 2016. Effect of a moderate-size reservoir on transport of trace elements in a watershed. Lake Reserv Manage. 32(4):353–365. doi:10.1080/10402381.2016.1204397.
- World Health Organization (WHO). 2008. Guidelines for drinking-water quality. Geneva, Switzerland: World Health Organization.
- Zaw M, Chiswell B. 1999. Iron and manganese dynamics in lake water. Water Res. 33(8):1900–1910. doi:10.1016/S0043-1354(98)00360-1.
