
Abstract
Pilon S, Zastepa A, Taranu ZE, Gregory-Eaves I, Racine M, Blais JM, Poulain AJ, Pick FR. 2018. Contrasting histories of microcystin-producing cyanobacteria in two temperate lakes as inferred from quantitative sediment DNA analyses. Lake Reserv Manage. 35:102–117.
The incidence and abundance of microcystin-producing cyanobacteria were compared between 2 temperate lakes over the past ∼150–175 yr by combining analyses of sediment DNA (qPCR of 4 target genes and high-throughput sequencing of a cyanobacterial 16S rRNA gene fragment) and sediment microcystin concentrations. In Lake of the Woods (LoW), toxic cyanobacteria were only detected beginning in the early 1980s based on gene copy numbers of the microcystin-synthesizing gene (mcyD), and by the early 2000s based on sediment microcystins; both these proxies for toxic cyanobacteria were significantly correlated. In contrast, in Baptiste Lake (Alberta), both mcyD gene copy numbers and microcystins were detected as far back as ∼1830, before European settlement of the region. Total sediment microcystins in this lake were not correlated with mcyD gene copy numbers, but the latter correlated with 2 other cyanobacterial genes targeted. These results point to a relatively recent emergence and increasing dominance of microcystin-producing cyanobacteria in LoW that coincides with the documented rise in regional temperatures rather than changes in nutrient loading. In contrast, toxic blooms are not a new phenomenon in Baptiste Lake, as microcystin-producing cyanobacteria were clearly part of the ecosystem prior to anthropogenic perturbations; this lake has also experienced a recent increase in microcystins coincident with further nutrient enrichment. High-throughput sequencing of the cyanobacterial 16S rRNA gene indicated that bloom-forming and potentially toxigenic Dolichospermum (including related Nostocales) and Microcystis were present but the former has been the dominant genus over the past 175 yr.
Cyanobacterial blooms are known to occur in lakes with high nutrient levels and warm water temperatures, where they appear to be increasing in intensity and frequency, according to monitoring reports (Paerl and Huisman Citation2008; Winter et al. Citation2011; Pick Citation2016). Many cyanobacterial blooms are dominated by strains that produce toxins linked to acute and chronic toxicity (Chorus and Bartram Citation1999; Funari and Testai Citation2008). The hepatotoxic microcystin is one of the most ubiquitous cyanotoxins found in freshwater systems. Exposure to microcystins has led to mortality in biota such as fish and sea otters (Malbrouck and Kestemont Citation2006; Miller et al. Citation2010), as well as humans (Yuan et al. Citation2006). The environmental conditions and potential cues that cause a bloom to be toxic remain unclear.
There are few sufficiently long-term monitoring programs of phytoplankton, and therefore it is difficult to determine whether blooms are indeed increasing and/or becoming more toxic. In contrast, sediment cores can be used to track algal communities and reconstruct environmental history using various proxies over much longer periods (Smol Citation2008). The subfossil remains of some species are well suited to identification using light microscopy, such as with the silica frustules of diatoms and scales of chrysophytes (Smol Citation2008). Some cyanobacterial taxa develop resting stages (akinetes) and can therefore be detected in a similar way (van Geel et al. Citation1994; Räsänen et al. Citation2006; Legrand et al. Citation2017). Cyanobacteria also produce characteristic pigments that can be extracted from sediments: Carotenoid pigments (echinenone and zeaxanthin) representative of cyanobacteria have been used to pinpoint the onset of eutrophication in temperate lakes (e.g., Leavitt and Hodgson Citation2002). Based on pigment analyses, the sediment record over the last 200 yr, particularly of temperate lakes, points to a global increase in cyanobacteria mainly post ∼1945 CE (Taranu et al. Citation2015), but the history and dynamics of toxic blooms have not been well resolved to date, partly for lack of suitable proxies.
Over the last decade, molecular tools have been developed to serve as markers of particular species or groups in sediment cores both qualitatively (conventional polymerase chain reaction [PCR]) and quantitatively (qPCR) (e.g., Kamenova et al. Citation2017). A number of studies have reconstructed historical patterns of certain bacteria by using gene fragments specific to the taxa of interest (Coolen Citation2004; Li et al. Citation2006; Jiang et al. Citation2007; Brazeau et al. Citation2013; Stoeva et al. Citation2014). Fewer studies report the use of molecular proxies for cyanobacteria in dated sediment cores, but these studies show great promise (Savichtcheva et al. Citation2011; Ye et al. Citation2011; Domaizon et al. Citation2013; Martínez de la Escalera et al. Citation2014; Kyle et al. Citation2015; Pal et al. Citation2015). Furthermore, advances in next generation sequencing of genes amplified from environmental DNA have made it possible to reconstruct community diversity (e.g., Coulon et al. Citation2012; Shokralla et al. Citation2012; Lejzerowicz et al. Citation2013), including most recently for cyanobacteria over the past ∼200 yr in lake sediments (Monchamp et al. Citation2016; Legrand et al. Citation2017).
In order to detect and quantify potentially toxic cyanobacteria in surface waters, estimating toxin gene abundance can provide a rapid and more sensitive approach than measuring toxin concentrations (e.g., Koskenniemi et al. Citation2007; Fortin et al. Citation2010). In the case of microcystins, the gene cluster responsible for their synthesis has been well characterized (Tillett et al. Citation2000). The microcystin gene cluster is considered largely constitutive, and expression is a function of the growth rate in cyanobacteria that contain the gene cluster (e.g., Kaebernick et al. Citation2000). Part of the cluster (mcyD) is involved in producing the Adda moiety of microcystin, which is required for the toxicity of this small peptide (Jaiswal et al. Citation2008); mcyD is considered a highly conserved region of the gene cluster and is present in all strains of cyanobacteria that are known producers of microcystin (Neilan et al. Citation1999).
In the present study, the mcyD gene was used to track changes in toxic cyanobacteria in sediment cores taken from 2 temperate lakes of different trophic states; gene copy numbers were compared to microcystin concentrations analyzed from the same cores (Zastepa et al. Citation2017b; Zastepa et al. Citation2017a) to test for congruence between these 2 potential proxies of toxic cyanobacteria. Our first objective was to determine whether the mcyD gene fragment could be successfully quantified using DNA extracted from sediment cores; its suitability as a proxy for microcystin-producing cyanobacteria was then determined through its relationship to microcystin concentrations through sediment layers. The second objective was to determine whether cyanobacterial assemblages have changed through time in terms of relative toxicity. Our approach was to estimate the abundance of mcyD genes in relation to that of total cyanobacteria (using the cyanobacterial 16S rRNA gene; Pal et al. Citation2015) and total bacterial abundance (using a housekeeping bacterial gene encoding for glutamate synthetase; Stoeva et al. Citation2014). Finally, we quantified changes over time in a genus potentially responsible for toxin production through quantification of the 16S rRNA gene indicative of the common microcystin-producing genus Microcystis and by high-throughput sequencing analyses of the cyanobacterial 16S rRNA gene. Microcystis has been recorded in the contemporary plankton of both lakes along with other potential producers such as Dolichospermum (Zurawell et al. Citation1999; Chen et al. Citation2007).
Study sites
Two temperate lakes in North America (Fig. S1) were chosen based on contemporary reports of microcystin-producing blooms in both. Lake of the Woods (LoW) is a transboundary system that overlaps the provinces of Ontario and Manitoba, Canada, along with the state of Minnesota, USA; it covers a total surface area of 3850 km2 within a large drainage basin of ∼70,000 km2 (Rühland et al. Citation2010). The total phosphorus (TP) concentrations vary across the multiple bays of the lake and lie within the mesotrophic to eutrophic range from the northern to the southern portions (7–46 µg/L; DeSellas et al. Citation2009). Most sites across the lake have not shown a large change in phosphorus based on diatom-inferred TP over the past ∼150 yr (Hyatt et al. Citation2011). Microcystins were first reported in surface waters of Lake of the Woods in 2004 (Chen et al. Citation2007), although qualitative reports of cyanobacterial blooms exist from earlier decades.
In comparison, Baptiste Lake in Alberta is much smaller (surface area ∼10 km2) and is thought to be naturally eutrophic (Adams et al. Citation2014) with a watershed that covers an area of 310 km2 (Mitchell and Prepas Citation1990). TP concentrations have been within the eutrophic range (43–85 µg/L) over the contemporary record (Adams et al. Citation2014) and the lake has a longer history than LoW of surface water monitoring for microcystins (Zastepa et al. Citation2017a), which are common in lakes of central Alberta (Kotak and Zurawell Citation2007).
Materials and methods
Sediment core sampling
In 2010, 2 sediment cores were collected: 1 from LoW at a southern site near Hay Island (49°9'25.6''N, 94°7'23.2''W) at a depth of 13 m and 1 from the south basin of Baptiste Lake, Alberta, at the maximum depth (26.5 m) (54°44'19.7''N, 113°33'7.4''W). To retrieve cores, a Glew modified gravity corer was used (Glew Citation1991). The 2 cores were 38.5 and 46 cm in length from LoW and Baptiste, respectively. At the shore, cores were extruded out of the tubes and packaged in sterile Whirl-Pak bags (Fisher Scientific, Canada) in 0.5-cm intervals. The extruding tray and spatulas used to section the core were cleaned with a dry Kimwipe after each section to minimize cross contamination. The samples were kept in a cooler on ice and promptly transferred to a −20 C chest freezer upon return to the laboratory.
210Pb dating
Approximately 15 samples per core were used for dating. These samples were freeze-dried and placed in a gamma spectrometer (DSPec Spectrometer linked to Maestro II Software, Ortec, Oak Ridge, TN) to measure 210Pb activity and 226Ra activity. Unsupported 210Pb was calculated by subtracting the supported 210Pb (as 226Ra activity) from the total 210Pb. As an independent marker, 137Cs was used due to its peak in 1963 prior to the ban of nuclear testing (Pennington et al. Citation1973). For both cores, 3 models of chronology were constructed (Constant Rate of Supply, Constant Initial Concentration, and Constant Flux Constant Sedimentation; Benoit and Rozan Citation2001) and fitted for 137Cs data and 210Pb data. Based on the fits, the Constant Rate of Supply model was chosen for both cores. Further details on dating of sediments are outlined in Pal et al. (Citation2015) and Zastepa et al. (Citation2017a).
Chemical analyses of microcystins
Sediment microcystins were measured in both cores using liquid chromatography–tandem mass spectrometry (LC-MS/MS) following accelerated solvent extraction (ASE) as described in Zastepa et al. (Citation2015). Briefly, water extracts were prepared using ASE 200 (Dionex, Oakville, ON, Canada) for concentration on hydrophilic–lipophilic balance solid-phase extraction cartridges (Phenomenex, Torrance, CA) and eluted with methanol. Reverse-phase chromatography was performed on a Zorbax SB-C18HT column (50 mm × 2.1 mm ID, particle size 1.8 mm) using a 1200 series high-performance liquid chromatograph (Agilent Technologies, Mississauga, ON, Canada) followed by quantitation using a 3200 QTRAP MS system (AB SCIEX, Concord, ON, Canada) against certified calibration standards. Total microcystin concentrations reported here are based on the sum of the dominant congeners microcystin-LR, -7dmLR, -RR, -YR, -WR, -LA, -LF, -LY, and -LW with individual method detection limits ranging between 1.1 and 2.5 ng/g sediment dry weight (d.w.). Congener-specific sediment microcystin results for Baptiste and LoW were reported in Zastepa et al. (Citation2017a) and Zastepa et al. (Citation2017b), respectively.
DNA extraction
DNA was extracted from sediment intervals using the Powersoil DNA extraction kit as previously described using 0.25–0.35 g of fresh sediment (Pal et al. Citation2015). All DNA was quantified using the Quant-iT DNA assay kit (Invitrogen), following the kit protocol. DNA was extracted from pure cultures of the microcystin-producing Microcystis aeruginosa strain CPCC 300 (Canadian Phycological Culture Centre) using a phenol-chloroform extraction (Hisbergues et al. Citation2003; Fortin et al., Citation2010) in order to create standard curves for qPCR of the cyanobacterial genes and for use as positive controls (during PCR and gel electrophoresis steps). Strain CPCC 300 is a known microcystin producer (Leblanc Renaud et al. Citation2011). qPCR standards for glnA were created using PCR amplicon products derived from pure cultures of Escherichia coli (Poulain et al. Citation2015).
Quantitative PCR amplification
The sequences, amplicon length, and annealing temperature of all primers used in this study are presented in , along with the number of copies of the gene per cell as reported in the literature. The primers used to quantify the mcy gene cluster targeted the mcyD gene and were originally designed by Fortin et al. (Citation2010) based on all mcyD sequences (50 in total) available in GenBank in March 2006, using the β-ketoacyl synthase region of the gene (product of 107 bp; mcyD). This primer set effectively amplified mcyD in several strains of microcystin producing Microcystis (e.g., CPCC300, CPCC299, CPCC464, PCC7806) and 1 strain of a Nostocales species Trichormus variabilis (previously Anabaena variabilis) (tested by N. Fortin, National Research Council of Canada, Montreal). Some strains of T. variabilis are reported to produce microcystins (Mohamed et al. Citation2006), whereas others do not (e.g., Anabaena variabilis, ATCC29413). Total cyanobacterial abundance was also quantified using a region of the 16S rRNA gene specific to cyanobacteria (Nübel et al. Citation1997; Rinta-Kanto et al. Citation2005) as in Pal et al. (Citation2015). Because the 16S rRNA is present in multiple copies (), dependent on the bacterial taxa (Schirrmeister et al. Citation2012; Sun et al. Citation2013), the single-copy gene encoding for glutamine synthetase, glnA (Hurt et al. Citation2001), present in all bacteria, was used as a housekeeping gene. This was to ensure that changes seen in the other genes were not simply reflective of the amount of DNA extracted or changes in gene copy numbers per cell (Stoeva et al. Citation2014; Poulain et al. Citation2015). To determine whether changes in mcyD gene copies were related to changes in potential toxigenic cyanobacterial taxa, the 16S rRNA gene fragment specific to the genus Microcystis was also amplified and quantified. Microcystis is considered one of the most pervasive toxigenic cyanobacteria in freshwater (Harke et al. Citation2016) and is present in the contemporary plankton of both lakes (LoW, Chen et al. Citation2007; Baptiste, Zurawell et al. Citation1999). After basic PCR amplification and gel electrophoresis of culture and sediment samples, we used Sanger sequencing to validate that both pure cultures and sediment DNA extracts were yielding amplicons that were targeting the gene fragments of interest. A Microcystis aeruginosa strain, which does not produce microcystins (CPCC 632), was used as a negative control for the mcyD primers, and similarly, a green algal culture (Pseudokirchneriella subcapitata) was used to verify the cyanobacterial 16S rRNA primers.
Table 1. Primer sequences (for qPCR and high-throughput sequencing), amplicon size, and annealing temperatures.
Each target gene of interest was cloned into a vector and used as a standard for subsequent quantitative PCR (qPCR) using the Strataclone kit (Agilent Technologies) according to the manufacturer’s instructions. All qPCR amplifications were performed using the Bio-Rad CFX96 real-time PCR detection module, and all results were analyzed using Bio-Rad CFX Manager Version 3.0. Each PCR mixture contained 1 μL of template, 7.5 μL of SsoFast EvaGreen Supermix (Bio-Rad), and 0.1 μM of each primer (forward and reverse), brought up to a final volume of 15 μL. All samples were loaded in 0.2-mL 8-strip tubes (Bio-Rad) in triplicate. The qPCR conditions were as follows: preheating at 95 C for 3 min followed by 35 amplification cycles of 10 s at 95 C and 10 s at 55 C. This was followed by a melt curve from 60 C to 95 C at 0.5 C increments with 5-s holds. The annealing temperature for each primer set () was first optimized using a thermal gradient surrounding the primer melting temperatures. To limit inhibition of PCR by components that could be co-extracted with DNA, a 10-fold series dilution of a pooled DNA extract (from sediment samples across each core) was initially performed and the dilution for which the PCR band was the strongest was applied to that sample. The efficiency (E) scores and r2 values from these dilution tests and the plasmid DNA dilutions used to create standard curves were consistently between the recommended guidelines of 90 and 110% (E) for the slope, and >0.98 (r2) for the regression line (Taylor et al. Citation2010). The mean efficiencies based on the serial dilutions of plasmid DNA used to generate each standard curve are presented in . The limit of detection of the starting quantity (SQ) of DNA, which was used to calculate the number of gene copies, was determined by using the linear equation derived from the standard curve (Cq = slope(log(SQ) + y-intercept), where the limit of detection (Cq) is assumed as 35 cycles (Bustin et al. Citation2009). Detection limits varied slightly between genes and qPCR runs and ranged from <50 to 300 copies per gram sediment fresh weight.
High-throughput sequencing
For this part of the study only Baptiste Lake was analyzed because previous paleolimnological studies have shown that it was eutrophic prior to European settlement of the region (i.e., over the past ∼200 yr; Hickman et al. Citation1990; Adams et al. Citation2014). Given our present understanding of cyanobacterial ecology (Downing et al. Citation2001), this would suggest a long history of cyanobacterial dominance. Initially, samples from 6 core sections at midpoint depths of 0.25 (top), 11.25, 21.25, 31.25, 41.25, and 45.75 cm (the bottom) were used for DNA extraction and subsequent sequencing of a cyanobacterial 16S rRNA gene fragment. Samples were sequenced by Molecular Research DNA (Austin, TX) as originally described by Dowd et al. (Citation2001) using 16S rRNA cyanobacterial primers targeting the variable V3 and V4 regions of the gene (; Nübel et al. Citation1997; Jungblut et al. Citation2005). After a first round of sequencing and preliminary analysis of the results, a higher resolution of the first 10 cm was deemed appropriate and therefore the midpoint depths of 2.25, 5.75, and 7.75 cm were added to the sequencing analysis. DNA samples from the 0.25- and 11.25-cm core sections were also resequenced on the second run. Although there was a slight difference in total number of sequences obtained between the first run and second run, there was no difference with respect to cyanobacterial orders represented by the sequences once grouped into operational taxonomic units (OTUs).
Initial data trimming of the sequence data was performed using the program MOTHUR (v. 1.33.3; Schloss et al. Citation2009). The quality file was used to eliminate sequences with an average Phred quality score below 25. Low-quality sequences (length less than 100 and over 1000 bp) were removed, as well as sequences with ambiguous bases. Remaining sequences were then aligned using Silva reference files, and chimeras were subsequently removed using Chimera Slayer (Haas et al. Citation2011). Sequences representative of cyanobacteria were identified using the online Ribosomal Database Project (RDP) classifier, which is specifically designed for classifying bacterial 16S rRNA sequences (Wang et al. Citation2007; Cole et al. Citation2014). Sequences not identified as cyanobacterial by the RDP classifier were removed from further analyses. Previous studies have found non-cyanobacterial species amplified using cyanobacterial-specific primers and have similarly filtered them out of downstream analyses (Kleinteich et al. Citation2014).
Cyanobacterial sequences were imported into the Quantitative Insights into Microbial Ecology (QIIME) program (v. 1.8.0; Caporaso et al. Citation2010). The sequences were again passed through initial screening processes, thus removing any sequences with a homopolymer of 6 bases or more (other QIIME trimming conditions having already been met using MOTHUR). Sequences were then grouped according to operational taxonomic unit (OTU) and a representative sequence was chosen for each OTU at 97% similarity. Rarefaction curves were constructed using the number of OTUs observed based on sampling depth (i.e., number of sequences sampled).
Data analysis
All statistical analyses were conducted using R open source software (R Core Team Citation2013). Due to the lack of normality in the environmental data even after log-transformations (as indicated by Shapiro–Wilk tests), the nonparametric Kendall correlation was applied to examine the relationship between gene copy numbers and total microcystins in both lakes. Less conservative Pearson’s correlations are also presented as supplementary material in and . To correct for any effect of temporal autocorrelation on significance values, we first tested for temporal autocorrelation in each variable using the acf() function in R ({base} package). When both variables in a given bivariate correlation had significant temporal autocorrelation, we corrected the p value of the correlation test using a temporally restricted permutation test from the {permute} packages in R (Simpson Citation2016). If either variable in a bivariate correlation was not temporally autocorrelated, the p value of the Kendall correlation test was not corrected (Legendre and Legendre Citation2012). Gene copy numbers that were below the method detection limit were replaced by half the detection limit.
Table 2. Kendall’s nonparametric correlations (τ) of molecular data (DNA concentrations and gene copy number per gram of wet sediment) and sediment microcystin content in the Lake of the Woods core.
To test the temporal trends of sediment proxies in each lake, we used a local polynomial regression fitting procedure (LOESS), with a span of alpha = 0.75. Since alpha is the fraction of the total data used in each local regression, this relatively high alpha value (which is the default in R) was used to reduce the wiggle in the curve and avoided overfitting of random error. Furthermore, for each subset of the data, LOESS uses a weighted least squares procedure for the local fit, where more weight is given to points near the observation being estimated, and less weight to more distant points.
Results
Cyanobacterial genes through time and their relationship to microcystin sediment concentrations
Based on the chronology established from 210Pb dating, the Lake of the Woods core dated from ∼1858 to 2010 and the Baptiste Lake core covered the period from ∼1824 to 2010. DNA was successfully extracted from all sections sampled from each core. The Lake of the Woods core had a mean (±SE) DNA concentration of 805 (±122) ng/g fresh weight (f.w.) of sediment. The mcyD gene was at the detection limit (DL) in the Lake of the Woods core below a depth of 13 cm, corresponding to the early 1980s (DL ∼300 gene copy number/g f.w.), but then gene copy numbers increased in the subsequent decades over 3 orders of magnitude (∼1,000–100,000 copies/g f.w.) (). Total microcystins reported previously by Zastepa et al. (Citation2017b) and replotted here follow a similar rise but these were first detected (>1.1 ng/g d.w.) much later in the sediment record above 6 cm corresponding to early 2000s. In contrast, both the cyanobacterial 16SrRNA and glnA were detected throughout the LoW core and were present at 1 or 2 orders of magnitude higher gene copy numbers (maximum for glnA of 2.4 × 10⁶/g f.w.) () within all sediment sections analyzed and consistently well above detection limits for both these genes. Collectively, there was an overall increase in toxigenic cyanobacteria in LoW since about the late 1970s, as evidenced by the appearance and rise in both mcyD and Microcystis specific 16S rRNA (), especially when compared to temporal trends of both cyanobacterial 16S rRNA and glnA relative to the core mean values ().
Figure 1. Lake of the Woods sediment core depth profiles with dating on the right axis of concentrations, on a logarithmic scale. (A) Total microcystin concentrations (ng/g dry weight, from Zastepa et al. Citation2017a) and microcystin gene (mcyD) copy numbers per gram fresh weight (f.w.) with detection limits (DL) reached approximately midway down. The dashed vertical lines indicate mean values for both through the core. Solid lines in each case represent LOESS trends. (B) Total DNA (ng/g f.w.), cyanobacterial 16S rRNA gene copy numbers/g f.w., bacterial housekeeping gln A gene copy numbers/g f.w., with dashed lines indicating mean values for each. Solid lines in each case represent LOESS trends.
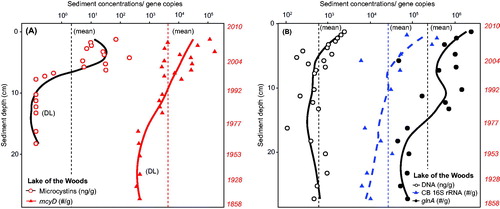
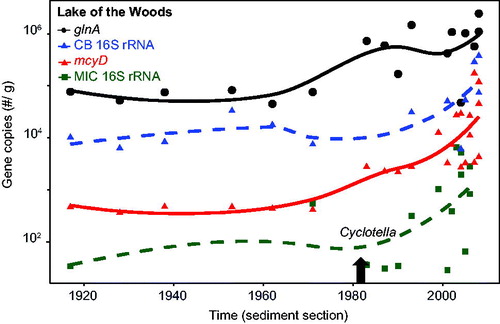
Figure 2. Lake of the Woods through the sediment time series. Gene copy numbers per gram fresh weight as presented in plotted on a logarithmic scale, including Microcystis specific 16S rRNA gene copy numbers. Solid lines in each case represent LOESS trends for each gene. Gray arrow shown post 1980 CE corresponds to the rise in the diatom Cyclotella relative to Aulacoseira, indicative of climate warming (from Rühland et al. Citation2010).
The mean (±SE) concentration of DNA through the Baptiste core was 762 (±97.4) ng/g f.w. In contrast to LoW, mcyD was detected at all depths to the bottom of the core (∼1830s) and at relatively high gene copy numbers (core mean ∼10,000 copies/g f.w., i.e., 2 orders of magnitude above detection) with the exception of 2 layers midway through the record (). Gene copy numbers fluctuated through much of the sediment record, then rose above the core average in the mid 1990s. Total microcystins as replotted from Zastepa et al. (Citation2017a) were also well above the limit of their detection throughout the entire core () but increased substantially almost 2 orders of magnitude after ∼2000. As in LoW, cyanobacterial 16S rRNA and glnA were present in relatively high numbers throughout the core (). The cyanobacterial 16S rRNA gene copy numbers in the Baptiste core appeared to increase during the late 1950s after decades of no apparent change. The cyanobacterial 16S rRNA gene was not quantified below 30 cm in this core because extracted DNA was expended in the other analyses.
Figure 3. Baptiste Lake South (Alberta) sediment core depth profiles of total microcystins concentrations (ng/g d.w., from Zastepa et al. Citation2017b) and microcystin gene (mcyD) copy numbers/g f.w. on a logarithmic scale with corresponding dating on the right axis. Dashed vertical lines indicate mean values for both through the core. See for detection limits. Solid lines in each case represent LOESS trends.
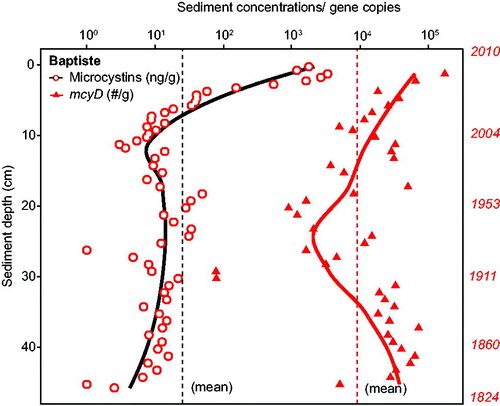
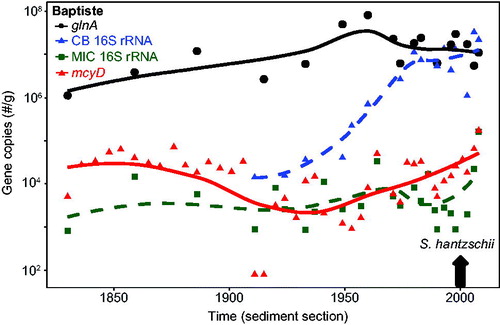
Figure 4. Baptiste Lake South (Alberta) across the sediment core time series. mcyD gene copy numbers as presented in are plotted on a logarithmic scale, along with the bacterial housekeeping gln A, cyanobacterial 16S rRNA, and Microcystis specific 16S rRNA gene copy numbers/g f.w. Solid lines in each case represent LOESS trends. Gray arrow shown in early post 2000 CE corresponds to the rise in the diatom Stephanodiscus hantzschii, indicative of cultural eutrophication (from Adams et al., Citation2014).
Although some primer sets were unable to detect gene copies at particular sediment intervals, the bacterial housekeeping glnA primers yielded a positive signal from all sections analyzed through both cores (; ). This result validated the down-core patterns seen with the other primer sets, meaning that the depths where certain cyanobacterial genes were not detected were not likely a consequence of poor DNA yield or quality.
In LoW, microcystin concentrations were significantly correlated with the mcyD gene copies from the same sediment core, and with the 16S rRNA gene copy numbers representative of the genus Microcystis and of the total cyanobacteria (p ≤ 0.05; ). The mcyD gene copy numbers themselves were also significantly correlated with the Microcystis 16S rRNA, the cyanobacterial 16S rRNA, and glnA gene copy numbers (p ≤ 0.05; ). Pearson’s correlations () produced similar results in identifying significant relationships between microcystins and both mcyD and Microcystis specific 16S rRNA genes.
In contrast, through the Baptiste Lake core, the microcystin concentrations were not significantly correlated with the gene copies of mcyD (p > 0.05; ) or any of the other genes quantified. Nevertheless, the 3 cyanobacterial genes quantified were significantly correlated with one another (, ).
Table 3. Kendall’s nonparametric correlations (τ) of molecular data (DNA concentrations and gene copy number per gram of wet sediment) and microcystin content in the Baptiste Lake core.
High-throughput sequencing of cyanobacterial genes through the Baptiste Lake core
Given the presence of the mcyD gene and measurable quantities of microcystin concentrations throughout the entire Baptiste Lake core, cyanobacterial 16S rRNA gene fragments were sequenced to determine whether there were any changes in community structure through time. From 9 samples of the Baptiste Lake core, between 5219 and 25,457 sequences were obtained per sample (). Between 1137 and 11,168 sequences per sample were retained after initial data were trimmed (based on conditions described previously in the methods) and restricted to those classified as cyanobacterial using the RDP classifier (Cole et al. Citation2014). We did not observe a strong effect of depth (time) on the cyanobacteria community structure at this taxonomic level of analysis. The rarefaction curves did not plateau (Fig. S2), suggesting that the high-throughput sequencing effort did not fully capture the community diversity, but in general species richness (based on OTUs) tended to be highest at the bottom of the core. With the exception of the very top section, the samples representative of more recent decades tended to exhibit less taxa richness. Nostocales was the dominant cyanobacterial order (>75% of total cyanobacteria) throughout the selected sediment layers, whereas the order Chroococcales accounted for less than 24% of the total cyanobacteria (). On further analysis, the genus Dolichospermum, which would include closely related taxa such as Aphanizomenon and Trichormus (Rajaniemi et al. Citation2005), consistently accounted for more than 85% of Nostocales (); Microcystis was the principal genus within the Chroococcales for most of the sediment layers ().
Figure 5. Taxa in Baptiste Lake South at selected intervals of the sediment core as determined from high-throughput sequencing of the 16S rRNA gene using primers specific to cyanobacteria (). Proportions of the main taxa are presented at the level of order (A) and separated further into genera within the Nostocales (B) and Chroococcales (C) orders. Genera containing potentially toxigenic species dominate in both cases.
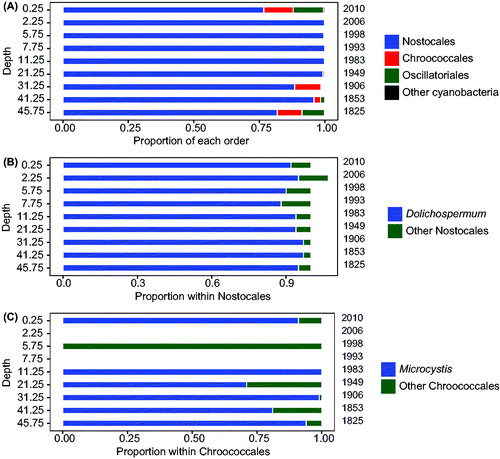
Table 4. Operational taxonomic units (OTUs based on 97% sequence similarity) and Shannon diversity index through the Baptiste Lake core.
Discussion
Gene copies as proxies of microcystins and microcystin-producing cyanobacteria
The mcyD gene copy numbers were significantly and positively correlated to sediment microcystins levels in the Lake of the Woods core (). Analogous correlations have previously been observed in the plankton between microcystin genes and microcystins over the growing season in lakes (Ha et al. Citation2009; Fortin et al. Citation2010; Pimentel and Giani Citation2013), although a positive relationship between DNA markers and toxins has not always been established (Beversdorf et al. Citation2015). Similarly, positive relationships between other cyanotoxins (nodularin and cylindrospermopsin) and the genes that synthesize them have also been reported for surface waters (Jiang et al. Citation2007; Koskenniemi et al. Citation2007). In contrast, the relationship between total microcystins and mcyD gene copy numbers was not statistically significant in Baptiste Lake ().
There are several possible reasons to explain the different relationships between mcyD, Microcystis 16S rRNA, and microcystins in the 2 lakes. For one, each lake would have different abiotic and biotic conditions in the sediments, leading to variation in preservation and binding to sediments of cyanobacterial DNA as well as microcystins. For this reason, it is not possible to compare the absolute gene copy numbers between lakes (Pal et al. Citation2015); it is common practice in the interpretation of paleolimnological proxies including DNA based proxies (Domaizon et al. Citation2013) to compare relative or normalized trends. Furthermore, differences in humic material and other interferences between sediment layers could also lead to differences in PCR amplification and thus gene copy quantification. Most importantly, the primers used to quantify the mcyD gene were a result of aligning the 50 mcyD sequences available on GenBank at the time of primer design and the latter were biased towards toxigenic strains of Microcystis (Fortin et al. Citation2010). The mcyD primers used here were clearly not capturing all toxin-producing taxa/strains of cyanobacteria as efficiently as Microcystis. For example, the mcyD primers used do not amplify mcyD in the microcystin producing Anabaena sp. 90, based on in silico PCR (using the primer function of Geneious software v. 9.0). The bias of the mcyD primers toward Microcystis taxa is further borne out by the significant correlations in both lakes between gene copy numbers of mcyD and the Microcystis specific gene fragment targeted (MICR 16S; , ). For LoW, and to a lesser extent Baptiste Lake, gene copy numbers of mcyD typically exceeded those of Microcystis 16S rRNA (). This result also points to an important role for other taxa in microcystin production, particularly considering that 2 gene copy numbers per cell are found for the latter while only 1 copy number per cell is reported for mcy genes ().
In light of the importance of Dolichospermum (and related taxa) throughout the sediment record in Baptiste Lake (), different specific primers would be required to accurately quantify all microcystins producing taxa. Unfortunately, we did not have sufficient sediment material left or the resources to pursue this avenue. Targeting specifically for Dolichospermum and developing more effective primers for microcystin genes (e.g., mcyE) would be fruitful avenues, although the drawback with degenerate primers is that they increase the likelihood of detecting false positives. As a first step here, we chose a conservative approach such that the primers used likely underestimated overall gene copy numbers (whether of glnA, Microcystis 16S rRNA, cyanobacterial 16S rRNA, or mcyD) to varying degrees, but would not have overestimated the target genes.
Comparison and interpretation of temporal trends in Lake of the Woods and Baptiste Lake
The 2 lakes differed in their specific patterns of cyanobacterial proxies through time. In Lake of the Woods, the mcyD gene was below detection prior to the 1970s, then rose more than 2 orders of magnitude to the present day, while its product, microcystin, was detected several decades later. This difference in timing is likely simply because molecular methods are much more sensitive than chemical methods; in plankton studies, the onset of toxigenic blooms is typically first detected via the former methods (Koskenniemi et al. Citation2007; Fortin et al. Citation2010). It is unlikely that the rise in mcyD in more recent sediments is because of poor preservation of sediment DNA in older sediments, given that both the bacterial housekeeping gene glnA and the cyanobacterial 16S rRNA were detected in relatively high gene copy numbers all the way back to the bottom of the LoW core (). Furthermore, mcyD could be found at high levels all the way to the bottom of the much longer Baptiste Lake core ().
In LoW, the appearance of mcyD also parallels the appearance of Microcystis (based on the 16S rRNA primers specific to Microcystis), although this genus may have appeared slightly earlier (). This is interesting, considering that Chen et al. (Citation2007) concluded based on correlations with phytoplankton taxonomic data over 1 yr that the main MC-LR producer in LoW was likely Anabaena (Dolichospermum) and that Microcystis was rarely dominant. Using qPCR techniques even low numbers of Microcystis would be detected. Furthermore, typical plankton sampling every 2 weeks could miss a Microcystis bloom, which nevertheless could still be recorded in the sediments.
Several relevant paleolimnological studies have been conducted on LoW. Rühland et al. (Citation2010) provided a comprehensive analysis of changes in diatom communities at several sites; they found little increase in diatom-inferred TP through time, and in fact TP may actually be declining (Hyatt et al. Citation2011). Their analysis of changes in the diatom assemblage was consistent with recent climate warming: A shift in community structure from Aulacoseira to Cyclotella taxa was observed since the early 1980s. The relative rise in Cyclotella appears to be a strong signal of climate warming in temperate lakes and has been documented in a growing number of studies across the northern hemisphere (Rühland et al. Citation2015). For LoW the instrument record indicates that the mean annual temperature has risen 1.2 C over the past ∼100 yr and lake ice records show that the ice-free season is almost a month longer since 1964 (Rühland et al. Citation2010). This means that the period of stratification is now also longer, which would favor small centric diatoms over larger colonial taxa that require turbulence for growth. Interestingly, the rise in Cyclotella coincides closely to the initial rise in mcyD genes (). This rise is also concomitant with an increase in the glnA gene copy numbers. The latter, as a proxy for total bacterial abundance, could be tracking overall primary productivity as bacterial numbers typically also increase with algal biomass and trophic state in lakes (Bird and Kalff Citation1984). An increase in algal productivity through climate change rather than land use change has been suggested for remote temperate lakes at high latitudes based on paleolimnological analyses (Smol et al. Citation2005). Recently, Paterson et al. (Citation2017) provided paleolimnological evidence of a rise in algal productivity from spectrally inferred determinations of chlorophyll a in lake sediments in LoW: The trend was significantly related to regional climate warming variables rather than eutrophication.
In contrast, in Lake Baptiste, the mcyD gene was detected at high gene copy numbers throughout the entire core, including the very bottom, corresponding to 1830 and thus well before European settlement of the region. In their recent analysis of sediment DNA from 2 perialpine lakes, Monchamp et al. (Citation2016) detected mcyA (indicative of microcystin biosynthesis) via PCR (presence/absence) as early as 1912 in Lake Zurich, indicating that this lake may have been experiencing toxic blooms for some time, although perhaps as a result of cultural eutrophication, given the longer time frame of European land use. In contrast, mcyA was only detected since the years post 2000 in the neighboring lake, Greifensee. More recently, Legrand et al. (Citation2017) established that the mcyA gene was present throughout a 220-yr record of a eutrophic lake in France, but that, in contrast, anatoxin-a genes appeared only in the more modern sediments.
Baptiste Lake has been consistently eutrophic over at least the past ∼150 yr (Adams et al. Citation2014). The present study demonstrates that toxic cyanobacteria have also always been abundant, given both the high copy numbers of mcyD and the presence of microcystins throughout the ∼175-yr record (). However, the sediment record indicates a very large increase in microcystins since ∼2000, and a much smaller rise in mcyD gene copy numbers, likely reflecting an inadequate matching of the primer set to the toxigenic assemblage in Baptiste Lake. Microcystin concentrations and mcyD were both highest in ∼2008 (3340 ng/g d.w of microcystin, 1.72 × 10⁵ mcyD gene copies/g f.w.).
Previous paleolimnological studies have shown that this naturally eutrophic lake has become increasingly eutrophic since the watershed was subjected to land clearing for agriculture (Hickman et al. Citation1990; Manning et al. Citation1999; Adams et al. Citation2014). The sharp increases in microcystins (and to a much lesser extent in mcyD), near the surface of the core, are consistent with an increase in both diatom-inferred TP and total Kjeldahl nitrogen (TKN), as well as the rise in the cyanobacterial pigment echinenone, since 1990 (Zastepa et al. Citation2017a), but the magnitude of change among these proxies of eutrophication varies. This recent eutrophication is associated with the appearance of a common eutrophic diatom species, Stephanodiscus hanzschii (Adams et al. Citation2014, ) and could not be attributed to various measures of climate change over the instrument record (Zastepa et al. Citation2017a). Interestingly, the cyanobacterial community structure at the level of order does not appear to have changed dramatically or consistently in recent times. From the high-throughput sequencing, Nostocales and in particular Dolichospermum (and related taxa; Rajaniemi et al. Citation2005) formed the majority of the cyanobacteria OTUs, not the Chroococcales over the entire sediment record (). Dolichospermum and related taxa include species or strains that produce microcystin, but their importance as microcystin producers both in Baptiste Lake and in LoW could not be resolved in this study and requires further molecular analyses.
Conclusions and lake management implications
This study illustrates how cyanobacterial genes can be used to reconstruct the temporal dynamics of cyanobacteria including toxigenic taxa such as Microcystis from lake sediments over centennial scales. To account for sediment preservation issues, we focused on (1) gene markers that are relatively short, as they preserve better than longer fragments of DNA, and (2) the relative changes in cyanobacterial genes in comparison to a universal bacterial housekeeping gene, rather than trends in absolute numbers. Analyses of sediment DNA may thus serve as rapid and increasingly cost-effective proxies of cyanotoxin production, cyanobacterial composition, and diversity through time. Such information can help guide lake management initiatives. Since toxic blooms were likely common in Lake Baptiste since before European settlement and whereas they appear to have been triggered by recent anthropogenic stress in Lake of the Woods, restoration measures and targets need to be adjusted accordingly for each lake. In the case of Baptiste Lake, microcystins have been part of the lake ecosystem since before European settlement and agricultural intensification, so it may not be realistic or even desirable to eradicate toxic blooms completely. Microcystins are likely part of the normal state of many similarly naturally eutrophic systems across central Canada and the United States. Nevertheless, as nutrient loading has increased by ∼50% since the 1990s (Zastepa et al. Citation2017b), we noticed a sharp rise in microcystins, and management should thus focus on reducing loading to levels prior to the 1990s, which will in turn lower microcystins concentrations at least to historical levels. In the case of LoW, the occurrence of microcystins is a much more recent phenomenon and not part of the natural state of this large transboundary lake. Climate change rather than nutrient loading may be responsible for the appearance and subsequent rise of toxic blooms. In this situation, the effective management of toxic cyanobacteria will be much more challenging and efforts at nutrient abatement will not be as effective.
Supplemental Material
Download PDF (33.1 KB)Supplemental Material
Download PDF (2.5 MB)Supplemental Material
Download MS Word (19.2 KB)Acknowledgments
We thank Philip Pelletier for his guidance in the Core Molecular Biology and Genomics Laboratory at the University of Ottawa, a dedicated DNA lab, where the extractions and qPCR work were conducted. Similarly, we thank Linda Kimpe for her expertise in 210Pb dating of the sediment samples in the Laboratory for the Analysis of Natural and Synthetic Environmental Toxins (LANSET), another core facility of the University of Ottawa. We thank the 3 anonymous reviewers for their constructive comments.
Additional information
Funding
Related Research Data
References
- Adams KE, Taranu ZE, Zurawell R, Cumming BF, Gregory-Eaves I. 2014. Insights for lake management gained when paleolimnological and water column monitoring studies are combined: a case study from Baptiste Lake. Lake Reserv Manag. 30:11–22.
- Benoit G, Rozan TF. 2001. 210Pb and 137Cs dating methods in lakes: a retrospective study. J Paleolimnol. 25:455–465.
- Beversdorf LJ, Chaston SD, Miller TR, McMahon KD, Hrudey S. 2015. Microcystin mcyA and mcyE gene abundances are not appropriate indicators of microcystin concentrations in lakes. PLoS One. 10(5):e0125353.
- Bird DF, Kalff J. 1984. Empirical relationships between bacterial abundance and chlorophyll concentration in fresh and marine waters. Can J Fish Aquat Sci. 41(7):1015–1023.
- Brazeau ML, Blais JM, Paterson AM, Keller W, Poulain AJ. 2013. Evidence for microbially mediated production of elemental mercury (Hg0) in subarctic lake sediments. Appl Geochem. 37:142–148.
- Bustin SA, Benes V, Garson JA, Hellemans J, Huggett J, Kubista M, Mueller R, Nolan T, Pfaffl MW, Shipley GL, et al. 2009. The MIQE guidelines: minimum information for publication of quantitative real-time PCR experiments. Clin Chem. 55(4):611–622.
- Caporaso JG, Kuczynski J, Stombaugh J, Bittinger K, Bushman FD, Costello EK, Fierer N, Peña AG, Goodrich JK, Gordon JI, et al. 2010. QIIME allows analysis of high-throughput community sequencing data. Nat Methods. 7(5):335–336.
- Chen H, Burke JM, Dinsmore WP, Prepas EE, Fedorak PM. 2007. First assessment of cyanobacterial blooms and microcystin-LR in the Canadian portion of Lake of the Woods. Lake Reserv Manag. 23:169–178.
- Chorus I, Bartram J. 1999. Toxic cyanobacteria in water: a guide to their public health consequences, monitoring and management. World Health Organization, E&FN Spon, Routledge, London, UK.
- Cole JR, Wang Q, Fish JA, Chai B, McGarrell DM, Sun Y, Brown CT, Porras-Alfaro A, Kuske CR, Tiedje JM. 2014. Ribosomal database project: data and tools for high throughput rRNA analysis. Nucl Acids Res. 42(D1):D633–D642.
- Coolen M. 2004. Combined DNA and lipid analyses of sediments reveal changes in Holocene haptophyte and diatom populations in an Antarctic lake. Earth Planet Sci Lett. 223(1–2):225–239.
- Coulon F, Chronopoulou PM, Fahy A, Païssé S, Goñi-Urriza M, Peperzak L, Acuña Alvarez L, McKew BA, Brussaard CPD, Underwood GJC, et al. 2012. Central role of dynamic tidal biofilms dominated by aerobic hydrocarbonoclastic bacteria and diatoms in the biodegradation of hydrocarbons in coastal mudflats. Appl Environ Microbiol. 78(10):3638–3648.
- DeSellas AM, Paterson AM, Clark BJ, Baratono NG, Sellers TJ. 2009. State of the basin report for Lake of the Woods and Rainy River basin. Multi-Agency Technical Report. http://www.rainylakeconservancy.org/Resources/Documents/2009_State_of_the_Basin_Report.pdf
- Domaizon I, Savichtcheva O, Debroas D, Arnaud F, Villar C, Pignol C, Alric B, Perga ME. 2013. DNA from lake sediments reveals the long-term dynamics and diversity of Synechococcus assemblages. Biogeosciences. 10(6):3817–3838.
- Dowd SE, Callaway TR, Wolcott RD, Sun Y, McKeehan T, Hagevoort RG, Edrington TS. 2001. Evaluation of the bacterial diversity in the feces of cattle using 16S rDNA bacterial tag-encoded FLX amplicon pyrosequencing (bTEFAP). Nucleic Acids Res. 29173–174.
- Downing JA, Watson SB, McCauley E. 2001. Predicting cyanobacteria dominance in lakes. Can J Fish Aquat Sci. 58(10):1905–1908.
- Engene N, Gerwick WH. 2011. Intra-genomic 16S rRNA gene heterogeniety in cyanobacterial genomes. Fottea. 11(1):17–24.
- Fortin N, Aranda-Rodriguez R, Jing H, Pick F, Bird D, Greer CW. 2010. Detection of microcystin-producing cyanobacteria in Missisquoi Bay, Quebec, Canada, using quantitative PCR. Appl Environ Microbiol. 76(15):5105–5112.
- Funari E, Testai E. 2008. Human health risk assessment related to cyanotoxins exposure. Crit Rev Toxicol. 38(2):97–125.
- Glew J. 1991. Miniature gravity corer for recovering short sediment cores. J Paleolimnol. 5285–287.
- Ha JH, Hidaka T, Tsuno H. 2009. Quantification of toxic Microcystis and evaluation of its dominance ratio in blooms using Real-Time PCR. Environ Sci Technol. 43(3):812–818.
- Haas BJ, Gevers D, Earl AM, Feldgarden M, Ward DV, Giannoukos G, Ciulla D, Tabbaa D, Highlander SK, Sodergren E, et al. 2011. Chimeric 16S rRNA sequence formation and detection in Sanger and 454-pyrosequenced PCR amplicons. Genome Res. 21(3):494–504.
- Harke MJ, Steffen MM, Gobler CJ, Otten TG, Wilhelm SW, Wood SA, Paerl HW. 2016. A review of the global ecology, genomics, and biogeography of the toxic cyanobacterium, Microcystis spp. Harmful Algae. 54:4–20.
- Hickman M, Schweger C, Klarer D. 1990. Baptiste Lake, Alberta: a late holocene history of changes in a lake and its catchment in the southern Boreal forest. J Paleolimnol. 4:253–267.
- Hisbergues M, Christiansen G, Rouhiainen L, Sivonen K, Börner T. 2003. PCR-based identification of microcystin-producing genotypes of different cyanobacterial genera. Arch Microbiol. 180(6):402–410.
- Hurt RA, Qiu X, Wu L, Roh Y, Palumbo AV, Tiedje JM, Zhou J. 2001. Simultaneous recovery of RNA and DNA from soils and sediments. Appl Environ Microbiol. 67(10):4495–4503.
- Hyatt CV, Paterson AM, Rühland KM, Smol JP. 2011. Examining 20th century water quality and ecological changes in the Lake of the Woods, Ontario, Canada: a paleolimnological investigation. J. Great Lakes Res. 37(3):456–469.
- Jaiswal P, Singh PK, Prasanna R. 2008. Cyanobacterial bioactive molecules: an overview of their toxic properties. Can J Microbiol. 54(9):701–717.
- Jiang H, Dong H, Yu B, Liu X, Li Y, Ji S, Zhang CL. 2007. Microbial response to salinity change in Lake Chaka, a hypersaline lake on Tibetan plateau. Environ Microbiol. 9(10):2603–2621.
- Jungblut AD, Hawes I, Mountfort D, Hitzfeld B, Dietrich DR, Burns BP, Neilan BA. 2005. Diversity within cyanobacterial mat communities in variable salinity meltwater ponds of McMurdo Ice Shelf, Antarctica. Environ Microbiol. 7(4):519–529.
- Kaebernick M, Neilan BA, Borner T, Dittmann E. 2000. Light and the transcriptional response of the microcystin biosynthesis gene cluster. Appl Environ Microbiol. 66(8):3387–3392.
- Kamenova S, Bartley TJ, Bohan DA, Boutain JR, Colautti RI, Domaizon I, Fontaine C, Lemainque A, Le Viol I, Mollot G, et al. 2017. Invasions toolkit: current methods for tracking the spread and impact of invasive species, Chap 3. In: Advances in ecological research. Cambridge, MA: Academic Press; pp. 85–182. doi:10.1016/bs.aecr.2016.10.009.
- Kaneko T, Nakajima N, Okamoto S, Suzuki I, Tanabe Y, Tamaoki M, Nakamura Y, Kasai F, Watanabe A, Kawashima K, et al. 2007. Complete genomic structure of the bloom-forming toxic cyanobacterium Microcystis aeruginosa NIES-843. DNA Res. 14(6):247–256.
- Kleinteich J, Hildebrand F, Wood SA, Ciŕs S, Agha R, Quesada A, Pearce DA, Convey P, K¨Pper FC, Dietrich DR, 2014. Diversity of toxin and non-toxin containing cyanobacterial mats of meltwater ponds on the Antarctic Peninsula: a pyrosequencing approach. Antarct Sci. 26(5):521–532.
- Koskenniemi K, Lyra C, Rajaniemi-Wacklin P, Jokela J, Sivonen K. 2007. Quantitative real-time PCR detection of toxic Nodularia cyanobacteria in the Baltic Sea. Appl Environ Microbiol. 73(7):2173–2179.
- Kotak BG, Zurawell RW. 2007. Cyanobacterial toxins in Canadian freshwaters: a review. Lake Reserv Manag. 23(2):109–122.
- Kyle M, Haande S, Sønstebø J, Rohrlack T. 2015. Amplification of DNA in sediment cores to detect historic Planktothrix occurrence in three Norwegian lakes. J Paleolimnol. 53(1):61–72.
- Leavitt PR, Hodgson DA. 2002. Sedimentary pigments. In: Tracking environmental change using lake sediments. Dordrecht: Kluwer Academic Publishers.
- LeBlanc Renaud S, Pick FR, Fortin N. 2011. Effect of light intensity on the relative dominance of toxigenic and nontoxigenic strains of Microcystis aeruginosa. Appl Environ Microbiol. 77(19):7016–7022.
- Legendre P, Legendre L. 2012. Numerical Ecology. 3rd ed. Amsterdam, The Netherlands: Elsevier.
- Legrand B, Lamarque A, Sabart M, Latour D. 2017. Benthic archives reveal occurrence and dominance of toxic cyanobacteria in a eutrophic lake over the last 220 years. Toxins. 9(9):271.
- Lejzerowicz F, Esling P, Majewski W, Szczuciński W, Decelle J, Obadia C, Arbizu PM, Pawlowski J. 2013. Ancient DNA complements microfossil record in deep-sea subsurface sediments. Biol Lett. 9(4):20130283.
- Li S, Xiao X, Yin X, Wang F. 2006. Bacterial community along a historic lake sediment core of Ardley Island, West Antarctica. Extremophiles. 10(5):461–467.
- Malbrouck C, Kestemont P. 2006. Effects of microcystins on fish. Environ Toxicol Chem. 25(1):72–86.
- Manning PG, Prepas EE, Serediak MS. 1999. Pyrite and vivianite intervals in the bottom sediments of eutrophic Baptiste Lake, Alberta. Can Minerologist. 37:593–601.
- Martínez de la Escalera G, Antoniades D, Bonilla S, Piccini C. 2014. Application of ancient DNA to the reconstruction of past microbial assemblages and for the detection of toxic cyanobacteria in subtropical freshwater ecosystems. Mol Ecol. 23(23):5791–5802.
- Miller MA, Kudela RM, Mekebri A, Crane D, Oates SC, Tinker MT, Staedler M, Miller WA, Toy-Choutka S, Dominik C, et al. 2010. Evidence for a novel marine harmful algal bloom: cyanotoxin (microcystin) transfer from land to sea otters. PLoS One. 5(9):e12576.
- Mitchell P, Prepas EE. 1990. Atlas of Alberta lakes. Edmonton, AB: University of Alberta Press.
- Mohamed ZA, El-Sharouny HM, Ali WSM. 2006. Microcystin production in benthic mats of cyanobacteria in the Nile River and irrigation canals, Egypt. Toxicon. 47(5):584–590.
- Monchamp M-E, Walser J-C, Pomati F, Spaak P. 2016. Sedimentary DNA reveals cyanobacterial community diversity over 200 years in two perialpine lakes. Appl Environ Microbiol. 82(21):6472–6482.
- Neilan BA, Dittmann E, Rouhiainen L, Bass RA, Schaub V, Sivonen K, Börner T. 1999. Nonribosomal peptide synthesis and toxigenicity of cyanobacteria. J Bacteriol. 181(13):4089–4097.
- Nübel U, Garcia-Pichel F, Muyzer G. 1997. PCR primers to amplify 16S rRNA genes from cyanobacteria. Appl Environ Microbiol. 63(8):3327–3332.
- Paerl HW, Huisman J. 2008. Climate. Blooms like it hot. Science. 320(5872):57–58.
- Pal S, Gregory-Eaves I, Pick FR. 2015. Temporal trends in cyanobacteria revealed through DNA and pigment analyses of temperate lake sediment cores. J Paleolimnol. 54(1):87–101.
- Paterson AM, Rühland KM, Anstey CV, Smol JP. 2017. Climate as a driver of increasing algal production in Lake of the Woods, Ontario, Canada. Lake. Reserv Manag. 33403–414.
- Pennington W, Tutin TG, Cambray RS, Fisher EM. 1973. Observations on lake sediments using fallout 137 Cs as a tracer. Nature. 242(5396):324–326.
- Pick FR. 2016. Blooming algae: a Canadian perspective on the rise of toxic cyanobacteria. Can J Fish Aquat Sci. 73(7):1149–1158.
- Pimentel JSM, Giani A. 2013. Estimating toxic cyanobacteria in a Brazilian reservoir by quantitative real-time PCR, based on the microcystin synthetase D gene. J Appl Phycol. 25(5):1545–1554.
- Poulain AJ, Aris-Brosou S, Blais JM, Brazeau M, Keller W, Paterson AM. 2015. Microbial DNA records historical delivery of anthropogenic mercury. Isme J. 9(12):2541–2550.
- R Core Team. 2013. R: a language and environment for statistical computing. R Foundation for Statistical Computing, Vienna, Austria. http://www.R-project.org/.
- Rajaniemi P, Hrouzek P, Kaštovská K, Willame R, Rantala A, Hoffmann L, Komárek J, Sivonen K. 2005. Phylogenetic and morphological evaluation of the genera Anabaena, Aphanizomenon, Trichormus and Nostoc (Nostocales, Cyanobacteria). Int J Syst Evol Microbiol. 55(Pt 1):11–26.
- Räsänen J, Kauppila T, Vuorio K. 2006. Sediment and phytoplankton records of the cyanobacterial genus Anabaena in boreal Lake Pyhäjärvi. Hydrobiologia. 568(1):455–465.
- Rinta-Kanto JM, Ouellette AJA, Boyer GL, Twiss MR, Bridgeman TB, Wilhelm SW. 2005. Quantification of Toxic Microcystis spp. during the 2003 and 2004 blooms in Western Lake Erie using Quantitative Real-Time PCR. Environ Sci Technol. 39(11):4198–4205.
- Rühland KM, Paterson AM, Hargan K, Jenkin A, Clark BJ, Smol JP. 2010. Reorganization of algal communities in the Lake of the Woods (Ontario, Canada) in response to turn-of-the-century damming and recent warming. Limnol Oceanogr. 55:2433–2451.
- Rühland KM, Paterson AM, Smol JP. 2015. Lake diatom responses to warming: reviewing the evidence. J Paleolimnol. 54(1):1–35.
- Savichtcheva O, Debroas D, Kurmayer R, Villar C, Jenny JP, Arnaud F, Perga ME, Domaizon I. 2011. Quantitative PCR enumeration of total/toxic Planktothrix rubescens and total cyanobacteria in preserved DNA isolated from lake sediments. Appl Environ Microbiol. 77(24):8744–8753.
- Schirrmeister BE, Anisimova M, Bagheri HC, Dalquen DA. 2012. Gene copy number variation and its significance in cyanobacteria phylogeny. Mol Biol Evol. 121586–1591.
- Schloss PD, Westcott SL, Ryabin T, Hall JR, Hartmann M, Hollister EB, Lesniewski RA, Oakley BB, Parks DH, Robinson CJ, et al. 2009. Introducing mothur: open-source, platform-independent, community-supported software for describing and comparing microbial communities. Appl Environ Microbiol. 75(23):7537–7541.
- Shokralla S, Spall JL, Gibson JF, Hajibabaei M. 2012. Next-generation sequencing technologies for environmental DNA research. Mol Ecol. 21(8):1794–1805.
- Simpson GL. 2016. Permute: functions for generating restricted permutations of data. R package version 0.9-4.Available from: https://CRAN.R-project.org/package=permute
- Smol JP. 2008. Pollution of lakes and rivers: a paleoenvironmental perspective. New York, NY: Blackwell Pub.
- Smol JP, Wolfe AP, Birks HJB, Douglas MSV, Jones VJ, Korhola A, Pienitz R, Ruhland K, Sorvari S, Antoniades D, et al. 2005. Climate-driven regime shifts in the biological communities of arctic lakes. PNAS. 102(12):4397–4402.
- Stoeva MK, Aris-Brosou S, Chételat J, Hintelmann H, Pelletier P, Poulain AJ. 2014. Microbial community structure in lake and wetland sediments from a high arctic polar desert revealed by targeted transcriptomics. PLoS One. 9(3):e89531.
- Sun D-L, Jiang X, Wu QL, Zhou N-Y. 2013. Intragenomic heterogeneity of 16S rRNA genes causes overestimation of prokaryotic diversity. Appl Environ Microbiol. 79(19):5962–5969.
- Taranu ZE, Gregory-Eaves I, Leavitt PR, Bunting L, Buchaca T, Catalan J, Domaizon I, Guilizzoni P, Lami A, McGowan S, et al. 2015. Acceleration of cyanobacterial dominance in North temperate-subarctic lakes during the Anthropocene. Ecol Lett. 18(4):375–384.
- Taylor S, Wakem M, Dijkman G, Alsarraj M, Nguyen M. 2010. A practical approach to RT-qPCR-Publishing data that conform to the MIQE guidelines. Methods. 50(4):S1–S5.
- Tillett D, Dittmann E, Erhard M, von Döhren H, Börner T, Neilan BA. 2000. Structural organization of microcystin biosynthesis in Microcystis aeruginosa PCC7806: an integrated peptide-polyketide synthetase system. Chem. Biol. 7(10):753–764.
- van Geel B, Mur LR, Ralska-Jasiewiczowa M, Goslar T. 1994. Fossil akinetes of Aphanizomenon and Anabaena as indicators for medieval phosphate-eutrophication of Lake Gosciaz (Central Poland). Rev Palaeobot Palynol. 83(1–3):97–105.
- Wang Q, Garrity GM, Tiedje JM, Cole JR. 2007. Naive Bayesian classifier for rapid assignment of rRNA sequences into the new bacterial taxonomy. Appl Environ Microbiol. 73(16):5261–5267.
- Winter JG, DeSellas AM, Fletcher R, Heintsch L, Morley A, Nakamoto L, Utsumi K. 2011. Algal blooms in Ontario, Canada: Increases in reports since 1994. Lake Reserv Manag. 27(2):107–114.
- Ye W, Tan J, Liu X, Lin S, Pan J, Li D, Yang H. 2011. Temporal variability of cyanobacterial populations in the water and sediment samples of Lake Taihu as determined by DGGE and real-time PCR. Harmful Algae. 10(5):472–479.
- Yuan M, Carmichael WW, Hilborn ED. 2006. Microcystin analysis in human sera and liver from human fatalities in Caruaru, Brazil 1996. Toxicon. 48(6):627–640.
- Zastepa A, Taranu ZE, Kimpe LE, Blais JM, Gregory-Eaves I, Zurawell RW, Pick FR. 2017a. Reconstructing a long-term record of microcystins from the analysis of lake sediments. Sci Total Environ. 579:893–901.
- Zastepa A, Pick FR, Blais JM. 2017b. Distribution and flux of microcystin congeners in lake sediments. Lake Reserv Manag. 33(4):444–451.
- Zastepa A, Pick FR, Blais JM, Saleem A. 2015. Analysis of intracellular and extracellular microcystin variants in sediments and pore waters by accelerated solvent extraction and high performance liquid chromatography-tandem mass spectrometry. Analytica Chimica Acta 872:26–34.
- Zurawell R, Kotak B, Prepas EE. 1999. Influence of lake trophic status on the occurrence of microcystin-LR in the tissue of pulmonate snails. Freshwater Biol. 42(4):707–718.