
 ?Mathematical formulae have been encoded as MathML and are displayed in this HTML version using MathJax in order to improve their display. Uncheck the box to turn MathJax off. This feature requires Javascript. Click on a formula to zoom.
Abstract
Miranda LE, Raines CD. 2019. Reservoir diel water quality patterns relative to riparian shade. Lake Reserv Manage. 35:148–155.
Investigations into the effects of riparian shade on water quality have focused on streams, with less emphasis on natural lakes, and almost no attention given to reservoirs. In view of this gap, our objective was to assess diel water quality patterns in the nearshore zone of a reservoir and test whether diel patterns differed relative to the presence or absence of riparian shade. Light intensity, temperature, dissolved oxygen, pH, and oxidation–reduction potential were higher in unshaded sites (P < 0.05), whereas phosphate levels were higher in shaded sites. Levels of nitrate, turbidity, and specific conductance were similar in shaded and unshaded sites. Most variables exhibited distinct diel cycles. Light intensity in shaded and unshaded sites peaked simultaneously near mid-day; most other variables peaked several hours later in the afternoon and evening, but 1–2 h earlier in shaded sites. Unlike in streams, in most large lacustrine ecosystems the nearshore shaded band is small relative to the unshaded open water, and consequently is not expected to have an extensive influence on whole-lake water quality. Nevertheless, because of the diversity of microhabitats available in nearshore areas, including those created by the effects of shade on water quality, the nearshore zone plays a disproportionate role in maintaining integrity of a lake or reservoir ecosystem. Existing guidelines inform shade management in lakes and reservoirs only indirectly and in generalities; additional research is needed to develop best management practices that address shade more comprehensively.
The riparian zone is a key ecotone that affects physical, chemical, and biological characteristics of lake and stream environments. This zone performs multiple functions that directly or indirectly influence water, including bank stabilization, control of local wind speed and wave action, regulation of solar radiation and temperature, nutrient filtering, and contribution of allochthonous organic materials (Pusey and Arthington Citation2003; Wang et al. Citation2003; Bowler et al. Citation2012). In turn, these functions influence aquatic biotic assemblages, including plankton, invertebrates, and fish (Pusey and Arthington Citation2003; Wei et al. Citation2004).
Shade provided by a tree canopy in the riparian zone can substantially reduce exposure to solar radiation (Hill and Dimick Citation2002). Reductions in solar radiation often lead to lower water temperatures (Ebersole et al. Citation2003) and reduced primary production via photosynthesis (Mosisch et al. Citation2001). Conversely, absence or removal of riparian vegetation can dramatically increase water temperature and photosynthesis (Brown and Krygier Citation1970; Burton and Likens Citation1973; Feller Citation1981; Broadmeadow et al. Citation2011). A major effect of increased water temperature is decreased concentrations of dissolved gases, including dissolved oxygen, despite the increase in photosynthesis. In shaded sites diminished photosynthesis may result in reduced uptake of carbon dioxide and dissolved nutrients such as nitrogen and phosphorus, and reduced production of dissolved oxygen. Shifts between carbon dioxide and dissolved oxygen dominance can modify pH (Mosisch et al. Citation1999; Falkowski and Raven Citation2013). Oxidation–reduction potential (i.e., capacity to release or accept electrons from chemical reactions) will shift with photosynthetic activity. Specific conductance (an indicator of ionic concentrations) may also be partially affected by shade, because during photosynthesis ions are removed from solution (Falkowski and Raven Citation2013).
Light is a key driving factor of life in aquatic ecosystems. In many aquatic environments light controls ecosystem mechanics, so that excluding or reducing light can create numerous effects on the physical and chemical environment, and subsequently the aquatic biota (Bourassa and Cattaneo Citation2000; Gjerløv and Richardson Citation2010). Changes in various water quality variables that begin with change in light and temperature increase the diversity of microhabitats and influence biotic composition (Naiman and Latterell Citation2005). Moreover, the diversity in light intensity and spectral composition produced by shaded and unshaded sites creates diverse mosaics of light-based habitats in lake shores that attract different biotic assemblages (McCartt et al. Citation1997). The relevance of the riparian shade effect to the entire lake ecosystem would seem to be inversely related to the extent of the pelagic environment. Nevertheless, shoreline ecotones in lentic systems may have a disproportionate effect on biotic assemblages (Wei et al. Citation2004; Vadeboncoeur et al. Citation2011; Vander Zanden et al. Citation2011).
Investigations into the effect of riparian shade on water quality have been limited mostly to streams, with less emphasis on natural lakes (Lauck et al. Citation2005), and almost no attention given to reservoirs (Correll Citation1997; Lowrance et al. Citation1997). Considering this gap in information, and to inform decisions about riparian habitat conservation and management in reservoirs, our objective was to determine whether riparian shade contributed to the diversity of diel nearshore water quality patterns in a reservoir. To this end, we examined various water quality characteristics in shaded and unshaded nearshore sites.
Methods
Study reservoir
The study was conducted in Columbus Lake, a eutrophic impoundment of the Tennessee–Tombigbee Waterway, a chain of mostly run-of-the-river reservoirs in northeast Mississippi. The reservoir is 3,600 ha in surface area and relatively shallow (mean depth 2.0 m; maximum depth 14.3 m). It has limited annual water-level fluctuations (<0.5 m), low water residence time (mean 17 d, summer), and low water clarity (mean Secchi depth 77 cm, summer). The reservoir stratifies vertically only in deeper reaches near the dam. Wind in the upper reaches is minimal during summer, and the complex shape of the reservoir () precludes long fetches. Throughout most of its shoreline there is a well-developed forested riparian zone that, depending on time of year, provides diverse levels of shade to nearshore aquatic environments.
Figure 1. Columbus Lake, a 3600-ha reservoir in northeast Mississippi. The map shows the distribution of 27 shaded and unshaded sites sampled in the upper reaches of the reservoir over 24-h periods between 11 June and 13 August 2015. Sampling sites were distributed in shores facing south (unshaded) or facing north (shaded). Because of the angle of the sun, as it travels in clockwise fashion (illustrated in the upper end of the figure), shores facing south receive direct sunlight for 12–13 h, and shores facing north are sheltered from direct sunlight for 12–13 h.
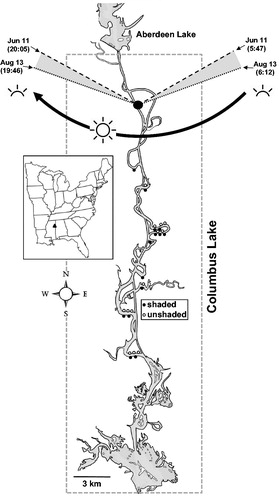
The sampling sites were distributed in the upper reaches of Columbus Lake (), which impounds the Tombigbee River. The impounded channel meanders sharply east–west as it advances north–south. The east–west meandering facilitated finding sampling sites that were mostly shaded (south shore) and mostly unshaded (north shore). At the latitude of Columbus Lake (33°38'N), during June–August, day length from dawn to dusk extends to 13.6–14.3 h. Because of the angle of the sun as it travels in clockwise fashion (), south-shore sites are sheltered from direct sunlight during most daytime hours (12–13 h); conversely, north-shore sites receive direct sunlight during most daytime hours (12–13 h). Shaded sites receive direct sunlight only for a short time (<1 h) right after sunrise and right before sunset, when light intensity is faint. Thus, the riparian zones of shaded and unshaded sites were forested and had similar levels of submerged leafy and woody debris. Sites were selected to include a diversity of depths ranging from 2 to 3.5 m; shallower sites were excluded to lessen the effect of sediment respiration (Beutel Citation2003).
Water sampling
Sampling was conducted over a 63-d period starting in mid June (day of year, DOY, 162) and early-August (DOY 225), a time expected to have the greatest solar radiation (summer solstice DOY 172) and thus provide the largest contrast between shaded and unshaded sites. Sites were selected with simple random sampling from within a framework of shaded and unshaded sites. Only one site at a time was sampled, each site was sampled approximately every 2–4 d, sites were sampled in the order in which they were randomly selected, and there were systematically alternating shaded and unshaded sites between sampling events. Each site was sampled only once. In all, 27 sites including shaded (N = 13) and unshaded (N = 14) sites were sampled.
All water quality characteristics were measured in situ by automated equipment that recorded multiple variables every 1 h over 24-h periods. At each site, light intensity (lx) and surface water temperature (C) were recorded at a depth of 0.1 m using HOBO Pendant temperature and light 8K data loggers (Onset, Bourne, MA). Two loggers as a set were deployed simultaneously and values were averaged in 0.5-h intervals. Dissolved oxygen (DO, mg/L), temperature (C), turbidity (NTU), oxidation–reduction potential (ORP, mV), pH, and specific conductance (µS/cm) were measured with a Hach Hydrolab DS5 multiprobe (Hach, Loveland, CO). The sensor was suspended at 1 m below the water surface. Nitrate (NO3-; mg/L) was measured using a submersible ultraviolet nitrate analyzer V2 UV meter (Sea-Bird Scientific, Bellevue, WA). Phosphate (PO43-; mg/L) was measured with a Wet Labs® Cycle PO4 sensor (Sea-Bird Scientific). The same set of instruments was used at all sites. Calibration and maintenance schedules suggested by manufacturers were followed.
Data analysis
We fitted an analysis of covariance model to test (1) whether water quality variables differed between shaded and unshaded sites, (2) whether they followed a diel cycle, and (3) whether the pattern of the cycle differed between shaded and unshaded sites. Also added to the model were DOY and depth to remove possible variability they might contribute to diel cycles. The model was fitted to each water quality variable separately using trigonometric polynomial regression to describe daily cycles as
(1)
(1)
where yt = value for water quality variable y at time of day t, b0 = intercept, b1 = regression coefficient for indicator variable s (shade), coded as 0 (unshaded) and 1 (shaded), b2–b5 = regression coefficients for a sine wave, c1 = (2·π·t)/24, b6 = regression coefficient for a linear effect of d (DOY), b7 = regression coefficient for a quadratic effect of d, and b8 = regression coefficient for a linear effect of z (depth).
In Equationequation 1 b2(1)
(1) and b3 are sufficient to model a symmetric diel cycle, but b4 and b5 are necessary if the cycle is asymmetrical. A statistically significant (P < 0.05) b1 indicates differences in yt between shaded and unshaded sites; a significant b2 indicates sinusoidal diel cycles at different levels of yt; a significant b3 indicates peaks and dips of shaded and unshaded diel cycles occur at different times; a significant b4 indicates differences in ascending and descending slopes; a significant b5 indicates peaks and dips are of different amplitudes; a significant b6 indicates a linear (+/−) effect of DOY; a significant b7, in combination with a significant b6, indicates an arched or curved pattern relative to DOY; and a significant b8 indicates a linear (+/−) effect of depth.
Results
The analysis of covariance () indicated that 7 of the 10 water quality variables differed significantly between shaded and unshaded sites (b1) and exhibited significant sinusoidal diel cycles (b2). No significant differences between shaded or unshaded sites and no significant diel cycles were detected for turbidity, specific conductance, or nitrates. Scatterplots of data series suggested that turbidity and specific conductance were sensitive to periodic thunderstorms (once or twice per week) that quickly raised turbidity and reduced specific conductance. Subsequently, for several days turbidity decreased and specific conductance increased. After 7–10 d without a rain event, weak diel cycles in turbidity did become apparent, but not for specific conductance. There was no effect of depth of the sample site (P ≥ 0.16) and no clear linear or curved temporal pattern (P ≥ 0.08) over the 46-d study period for any of the 10 variables.
Table 1. Mean and minimum–maximum (in parentheses) of 10 water quality variables recorded in shaded (N = 13) and unshaded (N = 14) sites over 24-h periods in Columbus Lake, Mississippi, 11 June–13 August 2015. Also shown is the statistical significance (P value) for regression coefficients b1–b8 listed in Equationequation 1(1)
(1) and fitted to each of the water quality variables. A statistically significant (P < 0.05) coefficient indicates: b1, differences in yt between shaded and unshaded sites; b2, sinusoidal diel cycles at different levels of yt; b3, peaks and dips of shaded and unshaded diel cycles at different times; b4, differences in ascending and descending slopes; b5, peaks and dips of different amplitudes; b6, a linear (+/−) effect of DOY; b7, in combination with a significant b6, an arched or curved pattern relative to DOY; b8, a linear (+/−) effect of depth.
Seven variables including light intensity, temperature at 0.1 and 1 m, DO, pH, ORP, and PO43- exhibited diel cycles (; ). Light intensity peaked near 1300 h in shaded and unshaded sites, with unshaded sites peaking at higher intensity averaging approximately 40,000 lx, and shaded sites peaking near 8000 lx. Temperatures at 0.1 m were similar through the morning hours in shaded and unshaded sites, peaked around 1600–1800 h about 0.5–1.0 C higher in unshaded sites, and decreased through the evening and night until a low was reached near 0400–0500 h. Temperatures at 1 m followed a cycle similar to temperatures at 0.1 m, except that in the afternoon they did not rise as high and peaked 3–4 h later. At night, differences in temperature between 0.1 and 1 m were smaller than during the day. The temperatures at 1 m were similar in shaded and unshaded sites, except that in unshaded sites they peaked about 1 h earlier.
Figure 2. Mean diel patterns of water quality variables recorded in shaded (N = 13) and unshaded (N = 14) sites of Columbus Lake, Mississippi, June–August, 2015. The curves represent individual samples; the heavier curves represent the predicted values fitted with Equationequation 1(1)
(1) . In the temperature panel, the sample curves represent the 0.1-m data. DO = dissolved oxygen and ORP = oxidation–reduction potential. Turbidity, specific conductance, and nitrate are not shown because no diel patterns were detected.
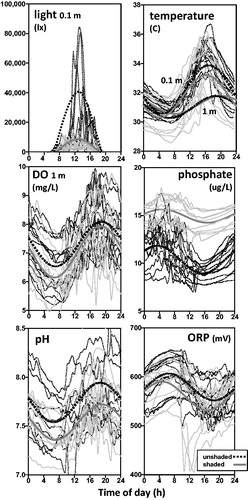
The DO concentrations fluctuated between 5 and 10 mg/L, were higher in unshaded sites, but otherwise followed a similar cycle in shaded and unshaded sites. DO peaked near 1800–1900 h, about the same time as 1-m temperature and 5 h after the light intensity peak. The lowest DO levels occurred near 0600–0700 h. In terms of solubility, dissolved oxygen saturation averaged 96.6% (minimum–maximum = 65.3–134.2) in shaded sites and 100.8% (69.2–138.1) in unshaded sites. Levels of pH ranged between 6.8 and 8.7, were higher in unshaded sites, peaked near 1800–1900 h, and like DO followed a similar cycle in shaded and unshaded sites. The ORPs ranged 407–655 mV, were higher in unshaded sites, and followed a pattern that was the reverse of the pH diel cycle. Concentrations of PO43- in unshaded sites were smaller and had sharper diel fluxes; levels peaked near 500 h and dipped to their lowest levels near 1700 h.
Discussion
The variables measured had lower values in shaded than unshaded sites, except phosphate, which was higher in shaded sites, and nitrate, turbidity, and specific conductance, which did not differ between shaded and unshaded sites. Light intensity underwater in shaded sites averaged less than 3000 lx, and was 6–7 times lower than in unshaded sites. Out of the water, light intensity in direct sunlight ranges 30,000–100,000 lx, and away from direct sunlight 10,000–20,000 lx (McCluney Citation2014). As expected, differences in light intensity were generally coupled with differences in other water quality variables, as light intensity directly or indirectly influences many processes. Reduced light intensity in shaded sites moderates temperature and increases solubility of oxygen, but at the same time hinders photosynthesis, which resulted in a net decrease in DO and reduced saturation in shaded sites. Increased photosynthesis in unshaded sites may be linked to the increased levels of pH, decreased levels of phosphate, and increased oscillation of phosphate. The simplest explanation is that during photosynthesis, aquatic plants remove carbon dioxide and phosphorus from the water. This can raise the pH and lower phosphate concentrations, particularly by late afternoon to early evening after a full day of photosynthetic activity, but additional complexities may also influence this pattern. Increased photosynthetic potential in unshaded sites also increased opportunities for low ORP (Marcus Citation1956; Falkowski and Raven Citation2013).
Most of the water quality metrics investigated exhibited distinct diel cycles but no seasonal trends over the 63-d study period during which length of day varied by less than 45 min. We suspect a seasonal trend does exists and is caused by a shift in the angle of the sun; however, this trend was concealed during the short study season by estimation variability produced by within and between daily cloud covers. Light intensity peaked near midday, and most other variables peaked in the afternoon and evening, several hours after the peak in light intensity. Exceptions were phosphate and ORP, which peaked in the early morning hours. This daily series of events is activated by the daily cycles in solar radiation that interact with cloud patterns, rain episodes, the water’s specific heat capacity, and biotic production/respiration to produce diel cycles that can vary greatly from day to day. Interestingly, while light intensity peaked simultaneously in shaded and unshaded sites, most other variables peaked 1–2 h earlier in shaded sites. This disparity in daily peaks between shaded and unshaded sites is precipitated by the inequality in light intensity, and the extent of the disparity likely varies seasonally as the angle of the sun and density of the leaf canopy change (Hill and Dimick Citation2002; Agafonkin Citation2009). Toward the end of a day it gets darker earlier in shaded sites, essentially resembling a shortening of the length of daytime by 1–2 h. Thus, in shaded sites, peaks and daytime distance between peaks tend to be lower. Moreover, timing and intensity of the peaks and dips of the diel cycles may depend on depth. Temperature at 1 m did not rise as high and peaked later than at 0.1 m, possibly lagged and moderated by suspended particles and specific heat.
The effects of shade on the water quality of the study reservoir were generally less pronounced than those observed in streams (Caissie Citation2006; Broadmeadow et al. Citation2011). In large lakes and reservoirs the water volume in the nearshore shaded band is small relative to the unshaded open water, even when the riparian zone is completely forested and the water body is highly dendritic. Lake and reservoir surface areas are usually dominated by unshaded open water and thus the shaded margin has only a small impact on whole-lake physicochemistry (Lauck et al. Citation2005). Moreover, through various mixing mechanisms (Wetzel Citation2001), the large open-water volume tends to neutralize effects of shading on water physicochemistry. As a result, riparian shade is not expected to have an extensive influence on whole-lake water quality in large lakes.
Nevertheless, shade plays a key role in the nearshore zone. Increased shade was shown in our study, and others reviewed by Pusey and Arthington (Citation2003), to reduce light penetration, water temperature, and dissolved oxygen and to impact various other water characteristics that together shape plant and animal distributions. Even small diel differences can alter growth and maturation rates of nearshore invertebrates if cumulative over a seasonal scale (Behmer and Hawkins Citation1986). Shade also enhances the diversity of aquatic habitats, which are less structured in unshaded open water. Many species show marked preference for certain light intensities, temperatures, or other water quality conditions. Light quality varies depending on extent of shade (Endler Citation1993), and consequently riparian areas support a diversity of light microhabitats. Species with different color patterns will be conspicuous or discreet under different shade levels (Helfman Citation1981), and thus shade may control their ability to survive predation or to attract mates. Differential availability of water quality microhabitats may allow the coexistence of the many species that support diverse aquatic systems. Vadeboncoeur et al. (Citation2011) reported that in a sample of 12 of the world’s largest natural lakes more than 80% of the fish species use the littoral zone. This percentage may be even higher in reservoirs, as their fish assemblages are a subset of a riverine assemblage adapted principally to shallow nearshore habitats. Thus, even if the shaded riparian zone represents only a small fraction of the water body, it can have a disproportionate role in maintaining integrity of a lake or reservoir ecosystem.
Shade affects water quality and in turn various properties of nearshore microhabitats. Managing shade involves the control of vegetative cover in the riparian band. Factors such as vegetation height (influences temporal and spatial extent of the shadow), overhang (influences extent of shadow at midday), density of vegetation and width of riparian band (influence light penetration through gaps), and shore orientation (determines when a shore is exposed to direct solar radiation) regulate shade availability. These factors can be controlled through programs that emphasize reforestation, diversity of native forest species, riparian management zones, no-cut buffers, thinning, and others. Many states have developed and published best management practices that address riparian zones in lakes and streams (reviewed by Blinn and Kilgore Citation2001), and evaluations have shown that they can enhance biotic communities (e.g., Wang et al. Citation2002). Nevertheless, these guidelines address shade management only indirectly and in generalities; additional research is needed to develop best management practices that address lake and reservoir shade more comprehensively.
Acknowledgments
We thank J. Boxrucker of the Reservoir Fish Habitat Partnership for assistance. A. Omer and H. Schramm provided helpful reviews. The Mississippi Cooperative Fish and Wildlife Research Unit is a cooperative effort of the Mississippi Department of Wildlife, Fisheries and Parks; Mississippi State University; and U.S. Geological Survey. Any use of trade, firm, or product names is for descriptive purposes only and does not imply endorsement by the U.S. government.
Additional information
Funding
References
- Agafonkin V. 2009. SunCalc-sun position, sunlight phases, sunrise, sunset, and dusk and dawn times calculator. SunCalc. Available from: suncalc.net.
- Behmer DJ, Hawkins CP. 1986. Effects of overhead canopy on macroinvertebrate production in a Utah stream. Freshwater Biol. 16(3):287–300.
- Beutel MW. 2003. Hypolimnetic anoxia and sediment oxygen demands in California drinking water reservoirs. Lake Reserv. Manage. 19(3):208–221.
- Blinn CR, Kilgore MA. 2001. Riparian management practices: a summary of state guidelines. J For. 99:11–17.
- Bourassa N, Cattaneo A. 2000. Responses of a lake outlet community to light and nutrient manipulation: effects on periphyton and invertebrate biomass and composition. Freshwater Biol. 44(4):629–639.
- Bowler DE, Mant R, Orr H, Hannah DM, Pullin AS. 2012. What are the effects of wooded riparian zones on stream temperature? Environ Evid. 1(1):3.
- Broadmeadow SB, Jones JG, Langford TEL, Shaw PJ, Nisbet TR. 2011. The influence of riparian shade on lowland stream water temperatures in southern England and their viability for brown trout. River Res Applic. 27(2):226–237.
- Brown GW, Krygier JT. 1970. Effects of clear-cutting on stream temperature. Water Resour Res. 6(4):1133–1139.
- Burton TM, Likens GE. 1973. The effect of strip-cutting on stream temperatures in the Hubbard Brook experimental forest, New Hampshire. BioScience. 23(7):433–435.
- Caissie D. 2006. The thermal regime of rivers: a review. Freshwater Biol. 51(8):1389–1406.
- Correll DL. 1997. Buffer zones and water quality protection: general principles. In: Haycock NE, Burt TP, Goulding KWT, Pinay G, editors. Buffer zones: their processes and potential in water protection. Proceedings of the International Conference on Buffer Zones. Harpenden: Quest Environmental; p. 7–20.
- Ebersole JL, Liss WJ, Frissell CA. 2003. Cold water patches in warm streams: physicochemical characteristics and the influence of shading. J Am Water Resources Assoc. 39(2):355–368.
- Endler JA. 1993. The color of light in forests and its implications. Ecol Monogr. 63(1):1–27.
- Falkowski PG, Raven JA. 2013. Aquatic photosynthesis. Princeton: Princeton University Press.
- Feller M. 1981. Effects of clearcutting and slashburning on stream temperature in southwestern British Columbia. J Am Water Resources Assoc. 17(5):863–867.
- Gjerløv C, Richardson JS. 2010. Experimental increases and reductions of light to streams: effects on periphyton and macroinvertebrate assemblages in a coniferous forest landscape. Hydrobiologia. 652(1):195–206.
- Helfman GS. 1981. The advantage to fishes of hovering in shade. Copeia. 1981(2):392–400.
- Hill WR, Dimick SM. 2002. Effects of riparian leaf dynamics on periphyton photosynthesis and light utilisation efficiency. Freshwater Biol. 47(7):1245–1256.
- Lauck B, Swain R, Barmuta L. 2005. Impacts of shading on larval traits of the frog Litoria ewingii in a commercial forest, Tasmania, Australia. J Herpetol. 39(3):478–486.
- Lowrance R, Altier LS, Newbold JD, Schnabel RR, Groffman PM, Denver JM, Correll DL, Gilliam JW, Robinson JL, Brinsfield RB, et al. 1997. Water quality functions of riparian forest buffers in Chesapeake Bay watersheds. Environ Manage. 21(5):687–712.
- Marcus RA. 1956. On the theory of oxidation-reduction reactions involving electron transfer. I. J Chem Phys. 24(5):966–978.
- McCartt AL, Lynch WE, Johnson DL. 1997. How light, a predator, and experience influence bluegill use of shade and schooling. Environ Biol Fish. 49(1):79–87.
- McCluney WR. 2014. Introduction to radiometry and photometry. Norwood: Artech House.
- Mosisch TD, Bunn SE, Davies PM, Marshall CJ. 1999. Effects of shade and nutrient manipulation on periphyton growth in a subtropical stream. Aquat Bot. 64(2):167–177.
- Mosisch TD, Bunn SE, Davies PM. 2001. The relative importance of shading and nutrients on algal production in subtropical streams. Freshwater Biol. 46(9):1269–1278.
- Naiman RJ, Latterell JJ. 2005. Principles for linking fish habitat to fisheries management and conservation. J Fish Biol. 67:166–185.
- Pusey BJ, Arthington AH. 2003. Importance of the riparian zone to the conservation and management of freshwater fish: a review. Mar Freshwater Res. 54(1):1–16.
- Vadeboncoeur Y, McIntyre PB, Vander Zanden MJ. 2011. Borders of biodiversity: life at the edge of the world's large lakes. BioScience. 61(7):526–537.
- Vander Zanden MJ, Vadeboncoeur Y, Chandra S. 2011. Fish reliance on littoral–benthic resources and the distribution of primary production in lakes. Ecosystems. 14(6):894–903.
- Wang L, Lyons J, Kanehl P. 2002. Effects of habitat best management practices on habitat and fish in Wisconsin streams. J Am Water Resources Assoc. 38(3):663–680.
- Wang L, Lyons J, Rasmussen P, Seelbach P, Simon T, Wiley M, Kanehl P, Baker E, Niemela S, Stewart PM. 2003. Watershed, reach, and riparian influences on stream fish assemblages in the northern lakes and forest ecoregion, U.S.A. Can J Fish Aquat Sci. 60(5):491–505.
- Wei A, Chow-Fraser P, Albert D. 2004. Influence of shoreline features on fish distribution in the Laurentian Great Lakes. Can J Fish Aquat Sci. 61(7):1113–1123.
- Wetzel RG. 2001. Limnology: lake and river ecosystems. Cambridge: Academic Press.