
Abstract
Hembre, LK. 2019. Effects of a rainbow trout stocking moratorium on the Daphnia species composition and water quality of Square Lake (Minnesota). Lake Reserv Manage. 35:127–139.
Square Lake is among the clearest lakes in the Minneapolis–St. Paul (Minnesota) metropolitan area, but its water clarity has decreased over the past several decades despite levels of total phosphorus (TP) remaining relatively stable. Predation by zooplanktivorous rainbow trout annually stocked since the early 1980s was hypothesized to be the cause for this eutrophication trend. To evaluate this hypothesis, a 3-year moratorium on trout stocking was imposed by the Minnesota Department of Natural Resources (MNDNR) and water quality and zooplankton monitoring data from 2 years prior to the moratorium (2010 and 2012) were compared to data from the 3 moratorium years (2013–2015). Significant changes observed during the moratorium years that support the hypothesis include (1) an increase in biomass concentrations of the large-bodied Daphnia pulicaria, (2) a coincident decrease in biomass concentrations of the smaller bodied D. mendotae, and (3) more pronounced spring clear-water phases when D. pulicaria reached peak densities. In addition, the volume of hypoxic water (dissolved oxygen [DO] < 1 mg/L) that developed in deep water was less in moratorium years compared to the premoratorium years. Unexpectedly, surface water TP concentrations were significantly lower during the moratorium years than in premoratorium years. Greater sequestration of P in the biomass of Daphnia during the moratorium years is the likely cause for the decrease in surface water TP levels in those years. Natural resource managers from the MNDNR have extended the moratorium and are using the conclusions from this study to determine the future fisheries management plan for Square Lake.
For lakes of a given nutrient condition, food web structure can significantly influence trophic state (Carpenter et al. Citation2001, Ellis et al. Citation2011). Specifically, when size-selective zooplanktivorous fish are abundant, they cause population densities of large-bodied zooplankton grazers to decrease (Brooks and Dodson Citation1965), phytoplankton biomass to increase (Mazumder Citation1994), and water clarity to diminish. High densities of zooplanktivorous fish can result from natural phenomena such as selective mortality of piscivorous fishes from winterkills that release zooplanktivores from predation (Hail and Ehlinger Citation1989), or strong year class survival of zooplanktivorous fish species that can persist for several years (Rudstam et al. Citation1993). Stocking or removal of certain fish species for food web research experiments (e.g., Shapiro and Wright Citation1984, Carpenter et al. Citation1985) or for promotion of angling opportunities (Lathrop et al. Citation2002, Hembre and Megard Citation2005) can also affect levels of zooplanktivory and the trophic state of lakes.
Water clarity of oligotrophic to mildly mesotrophic lakes is especially sensitive to top-down changes affecting phytoplankton biomass levels because Secchi disk transparency (SDT) increases exponentially as phytoplankton biomass decreases (Rast and Lee Citation1978) for chlorophyll a (Chl-a) values typical of those lakes (2–5 μg/L; Carlson Citation1977). Square Lake (Washington County, Minnesota) is an example of an oligotrophic/mesotrophic lake with water clarity sensitive to relatively small changes in phytoplankton biomass. The lake is ranked in the top 1% for SDT in the North Central Hardwood Forest ecoregion of Minnesota (Johnson Citation2017) and is highly valued for the recreational activities that its water quality provides (e.g., swimming at its public beach, canoeing, and scuba diving). However, monitoring data from the Minnesota Pollution Control Agency (MPCA) database show that its SDT has decreased by ∼2.5 m since the 1970s when average summer SDT was ∼7.5 m. While its clarity has declined, total phosphorus (TP) levels in the decades leading up to this study have remained consistent (median concentrations of surface water TP in the 1980s and 1990s were 10 µg/L and 11 µg/L in the 2000s, MPCA database). In fact, paleolimnological studies using diatom-based transfer functions (Ramstack et al. Citation2003, Ramstack et al. Citation2004) indicate that TP levels have not changed significantly since 1800 (i.e., before European settlement). In addition, other studies (Doneux Citation2002, Plevan and Hembre Citation2012) that have investigated potential causes for the lake’s declining water clarity have not identified significant sources of nutrient pollution that could be causing the eutrophication trend.
The lack of evidence for bottom-up forces causing the eutrophication trend in Square Lake implies that top-down mechanisms may be responsible. Specifically, predation on large-bodied Daphnia (D. pulicaria, Forbes 1893) by rainbow trout (Oncorhynchus mykiss, Walbaum 1792), annually stocked from 1981 to 2012 by the Minnesota Department of Natural Resources (MNDNR), has been identified as a possible cause for the trend. A diet study of potential vertebrate and invertebrate predators in the lake (Plevan and Hembre Citation2012) found that rainbow trout consumed significantly more D. pulicaria per capita than any other predator, a result consistent with findings of other studies (Geist et al. Citation1993, Wang et al. Citation1996, Hembre and Megard Citation2005). In the diet study, bluegill sunfish (Lepomis macrochirus, Rafinesque 1810) were the only predator other than rainbow trout found to be consuming Daphnia (Daphnia mendotae, Birge 1918, and D. pulicaria). However, none of the bluegills sampled that were <15 cm in length preyed on Daphnia (of either species), and the larger bluegills that did prey on Daphnia mostly consumed D. mendotae (only 5 of the 111 bluegills sampled had D. pulicaria in their gut contents). While the diet study showed that D. pulicaria were the main constituent of the rainbow trout diet and that trout consumed many more D. pulicaria per capita than any other predator surveyed, the finding that some of the large bluegills did prey on D. pulicaria raised the possibility that an abundance of large bluegills (>15 cm) preying on D. pulicaria could be responsible for the eutrophication trend observed in the lake. To evaluate this possibility, the MNDNR performed a targeted fisheries survey in 2012 (https://www.dnr.state.mn.us/lakefind) to assess whether there was evidence of large year classes of big bluegills (>15 cm) in the lake. The survey determined that the age structure and size of the bluegill population in 2012 did not differ appreciably from population surveys performed in the 1980s. Therefore, the MNDNR concluded that bluegill predation was not likely to be causing the D. pulicaria population to be suppressed.
Given the evidence implying that predation by rainbow trout on the D. pulicaria population could be responsible for the eutrophication trend in Square Lake, a 3-year trout stocking moratorium was enacted by the MNDNR in the fall of 2012 so that the impact of rainbow trout predation could be more conclusively evaluated. The effects of the moratorium on the lake’s Daphnia populations and its water quality are evaluated here by comparing data from moratorium years (2013–2015) to data from 2 years prior to the moratorium (2010 and 2012) in which comparable data were obtained. Compared to the premoratorium years, we expected to find (1) greater biomass concentrations for large-bodied Daphnia (D. pulicaria), especially during spring months because D. pulicaria would have been free from trout predation over winter (Hembre and Megard Citation2005), (2) more pronounced spring clear-water phases (Luecke et al. Citation1990) resulting from higher levels of D. pulicaria, and (3) improvement in the lake’s trophic state indicators (i.e., lower Chl-a concentrations, greater SDT, and less hypoxia in deep water because clear-water conditions in spring would cause less deposition and decomposition of organic matter). Lastly, given historical data on TP levels, we did not expect TP concentrations to differ between the premoratorium and moratorium years. P loading from unexpected pollution events could potentially promote more eutrophic conditions and confound the interpretations of top-down effects of the trout stocking moratorium.
Study site
Square Lake (Washington County, Minnesota: 4509.40'N; 9248.26'W) is a relatively deep (maximum depth = 20.7 m, mean depth = 9 m) seepage lake (70% groundwater, 30% drainage) with a volume of 6.95 × 10⁶ m3, surface area of 81.9 ha, and a small watershed to lake area ratio (2.8; Ramstack et al. Citation2004). The lake’s meso-oligotrophic water quality and its depth provide suitable habitat during summer stratification for rainbow trout that require cold (<21 C), well-oxygenated (>5 mg/L) water (Wang et al. Citation1996). Square Lake was managed as a 2-story fishery by the MNDNR between 1981 and 2012, during which yearling rainbow trout (∼28 cm length) were regularly stocked at a rate of 5000/yr (2000 in the fall and 3000 in the spring). Since rainbow trout stocked in Square Lake lack access to streams with appropriate spawning habitat, there is no natural reproduction by the trout in the lake. In addition to the lack of natural reproduction, several pieces of evidence suggest that there is little survival of trout in the lake from one year to the next. This evidence includes (1) sonar surveys of Square Lake in 2004 and 2005 (Hembre Citation2006) that estimated that relatively few of the trout stocked in a given year were present by the end of the open-water season (<5% in 2004 and <20% in 2005), (2) a creel census performed by the MNDNR in 2004 (Gorton Citation2004) that was consistent with the findings of the 2004 sonar survey, in that anglers caught substantially fewer trout in the latter months of the open water season (September–October) compared to summer months, and (3) a fisheries survey performed by the MNDNR in 2014 (the second year of the trout stocking moratorium) that found no rainbow trout in gill net and trap net samples (https://www.dnr.state.mn.us/lakefind). Therefore, Square Lake is considered to be a “put and take” trout fishery, with the number of trout in the lake determined by the number of fish stocked and mortality from angling and from natural sources.
Evidence suggesting that rainbow trout predation may be responsible for the decline in the lake’s water clarity (Plevan and Hembre Citation2012) led the MNDNR to develop an agreement with the Carnelian-Marine-St. Croix Watershed District (CMSCWD) in which a 3-year moratorium on the stocking of rainbow trout (from 2013 to 2015) was established so that the effects of trout predation on the lake’s zooplankton community composition and its water quality could be more conclusively evaluated.
Materials and methods
Zooplankton sampling and enumeration
Zooplankton were sampled (with a closing-style zooplankton net: diameter = 30 cm, mesh size = 80 μm) over a similar range of dates for all years of the study. Each year, the lake was first sampled in April or May (depending on ice-out date), and thereafter on a monthly or twice-monthly basis through September. The number of sampling dates and number of locations sampled on a given date differed somewhat between the premoratorium years (2010 and 2012) and the moratorium years (2013–2015) due to the availability of research funding. Zooplankton were sampled on 9 dates in 2010 (twice-monthly during May–August and once in September), 6 dates in 2012 (monthly during April–September), and roughly every 2 weeks from the beginning of the open-water season (mid April or early May depending on the ice-out date) through September during the moratorium years (10 dates in 2013 and 2014, and 11 dates in 2015). For all dates, duplicate whole water column samples were collected while anchored at the deepest area in the middle of the lake (water depth = 20 m). Additional duplicate whole water column samples were collected from 2 other locations (1 in the eastern end and 1 in the western end of the lake where water depths are 13 m) on the first 3 sampling dates in 2010 (6 May, 18 May, and 8 June) and all sampling dates during the moratorium years (2013–2015). For all sampling dates, duplicate samples were also collected from four incremental depth ranges to enable us to evaluate whether the Daphnia species composition varied among depths, and whether any changes in depth distribution of the 2 species occurred after the trout stocking moratorium was imposed. When the lake was thermally stratified, the shallowest incremental depth samples were taken from the epilimnion, with the other 3 discrete depth samples taken from the upper metalimnion, the lower metalimnion, and the hypolimnion. Zooplankton samples collected were preserved in the field with 70% ethanol and refrigerated until they were processed in the laboratory at Hamline University.
In the laboratory, zooplankton samples were filtered through an 80 μm mesh, and zooplankton retained on the mesh were diluted with tap water into beakers to an appropriate volume for counting. Each sample was mixed to randomly distribute zooplankton and mixed samples were then subsampled with a Hensen–Stempel pipette. Zooplankton in three 5 mL subsamples were taxonomically identified and counted using a counting wheel and a Leica MZ 125 dissecting microscope. Body lengths of 15–25 individuals of each Daphnia taxon from whole water column tows at the central location were measured to the nearest 0.021 mm with the optical micrometer on the dissecting microscope. Biomasses (dry mass) for the 2 Daphnia species (D. pulicaria and D. mendotae) were computed from body length with empirical regression equations (Bottrell et al. Citation1976).
Water quality sampling and analysis
For all dates when zooplankton were sampled, depth profiles of temperature and dissolved oxygen (DO) were obtained at the deepest sampling location with a YSI ProODO dissolved oxygen meter, and water clarity was measured with a Secchi disk. In addition, during the moratorium years, 1 L of surface water was collected and filtered (0.45 μm pore size glass-fiber filter) for subsequent determination of Chl-a concentration, and duplicate 50 mL samples of surface water were collected for analysis of TP concentration. Filters for Chl-a and water samples for TP analysis were transported on ice to the lab at Hamline University and stored in a −20 C freezer. Frozen samples were transferred to the Metropolitan Council Environmental Service (MCES) laboratory within 50 d of collection for analysis. The MCES laboratory uses American Society for Testing and Materials (ASTM) method D3731–87 with acetone for pigment extraction to analyze samples for Chl-a, and U.S. Environmental Protection Agency (EPA) Method 365.4 for TP (Johnson Citation2017). In 2010 and 2012, sampling for Chl-a and TP, using the same methodology already described, was done by staff of the Washington County Conservation District (WCCD) every 2 weeks during the open-water season as part of the Metropolitan Council’s Citizen-Assisted Monitoring Program (CAMP). Water quality data that we and the WCCD obtained were annually submitted to the MPCA’s Environmental Quality Information System (EQuIS) database. In addition to these data, supplemental data for SDT collected through the MPCA’s Citizen Lake Monitoring Program (CLMP) is included in the data set analyzed for this study. Secchi depth data that we and others (i.e., CAMP, CLMP) obtained that were within 2 d of each other were averaged together prior to incorporation into statistical analyses to avoid overemphasizing measurements from the same time period.
Data analyses
Dissolved oxygen data from depth profiles and water volumes for various depth ranges in the lake were used to calculate the volume of hypoxic water (DO ≤ 1 mg/L) present on each sampling date. The mass of P in the mixed layer of the lake was estimated by multiplying the volume of the mixed layer by the surface water TP concentration. The mean dry masses of the 2 Daphnia species were multiplied by 1.5%, an intermediate value for the percent P composition of Daphnia (Acharya et al. Citation2004), to estimate the mass of P held in Daphnia biomass. These values were multiplied by population biomass concentrations from whole water column samples, and then by the whole lake volume to obtain estimates of the mass of P in Daphnia biomass on each sampling date.
Since the main objective of this study was to evaluate the effect of the rainbow trout stocking moratorium on the lake’s Daphnia populations and its water quality, most of the figures and statistical analyses emphasize comparisons between the premoratorium years (2010 and 2012) and the moratorium years (2013–2015) by time of year (month). The number of sampling dates for a given year in April and May differed based on ice-out date, so data from those months are grouped into a single category to allow for statistical comparisons among years for the spring months. When more than 1 site was sampled on a given date, data for whole water column biomasses of Daphnia were averaged across sites so that each date had single values for D. mendotae and D. pulicaria biomass concentrations. Two-factor analyses of variance (ANOVAs) were used to evaluate the effect of the trout moratorium and time of year (month) on the biomass concentrations of the 2 Daphnia species, Chl-a concentration, TP concentration, and SDT. Data for SDT were normally distributed, but data for the other variables (Daphnia biomass concentrations, Chl-a, and TP) were log10-transformed prior to statistical analysis to normalize those data. A 2-factor ANOVA was not performed to analyze results for hypoxic volume due to differences among years in the timing of ice-out. Instead, those results are only presented graphically (means ± se). A Bonferroni correction was used to minimize type I errors in the assessment of statistically significant p values, given that multiple tests were performed. There is a total of 16 p values associated with the statistical analyses that were performed, so the threshold for statistical significance for α = 0.05 using the Bonferroni correction is 0.05/16 = 0.0031. Statistical analyses were performed using the statistical package R (R Core Team Citation2014).
Results
Daphnia species composition and distribution by depth
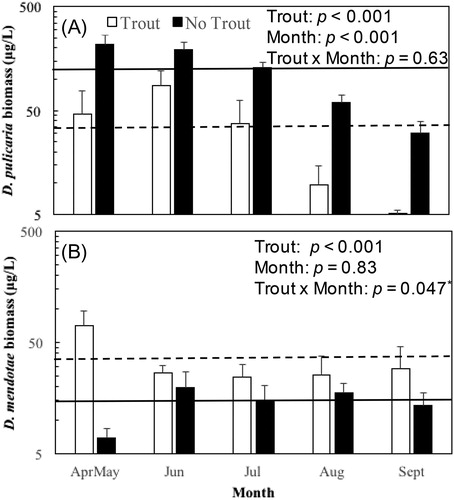
Changes in biomass concentrations and the relative composition of the 2 Daphnia species (D. pulicaria and D. mendotae) were consistent with the expectation that biomass concentrations of the larger-bodied species (D. pulicaria) would be greater during the trout moratorium years than in years when trout were stocked to the lake (). Two-factor ANOVAs were used to examine how the log10 biomass concentrations of the 2 Daphnia species were affected by the presence (2010 and 2012) or absence (2013–2015) of trout, while accounting for the time of year (month). The mean biomass of D. pulicaria () was significantly greater during the moratorium years (trout effect: F4, 36 = 31.6, p < 0.001) and was greater in earlier months of the open-water season than in August–September (month effect: F4, 36 = 12.4, p < 0.001) for both the trout years and the moratorium years (trout × month interaction: F4, 36 = 0.605, p = 0.630). Daphnia mendotae mean biomass () was significantly lower during the moratorium years (trout effect: F4, 36 = 23.0, p < 0.001), but did not differ significantly across months (month effect: F4, 36 = 0.361, p = 0.830). The result for the trout × month interaction (F4, 36 = 2.68, p = 0.047) suggests that the seasonal pattern of D. mendotae biomass differed between trout years and moratorium years, but that result does not meet the threshold for statistical significance with the Bonferroni adjustment. In the premoratorium years, biomass concentrations of the 2 species were relatively similar to each other overall () but differed seasonally, with D. pulicaria having higher biomass concentrations than D. mendotae during April–July and D. mendotae having greater biomass levels in August–September compared to D. pulicaria. In contrast, during the moratorium years, D. pulicaria was the dominant species across all months.
Figure 1. Mean biomass concentrations (± se) by month for (A) Daphnia pulicaria and (B) D. mendotae in whole water column samples for years when trout were stocked (white bars) and moratorium years when trout were not stocked (black bars). Horizontal lines (dashed for trout years, solid for moratorium years) are grand means across all month periods. Two-factor ANOVA p values for main effects (trout, month) and the interaction between trout and month on log10 biomass are included in each panel (asterisk for the D. mendotae trout × month p value indicates that that p value did not meet the statistical significance threshold after application of the Bonferoni correction). Data are plotted on logarithmic scale.
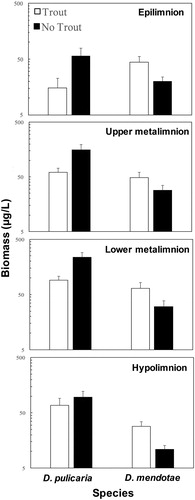
Daphnia biomass data from discrete depth samples (epilimnion, upper metalimnion, lower metalimnion, and hypolimnion) show that D. mendotae had a relatively even distribution within the water column, while concentrations of D. pulicaria were greatest in the upper and lower metalimnion (). Consistent with the results for whole water column biomass (), biomass concentrations of D. pulicaria increased markedly during the moratorium years and were greater than those for D. mendotae for all depths, including the epilimnion where D. mendotae levels were greater during premoratorium years (, top panel).
Figure 2. Mean biomass concentrations (± se) for Daphnia pulicaria and D. mendotae in discrete depth samples between trout years and moratorium (no trout) years. Daphnia pulicaria biomass concentrations increased substantially during the moratorium (particularly in the upper and lower metalimnion sampling depths), while D. mendotae biomass levels decreased at all depths during the moratorium. Data plotted on logarithmic scale.
Trophic state indicators
The expectations that the mean SDT () of Square Lake would be significantly greater during moratorium years compared to years when trout were stocked, and that SDT would be highest in April–May were supported (trout effect: F1, 129 = 9.48, p = 0.0025; month effect: F4, 129 = 9.14, p < 0.001). Also consistent with expectations, mean levels of phytoplankton biomass (log10 Chl-a) in surface water were lower during the moratorium for all months (). However, the difference between the trout stocking years and moratorium years was not statistically significant after applying the Bonferroni correction (trout effect: F1, 45 = 4.85, p = 0.033: Bonferroni threshold p value = 0.0031). As with the SDT results, mean log10 Chl-a concentrations were significantly lower in earlier months of the open-water season compared to later months in both the premoratorium years and the moratorium years (month effect: F4, 45 = 5.86, p < 0.001).
Figure 3. Mean levels (± se) for trophic state indicators (SDT, Chl-a, hypoxic volume, and TP) by month for years when trout were stocked (white bars) and moratorium years when trout were not stocked (black bars). Horizontal lines (dashed for trout years, solid for moratorium years) are grand means across all month periods. Two-factor ANOVA p values for main effects (trout, month) and the interaction between trout and month are included on the panels for SDT, Chl-a, and TP. The asterisk on the trout effect p value for Chl-a indicates that that p value did not meet the statistical significance threshold after application of the Bonferoni correction. Note that the y-axis scale is logarithmic for Chl-a (panel B) and TP (panel D).
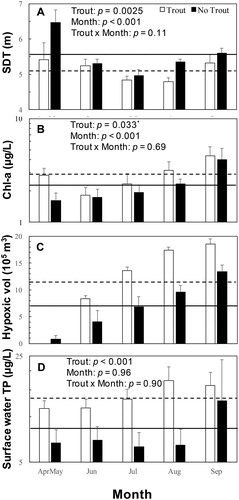
The expected effect of the trout stocking moratorium on hypoxic volume (another trophic state indicator) was also observed in that the mean volume of hypoxic water was lower during the moratorium years compared to years when trout were stocked (). While this result supports expectations, some caution in the interpretation of these data is warranted because DO levels in deep water were also affected by variability among years in the timing of ice-out and the degree to which the water column circulated in the spring. Seasonal patterns of DO stratification were similar between the 2 premoratorium years, in which ice-out was relatively early (early April in 2010 and late March in 2012) and the water column became fully oxygenated during spring mixing. In those 2 years, the deep water began to become hypoxic (DO < 1 mg/L) by early June and the volume of hypoxic water increased to nearly 18 × 105 m3 by September (). Among the moratorium years (2013–2015), patterns of DO stratification were not as similar to each other as they were for the 2 premoratorium years. Compared to the premoratorium years, ice-out was very late in 2013 (3 May), moderately late in 2014 (22 April), and similar (1 April) in 2015. For 2 of the 3 moratorium years (2014 and 2015) the water column fully mixed prior to summer stratification, but the late ice-out in 2013 that was followed by a rapid warm up later in May that year inhibited full circulation of the water column prior to the onset of summer stratification. On 5 May 2013 (2 days after ice-out), water temperatures were nearly uniform from top to bottom, but the lake had not yet mixed (DO levels at depths below 14 m were still <1 mg/L). By the 20 May 2013 sampling date, some oxygenation of the deep water had occurred, but levels below 16 m were still very low (<1 mg/L). The incomplete oxygenation of the deep water in the spring of 2013 is the reason that mean hypoxic volume during April–May of the moratorium years was greater than that for the premoratorium years when the water column fully circulated (). However, even with the anomaly of 2013 in which the water column did not become fully oxygenated in the spring, the extent of hypoxia in the moratorium years was substantially less (other than for April–May) than in premoratorium years ().
While results for Chl-a (), SDT (), and hypoxic volume () support the prediction that the trout moratorium would lead to less eutrophic conditions in the lake, results for TP concentrations in surface water were unexpected. The mean log10 TP concentration in surface water () was significantly lower during the moratorium years (trout effect: F1, 45 = 22.3, p < 0.001) compared to the moratorium years across all months (month effect: F4, 45 = 0.150, p = 0.962; trout × month interaction: F4, 45 = 0.260, p = 0.902).
Phosphorus in Daphnia biomass
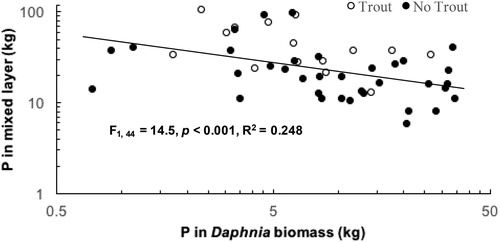
The log10 mass of P in the mixed layer was regressed against the log10 mass of P in the biomass of Daphnia to evaluate whether the increased standing biomass of Daphnia observed during the moratorium years, driven by increases in D. pulicaria (), could be responsible for the decrease in TP levels in surface water () during the moratorium. The linear regression shows a significant negative relationship (F1, 44 = 14.5, p < 0.001, R2 = 0.248) indicating that the mass of P in mixed layer decreases as P in Daphnia biomass increases (). Examination of data for the mean mass of P in the mixed layer and the mean mass of P in Daphnia biomass by month indicates that increases in P in Daphnia biomass during the moratorium years were substantial and account for large percentages of the decreases in P in the mixed layer during April–May (9.7 kg increase in Daphnia P mass, 58% of the decrease of P in the mixed layer), June (10.5 kg, 85%), and July (8.8 kg, 36%), but relatively small quantities and percentages during August (4.4 kg, 18%) and September (1 kg, 3%).
Figure 4. TP in mixed layer versus P in Daphnia biomass (plotted on log scale). White circles are from dates in premoratorium years and black circles are from dates in moratorium years. The simple linear regression of log10 mass of P in the mixed layer versus log10 mass of P in Daphnia biomass shows that mixed layer P mass decreased significantly as P in Daphnia biomass increased (F1, 44 = 14.5, p < 0.001, R2 = 0.248).
Discussion
The changes in the biomass of Square Lake’s Daphnia populations support expectations for the hypothesized effects of the rainbow trout stocking moratorium. In the moratorium years (2013–2015) when trout were not stocked to the lake, the larger-bodied Daphnia (D. pulicaria) had significantly higher biomass than in the premoratorium years (2010 and 2012), while biomass of the smaller-bodied species (D. mendotae) decreased (). The finding that D. pulicaria had lower biomass levels during premoratorium years is consistent with results of other studies that have shown that size-selective predation by rainbow trout can negatively affect the growth of large-bodied Daphnia populations (Geist et al. Citation1993, Hembre and Megard Citation2005).
Two potential mechanisms could explain the decreased biomass levels of D. mendotae observed during the moratorium years. One is that invertebrate predators (e.g., Chaoborus, Leptodora) may have become more abundant during the moratorium years when levels of zooplanktivory by fish likely decreased, and selective predation by the invertebrate predators on smaller-bodied zooplankton could have caused D. mendotae levels to decrease. While others have documented this mechanism (e.g., Dodson Citation1974, Hanazato and Yasuno Citation1989), analyses of zooplankton samples collected through the course of this monitoring study (data not shown) do not indicate significant changes in the abundances of any of the invertebrate predators in Square Lake (including Chaoborus, Leptodora, and Hydracarina water mites). The second mechanism that could explain the decrease in D. mendotae biomass levels during the moratorium years (when D. pulicaria biomass increased) is the size efficiency hypothesis (Brooks and Dodson Citation1965), which predicts that smaller bodied grazers will become less abundant when levels of size-selective predation are low because they are inferior competitors to larger bodied grazers (Gliwicz and Pijanowska Citation1989). This possible competition effect was particularly apparent in the spring months, during which mean D. mendotae biomass was markedly lower in moratorium years when D. pulicaria biomass was at its maximum (). The expanded spatial distribution of D. pulicaria into shallower water (greater biomass in samples from the epilimnion and upper metalimnion, ) during the moratorium years when the population was not subject to predation by rainbow trout provides additional evidence consistent with findings of the other research on the competitive interactions between D. pulicaria and D. mendotae under different predation regimes. In an experimental enclosure study, Leibold and Tessier (Citation1991) found that the risk of predation by bluegill sunfish in the epilimnion and competition between the 2 Daphnia species controlled habitat segregation patterns for the Daphnia species. When bluegills were present, D. mendotae (the species less susceptible to fish predation) was more abundant in the epilmnion than the more vulnerable D. pulicaria. In the absence of bluegill predation, however, D. pulicaria (the superior exploitative competitor) markedly expanded its distribution into the epilimnion and levels of D. mendotae were suppressed.
The maximal biomass of D. pulicaria during April–May of moratorium years () promoted more prominent spring clear-water phases (Lampert et al. Citation1986, Luecke et al. Citation1990) during which phytoplankton biomass (Chl-a) in surface water was lower () and SDT was significantly greater (). Lower concentrations of Chl-a in the springtime during the moratorium years would likely have resulted in less deposition and subsequent decay of organic matter in deep water in those years. Indeed, the extent to which the deep water became hypoxic (DO ≤ 1 mg/L) during summer stratification was less for the moratorium years compared to the premoratorium years (). Decreased hypoxia in deep water is indicative of less eutrophic conditions (Smith et al. Citation2006) and is also important to the survival of large-bodied Daphnia that migrate into deep water during the daytime to avoid visual predators (Zaret and Suffern Citation1976).
Daphnia pulicaria require oxygen levels greater than ∼1 mg/L for survival (Weider and Lampert Citation1985, Wright and Shapiro Citation1990, Larsson and Lampert Citation2011), and because they migrate into deep water during the daytime to avoid predation, the depletion of oxygen in the hypolimnion decreases the size of their deep-water refuge zone (Tessier and Leibold Citation1997, Hembre and Megard Citation2003). Therefore, when spring clear-water phases are more pronounced due to Daphnia grazing, there would be less algal deposition to sediments in the early part of the stratified season, and oxygen would likely persist at higher levels in deep water later into the summer, providing more refuge habitat for migrating Daphnia. In turn, the greater persistence of deep-water habitat enables large-bodied Daphnia populations to maintain higher population densities and to exert greater grazing control on phytoplankton in late summer than when spring clear-water phases are inhibited. In this study, D. pulicaria biomass concentrations were greater in late summer of the moratorium years () that experienced stronger clear-water phases in the spring () and less hypoxia in the deep water in late summer (). The greater mean SDT observed in August of the moratorium years () may therefore have been promoted by the grazing effect of the more abundant D. pulicaria.
Though the majority of this study’s results fit with expectations, the significant decrease in surface water TP levels during the moratorium years () was unexpected. Given that evidence from historical monitoring data (MPCA database) and diatom-inferred sediment core data from the lake dating back to pre-European settlement (Ramstack et al. Citation2004) indicates that the P status of Square Lake has not changed appreciably through time, we did not anticipate finding systematic differences in TP levels between the premoratorium and moratorium years. A likely explanation for the decrease in surface water TP in the moratorium years is that substantially more P was held in D. pulicaria biomass () in moratorium years compared to premoratorium years. Daphnia are known to homeostatically maintain higher P levels in their bodies (Elser et al. Citation1996, Sterner and Elser Citation2002, DeMott and Pape Citation2005) than other zooplankton (e.g., copepods). When the standing biomass of Daphnia is high they may exert dual control on phytoplankton biomass through grazing, and through nutrient limitation via P sequestration in their bodies (Elser et al. Citation2000). In a whole-lake manipulation experiment (Elser et al. Citation2000), the stocking of northern pike (Esox lucius) to Lake 227 (Experimental Lakes Area, Canada) caused a trophic cascade that resulted in a dramatic increase in the population biomass of D. pulicaria and great reduction in phytoplankton biomass. As a result, zooplankton biomass that accounted for less than 1% of the P pool in the epilimnion of Lake 227 before the manipulation increased to more than 30% of the epilimnetic P pool after the manipulation when D. pulicaria biomass was at its peak. The significant negative relationship observed in this study between the mass of P in the mixed layer and the P mass in Daphnia biomass () suggests that the same phenomenon seen by Elser et al. (Citation2000) may be responsible for the decrease in TP in the surface water of Square Lake () after the rainbow trout moratorium was imposed. As described in the Results, the increased mass of P in Daphnia biomass accounted for substantial quantities of the decreased mass of P in the mixed layer during the moratorium for April–July, but less so for August and September.
While sequestration of P in Daphnia biomass is a likely explanation for the decreased levels of TP observed during the moratorium years (), other mechanisms warrant consideration. One potential alternative explanation is that benthic feeding by trout and subsequent excretion of P into surface water could have contributed to the higher levels of surface water P that were observed during the premoratorium years. However, given the habitat constraints (temperature < 21 C and DO > 5 mg/L; Wang et al. Citation1996) for rainbow trout, it is unlikely that the trout acted as substantial conveyors of P to surface water (Vanni Citation2002). Summer stratification would have precluded trout from foraging on benthos (once DO levels decreased to <5 mg/L in deep water), and from moving into surface waters (when temperatures increased to >21 C). The possible exception to this would have been during early spring when the water column would have been sufficiently cold and well-oxygenated for the trout to move throughout it. Another alternative explanation for why TP levels decreased during the moratorium years is that no P from rainbow trout biomass was added to the lake in those years. Fish added to lakes (by natural immigration or by stocking) have the potential to be sources of nutrients if they experience negative growth or die and decay in the new ecosystem, but may act as nutrient sinks if they have positive growth and subsequently leave the ecosystem through emigration or harvesting by anglers (Vanni et al. Citation2013). While in situ mortality and decay of fish stocked to lakes would add P and other nutrients to those ecosystems, fish carcasses do not decompose completely and the extent to which nutrients in fish carcasses are mineralized depends on a variety of factors (e.g., water temperature, depth at which carcasses are deposited in sediments; Chidami and Amyot, Citation2008). To estimate the contribution of P to Square Lake from the stocking of rainbow trout, the number of fish stocked, their mass, and the percent of their mass comprised of P were considered. During each of the premoratorium years, 5000 yearling rainbow trout of 28 cm in length (wet mass = 96 g, from length–weight regression from Sharma and Bhat Citation2015) were stocked, amounting to an annual addition of ∼480 kg of trout per year. Based on the dry mass:wet mass ratio (17%) and the percent of dry mass comprised of P (2.2%) for rainbow trout (Hendrixson et al. Citation2007), stocking that quantity of trout would add ∼1.8 kg of P to the lake in the biomass of trout on an annual basis. That value (1.8 kg) would therefore be the maximum quantity of P annually loaded to the lake through trout stocking if all of the trout that were stocked died and fully decomposed. However, the actual quantity of P loaded to the lake would very likely be less than that given removal of the trout by angler harvesting and incomplete decomposition of trout that may die in the lake. Compared to the estimates for the increased mass of P held in Daphnia biomass in Square Lake during the moratorium years, which ranged from 1 kg in September to 10.5 kg in June, the addition of ≤ 1.8 kg of P from stocked trout during the premoratorium years is relatively trivial.
Management implications
The stocking of nonnative fishes has multiple potential effects of on the ecology of lakes (Eby et al. Citation2006). These effects include altering food web structure (Knapp et al. Citation2005) and inducing trophic cascades (Sarnelle and Knapp Citation2005), altering the distribution of nutrients between littoral and pelagic environments within a lake due to foraging behaviors of the stocked fish (Vanni Citation2002), and causing reductions in algal biomass through P-limitation associated with shifts in zooplankton community composition (Findlay et al. Citation2005). Given the many and varied impacts that stocking different species of fish have on the ecology of lakes, natural resource managers must carefully weigh the benefits of providing enhanced opportunities for anglers with potential negative consequences of stocking (e.g., decreased water clarity).
Rainbow trout are one of the most often introduced species of fish to lakes worldwide (Stanković et al. Citation2015), and are also a species that is commonly stocked in Minnesota lakes. Most of the approximately 100 lakes in Minnesota stocked with rainbow trout are in the northeastern part of the state, but some (including Square Lake) are located in the southern third of the state. As shown in this study and others (Geist et al. Citation1993, Hembre and Megard Citation2005), rainbow trout have the potential to cause top-down effects that promote more eutrophic conditions in lakes to which they are stocked. Another important issue for managers of lakes in Minnesota and elsewhere to consider is that climate warming will likely affect the sustainability of stocking rainbow trout. One of the expected effects of warming in temperate climates is greater depletion of hypolimnetic oxygen concentrations during the summer as a result of earlier ice-out dates (Mishra et al. Citation2011), earlier onset of thermal stratification in the spring, and more stable summer stratification (Stefan et al. Citation1996, Jankowski et al. Citation2006). This phenomenon is especially relevant for the management of rainbow trout in Square Lake and other lakes in the southern portion of Minnesota with a warmer climate than northeastern Minnesota, since lower levels of DO in the hypolimnion would decrease the habitat availability for rainbow trout that require cold (<21 C), well-oxygenated water (DO > 5 mg/L, Wang et al. Citation1996) and the refuge habitat for Daphnia that require DO > 1 mg/L (Wright and Shapiro Citation1990).
This study shows that the cessation of stocking rainbow trout in Square Lake allowed the lake’s D. pulicaria population to reach higher biomass concentrations () and that this promoted less eutrophic conditions (lower Chl-a, higher SDT, lower TP in surface water, and less hypoxia in deep water) during the moratorium years compared to premoratorium years. On the basis of these findings the MNDNR has extended the moratorium on trout stocking in the lake since the completion of this study, but a long-term course of action for the management of the lake has not yet been determined. Permanent termination of the rainbow trout stocking program is likely the surest way to protect the lake’s water quality by enabling the D. pulicaria population to attain maximal population sizes. However, there are stakeholders who would like the MNDNR to resume trout stocking to provide a trout angling opportunity in the lake. Thus, another management option under consideration is to resume stocking trout in the spring, but not in the fall. A study of a lake in northwestern Minnesota (Long Lake, Clearwater County) showed significant increases in D. pulicaria densities and SDT after there was a switch from fall stocking to spring stocking of rainbow trout. That study concluded that when the D. pulicaria population was free from trout predation over winter it was able to build up a large “seed” population that grew exponentially after ice-out, and that predation by trout stocked during the spring had little impact on the D. pulicaria population growth (Hembre and Megard Citation2005). While this alternative (spring stocking only) may better protect water quality than stocking in the fall and spring, it is not presently known what the water quality outcomes for that strategy would be compared to ceasing stocking altogether.
Acknowledgments
I am grateful to the students (Dan Carlson, Tim Olson, Alina Burks, Lance Hentges, Sophia Tracy, Jalen Hoehn, August Henneck, Gardea Simoke, Chris Conley, and Josephine Kent) who collaborated with me in the field and the laboratory for this project. I am also grateful to Frank Shaw for his advice on statistical issues, to Meghan Jacobson and Andrea Plevan of Emmons and Olivier Resources, and to Jodie Hirsch and Ray Valley from the MNDNR for their help in developing the scope of this study.
Additional information
Funding
References
- Acharya K, Kyle M, Elser JJ. 2004. Biological stoichiometry of Daphnia growth: an ecophysiological test of the growth rate hypothesis. Limnol Oceanogr. 49(3):656–665.
- Bottrell HH, Duncan A, Gliwicz ZM, Grygierek E, Herzig A, Hillbricht-Ilkowska A, Kurasawa H, Larson P, Weglenska T. 1976. A review of some problems in zooplankton production studies. Norw J Zool. 24:419–456.
- Brooks JL, Dodson SI. 1965. Predation, body size, and composition of plankton. Science. 150(3692):28–35.
- Carlson RE. 1977. A trophic state index for lakes. Limnol Oceanogr. 22(2):361–369. doi:10.4319/lo.1977.22.2.0361.
- Carpenter SR, Kitchell JF, Hodgson JR. 1985. Cascading trophic interactions and lake productivity. BioScience. 35(10):634–639.
- Carpenter SR, Cole JJ, Hodgson JR, Kitchell JF, Pace ML, Bade D, Cottingham KL, Essington TE, Houser JN, Schindler DE. 2001. Trophic cascades, nutrients, and lake productivity: whole-lake experiments. Ecol Monogr. 71(2):163–186. doi:10.1890/0012-9615(2001)071[0163:TCNALP.2.0.CO;2]
- Chidami S, Amyot M. 2008. Fish decomposition in boreal lakes and biogeochemical implications. Limnol Oceanogr. 53(5):1988–1996.
- DeMott WR, Pape BJ. 2005. Stoichiometry in an ecological context: testing for links between Daphnia P-content, growth rate and habitat preference. Oecologia. 142(1):20–27.
- Dodson SI. 1974. Zooplankton competition and predation: an experimental test of the size-efficiency hypothesis. Ecology. 55(3):605–613.
- Doneux M. 2002. Clean Water Partnership project: diagnostic feasibility study and implementation plan. Square Lake: Washington Soil and Water Conservation District.
- Eby LA, Roach WJ, Crowder LB, Stanford JA. 2006. Effects of stocking-up freshwater food webs. Trends Ecol Evol. 21(10):576–584.
- Ellis BK, Stanford JA, Goodman D, Stafford CP, Gustafson DL, Beauchamp DA, Chess DW, Craft JA, Deleray MA, Hansen BS. 2011. Long-term effects of a trophic cascade in a large lake ecosystem. Proc Natl Acad Sci USA. 108(3):1070–1075. doi:10.1073/pnas.1013006108.
- Elser JJ, Dobberfuhl DR, MacKay NA, Schampel JH. 1996. Organism size, life history, and N:P stoichiometry. BioScience. 46(9):674–684.
- Elser JJ, Sterner RW, Galford AE, Chrzanowski TH, Findlay DL, Mills KH, Paterson MJ, Stainton MP, Schindler DW. 2000. Pelagic C: N: P stoichiometry in a eutrophied lake: responses to a whole-lake food-web manipulation. Ecosystems. 3(3):293–307. doi:10.1007/s100210000027.
- Findlay DL, Vanni MJ, Paterson M, Mills KH, Kasian SE, Findlay WJ, Salki AG. 2005. Dynamics of a boreal lake ecosystem during a long-term manipulation of top predators. Ecosystems. 8(6):603–618.
- Geist DR, Scholz AT, Soltero RA. 1993. Relationship between phytoplankton volume and rainbow trout-Daphnia pulex interactions after phosphorus inactivation, Medical Lake, Washington. J Freshwater Ecol. 8(4):341–353.
- Gliwicz ZM, Pijanowska J. 1989. The role of predation in zooplankton succession. In: Plankton ecology. Berlin, Heidelberg: Springer. p. 253–296.
- Gorton JM. 2004. Completion report: a creel survey of Square Lake. Washington County: Minnesota Department of Natural Resources, Division of Fish and Wildlife. 28p.
- Hail DJ, Ehlinger TJ. 1989. Perturbation planktivory, and pelagic community structure: the consequence of winterkill in a small Lake. Can J Fish Aquat Sci. 46(12):2203–2209.
- Hanazato T, Yasuno M. 1989. Zooplankton community structure driven by vertebrate and invertebrate predators. Oecologia. 81(4):450–458.
- Hembre LK, Megard RO. 2003. Seasonal and diel patchiness of a Daphnia population: an acoustic analysis. Limnol Oceanogr. 48(6):2221–2233.
- Hembre LK, Megard RO. 2005. Timing of predation by rainbow trout controls Daphnia demography and the trophic status of a Minnesota lake. Freshwater Biol. 50(6):1064–1080.
- Hembre LK. 2006. Maintaining zooplankton (Daphnia) for water quality. Grant report for Legislative Commission on Minnesota Resources (LCMR) study.
- Hendrixson HA, Sterner RW, Kay AD. 2007. Elemental stoichiometry of freshwater fishes in relation to phylogeny, allometry and ecology. J Fish Biol. 70(1):121–140.
- Jankowski T, Livingstone DM, Bührer H, Forster R, Niederhauser P. 2006. Consequences of the 2003 European heat wave for lake temperature profiles, thermal stability, and hypolimnetic oxygen depletion: implications for a warmer world. Limnol Oceanogr. 51(2):815–819.
- Johnson B. 2017. 2015 study of the water quality of 164 metropolitan area lakes. Metropolitan Council Environmental Services.
- Knapp RA, Hawkins CP, Ladau J, McClory JG. 2005. Fauna of Yosemite National Park lakes has low resistance but high resilience to fish introductions. Ecol Appl. 15(3):835–847.
- Lampert W, Fleckner W, Rai H, Taylor BE. 1986. Phytoplankton control by grazing zooplankton: a study on the spring clear-water phase. Limnol Oceanogr. 31(3):478–490.
- Larsson P, Lampert W. 2011. Experimental evidence of a low-oxygen refuge for large zooplankton. Limnol Oceanogr. 56(5):1682–1688.
- Lathrop RC, Johnson BM, Johnson TB, Vogelsang MT, Carpenter SR, Hrabik TR, Kitchell JF, Magnuson JJ, Rudstam LG, Stewart RS. 2002. Stocking piscivores to improve fishing and water clarity: a synthesis of the Lake Mendota biomanipulation project. Freshwater Biol. 47(12):2410–2424. doi:10.1046/j.1365-2427.2002.01011.x.
- Leibold M, Tessier AJ. 1991. Contrasting patterns of body size for Daphnia species that segregate by habitat. Oecologia. 86(3):342–348.
- Luecke C, Vanni MJ, Magnuson JJ, Kitchell JF, Jacobson PT. 1990. Seasonal regulation of Daphnia populations by planktivorous fish: implications for the spring clear-water phase. Limnol Oceanogr. 35(8):1718–1733.
- Mazumder A. 1994. Patterns of algal biomass in dominant odd- vs. even-link lake ecosystems. Ecology. 75(4):1141–1149.
- Mishra V, Cherkauer KA, Bowling LC, Huber M. 2011. Lake Ice phenology of small lakes: impacts of climate variability in the Great Lakes region. Global Planet Change. 76(3-4):166–185.
- Plevan A, Hembre LK. 2012. Square Lake implementation plan refinement. Carnelian-Marine St. Croix Watershed District.
- R Core Team. 2014. R: a language and environment for statistical computing. Vienna, Austria: R Foundation for Statistical Computing.
- Ramstack JM, Fritz SC, Engstrom DR, Heiskary SA. 2003. The application of a diatom-based transfer function to evaluate regional water-quality trends in Minnesota since 1970. J Paleolimnol. 29(1):79–94.
- Ramstack JM, Fritz SC, Engstrom DR. 2004. Twentieth century water quality trends in Minnesota lakes compared with presettlement variability. Can J Fish Aquat Sci. 61(4):561–576.
- Rast W, Lee GF. 1978. Summary analysis of the North American (US Portion) OCED eutrophication project: nutrient loading-lake response relationships and trophic state indices. Corvalis (OR): United States Environmental Protection Agency.
- Rudstam LG, Lathrop RC, Carpenter SR. 1993. The rise and fall of a dominant planktivore: direct and indirect effects on zooplankton. Ecology. 74(2):303–319.
- Sarnelle O, Knapp RA. 2005. Nutrient recycling by fish versus zooplankton grazing as drivers of the trophic cascade in alpine lakes. Limnol Oceanogr. 50(6):2032–2042.
- Shapiro J, Wright DL. 1984. Lake restoration by biomanipulation: Round Lake, Minnesota, the first two years. Freshwater Biol. 14:371–383.
- Sharma RK, Bhat RA. 2015. Length-weight relationship, condition factor of rainbow trout (Oncorhynchus mykiss) from Kashmir waters. Ann Biol Res. 6(8):25–29.
- Smith VH, Joye SB, Howarth RW. 2006. Eutrophication of freshwater and marine ecosystems. Limnol Oceanogr. 51(1part2):351–355.
- Stanković D, Crivelli AD, Snoj A. 2015. Rainbow trout in Europe: introduction, naturalization, and impacts. Rev Fish Sci Aquac. 23(1):39–71.
- Stefan HG, Hondzo M, Fang X, Eaton JG, McCormick JH. 1996. Simulated long term temperature and dissolved oxygen characteristics of lakes in the north-central United States and associated fish habitat limits. Limnol Oceanogr. 41(5):1124–1135.
- Sterner RW, Elser JJ. 2002. Ecological stoichiometry: the biology of elements from molecules to the biosphere. Princeton: Princeton University Press. p.1–43.
- Tessier AJ, Leibold MA. 1997. Habitat use and ecological specialization within lake Daphnia populations. Oecologia. 109(4):561–570.
- Vanni MJ. 2002. Nutrient cycling by animals in freshwater ecosystems. Annu Rev Ecol Syst. 33(1):341–370.
- Vanni MJ, Boros G, McIntyre PB. 2013. When are fish sources vs. sinks of nutrients in lake ecosystems? Ecology. 94(10):2195–2206.
- Wang L, Zimmer K, Diedrich P, Williams S. 1996. The two-story rainbow trout fishery and its effect on the zooplankton community in a Minnesota lake. J Freshwater Ecol. 11(1):67–80.
- Weider LJ, Lampert W. 1985. Differential response of Daphnia genotypes to oxygen stress: respiration rates, hemoglobin content and low-oxygen tolerance. Oecologia. 65(4):487–491.
- Wright D, Shapiro J. 1990. Refuge availability: a key to understanding the summer disappearance of Daphnia. Freshwater Biol. 24(1):43–62.
- Zaret TM, Suffern JS. 1976. Vertical migration in zooplankton as a predator avoidance mechanism. Limnol Oceanogr. 21(6):804–813.
