
Abstract
Child AW, Moore BC. 2019. Total phosphorus analyses: is the convenience of automated inline-UV digestion robust enough for freshwater nutrient monitoring? Lake Reserve Manage. 35:140–147
Phosphorus (P) is an essential and often growth-limiting nutrient in aquatic ecosystems. Excessive P in aquatic ecosystems can result in accelerated eutrophication and is a prime cause of “impaired” water quality listing under the Clean Water Act. Total phosphorus (TP) is a commonly used metric for predicting productivity and assessing nutrient enrichment in aquatic ecosystems. Accurate and precise TP data are essential for aquatic resource managers and scientists. Inline-ultraviolet (inline-UV) and persulfate digestions are both approved methods for estimating TP within water samples, and literature on their relative digestion efficiencies is available. However, the available literature to date has only evaluated relatively high TP concentrations, >90 µg P/L, considerably higher than critical trophic concentrations for natural lakes and streams. We compared inline-UV digestion with the more common autoclave persulfate digestion, analyzing TP from 32 freshwater sites in northern Idaho and eastern Washington. Sites were chosen to represent common ranges of TP (5 to 350 µg P/L) found in surface waters throughout the world. Both digestions performed adequately on third-party reference materials used for laboratory accreditation requirements. The linear model comparing logarithmic transformations of TP estimates from both digestion methods were correlated (p < 0.001, R2 = 0.8110), and suggested inline-UV digestion may not accurately estimate low-level TP concentrations in natural waters. Our results indicate that inline-UV digestion results are overall not comparable to autoclave digestion (absolute mean difference 16 µg/L or 22%, p < 0.001); lake managers should be aware that TP method selection can significantly alter data interpretation for nutrient monitoring plans.
Phosphorus (P) is an essential element for all living organisms. Since pioneering works of the 1960s and 1970s firmly linked phosphorus to eutrophication (Vollenweider Citation1968, Vallentyne Citation1974, Schindler Citation1977), the “phosphorus paradigm” has been a central tenet in managing and controlling water quality in freshwater ecosystems (Wetzel Citation2001, Cooke et al. Citation2005). These and an abundance of subsequent studies have shown that increases in internal and external P loading drive increased algae and/or macrophyte growth, in turn affecting water clarity, dissolved oxygen (DO), specific conductivity, alkalinity, pH, and aquatic food webs (Nürnberg Citation1984, Hargeby et al. Citation1994, Correll Citation1998, Lathrop et al. Citation1999). Long-term studies have consistently affirmed that P is the most common growth-limiting factor for algae and other primary producers and must be the focus for successful management of eutrophic waters (Schindler Citation1977, Guildford and Hecky Citation2000, Wetzel Citation2001, Schindler et al. Citation2008, Søndergaard et al. Citation2017).
Organisms use P to build life-sustaining molecules (e.g., cell membranes, DNA, and RNA), and compounds necessary for the electron and energy transport systems of metabolic reactions (e.g., ADP, ATP) (Kortmann and Rich Citation1994). Phosphates in nucleic acids and membranes have slow rates of turnover in cells, but those in the electron transport systems have very rapid turnover (Wetzel Citation2001). Because of the relative scarcity of phosphates, and because algae have developed numerous methods to efficiently extract phosphates from water, concentrations of dissolved phosphates are typically quite low. Therefore, total phosphorus (TP) is a common metric used to evaluate productivity potential within aquatic ecosystems. Numerous studies have addressed the relationship between TP and chlorophyll-a (Chl-a) within lake ecosystems (Vollenweider Citation1968, Dillon and Rigler Citation1974, Jones and Bachmann Citation1976, Canfield and Bachmann Citation1981, Prepas and Trew Citation1983, Havens and Nürnberg Citation2004). TP seasonal or yearly averages are often employed to classify trophic status of lakes and reservoirs (e.g., Carlson Trophic State Index) (Carlson Citation1977, Correll Citation1998). Regulators of waterbodies listed as “impaired” under the Clean Water Act (i.e., 303(d)) due to excessive nutrient pollution are required to calculate total maximum daily load (TMDL) for the constituents, such as P, that have caused the impairment. TMDL models depend on accurate and precise estimations of chemical constituents (e.g., TP) to estimate target management goals (e.g., Havens and Schelske Citation2001, Effler et al. Citation2002, Havens and Walker Citation2002, Brett et al. Citation2016). Thus, accurate TP measurements are an integral tool for freshwater scientists and lake managers.
Automated inline-ultraviolet (inline-UV) digestion for TP analysis is becoming readily available and offers streamlined production that reduces sample processing time and costs. The goal of this study is to evaluate the precision and accuracy of automated inline-UV digestion using samples from a variety of freshwater ecosystems in comparison to the “benchmark” persulfate digestion method that is recommended by previous reviews (Maher and Woo Citation1998). Both methods are approved “Standard Methods” (i.e., 4500-P I, 4500-P J) for the detection of TP within freshwater (American Public Health Association [APHA] Citation2005), and multiple studies have addressed the comparability of these methods (reviewed by Maher and Woo Citation1998). However, most of the comparisons involved recovery of synthetic forms of dissolved organic material (e.g., phenyl-phosphate, trimethyl-phosphate, adenosine-5-mono-phosphate disodium salt, etc.), or of water and wastewater samples with very high TP concentrations representative of highly eutrophic aquatic ecosystems (i.e., >90 µg P/L; Goossen and Kloosterboer Citation1978, McKelvie et al. Citation1989, Benson et al. Citation1996, APHA Citation2005). We analyzed samples from lakes, reservoirs, ponds, and streams of varying sizes and trophic states to test how inline-UV digestion compares to conventional autoclave digestions at lower TP concentrations representing a wider variety of freshwater ecosystems.
Materials and methods
Study site
Samples were taken from 32 sites in freshwaters from northern Idaho and eastern Washington (). Sites included streams, reservoirs, ponds, and lakes, chosen to represent a gradient of TP concentrations in freshwater ecosystems (i.e., 5–350 µg P/L).
Table 1. Study site classifications, locations, and average TP estimations with associated error for both digestion methods.
Sample collection and analysis
Surface water grab samples (i.e., 500–1000 mL) were collected in triplicate in acid-washed (i.e., 3× with 1 M HCl, 5× with 18.2 MΩ water) polypropylene bottles. Bottles were triple rinsed with sample water prior to final sample collection (Jarvie et al. Citation2002). Bottles were submerged directly below the air–water interface and filled to minimize head space. Samples were transported on ice from the field and stored in the dark at 4 C in accordance with suggested storage limits for TP analysis (Maher and Woo Citation1998). All samples (n = 96) were split and analyzed using both digestion methods.
Both manual autoclave and inline-UV digestion methods employ a strong oxidant, potassium persulfate, to convert all forms of P to orthophosphate (OP). Subsequently, OP was measured using the automated ascorbic acid reduction method with a continuous flow analyzer (APHA Citation2005; SEAL Analytical AA3, Mequon, WI). Detection limits of both methods were determined using standard methods (i.e., minimum detection limit 2 µg P/L, top calibrant 300 µg P/L) (APHA Citation2005). ACS reagent-grade chemicals and ultrapure water (i.e., 18.2 MΩ) were used to prepare all reagents and analytical matrices. Samples were shaken to evenly distribute particulates, and subsamples were then immediately removed for digestion and/or analysis. Manual TP digestion used alkaline persulfate reagent (15 g sodium hydroxide, 30 g boric acid, 50 g potassium persulfate per L of water), added to sample in a 1:10 ratio (i.e., 4 mL digestion solution:40 mL sample) prior to autoclaving at 120 C for 2 h. Inline-UV digestion incorporated 0.63 mL persulfate reagent (28.5 g potassium persulfate per 1 L of water) and 1.5 mL sample within the automated flow analyzer (SEAL Analytical AA3, Mequon, WI) prior to passing through an inline-UV lamp and 90 C heat bath. Analytical sample duplicates and blanks were incorporated during sample processing and required less than 10% error to pass quality assurance/quality control (QA/QC) protocols. Samples with error larger than 10% were reanalyzed until QA/QC requirements were satisfied; results outside of control limits were excluded from analytical comparisons. Third-party reference materials were digested using both methods to test acceptability for laboratory accreditation with Washington State Department of Ecology (Complex Nutrients-WP, RTC PEI-028-2, Sigma-Aldrich RTC, Laramie, WY).
Statistical analysis
Statistical analyses were conducted with R (version 3.5.1; R Project for Statistical Computing, Vienna, Austria). Logarithmic transformations of TP concentrations for each method were plotted in comparison to a 1:1 line, and linear regression analysis was used to compare accuracy and precision between methods. Logarithmic transformations were calculated to better represent the large data spread. We also compared the absolute differences between digestion methods using the Wilcoxon signed rank test.
Results and discussion
Both methods provided acceptable results for third-party quality control reference materials (), suggesting that both methods could pass “stringent” QA/QC protocols required by government agencies for water quality monitoring accreditation. However, third-party QA/QC tests may not adequately provide evidence that both methods are comparable, or efficient at performing accurate estimations on natural waters in which phosphorus is contained in more complex molecular fractions.
Table 2. Comparison of TP recovery from third-party QC reference material.
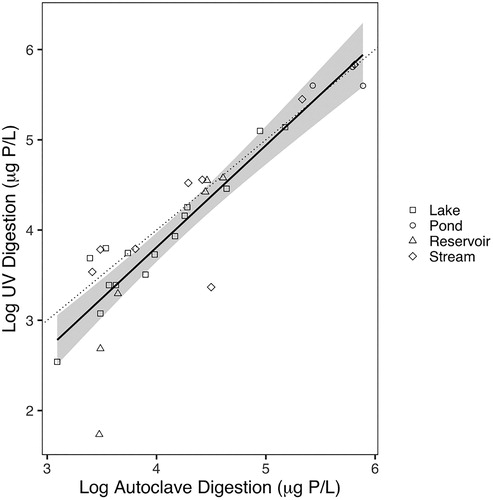
TP concentrations ranged from 16 to 338 µg P/L with manual autoclave digestion, and from 5 to 335 µg P/L for inline-UV digestion. TP concentrations were representative of common nutrient levels in surface waterbodies. Logarithmic transformations of both digestion methods were linearly correlated (p < 0.001, R2 = 0.8110). For inline-UV digestion, 95% confidence intervals surrounding the best fit linear model deviated from a 1:1 comparison line (), clearly demonstrating performance limitations at lower TP concentrations in natural waters. For higher TP concentrations (i.e., >90 µg P/L), results for both methods converged with the 1:1 linear model, similar to previously reported comparisons (Goossen and Kloosterboer Citation1978, McKelvie et al. Citation1989, Benson et al. Citation1996, APHA Citation2005). The divergence of our data from previous method comparisons is due to the use of water samples from natural waterbodies rather than synthetic organic phosphorus mixtures and suggests that inline-UV digestion may not yield acceptable results in water samples with low TP concentrations.
Figure 1. Comparison of log-log transformations of inline-UV and autoclave TP digestion methods. Points represent mean of triplicate samples. Solid black line represents best fit linear model (p < 0.001, R2 = 0.8110) and gray polygon represents 95% confidence intervals. Dotted line represents a 1:1 relationship between methods.
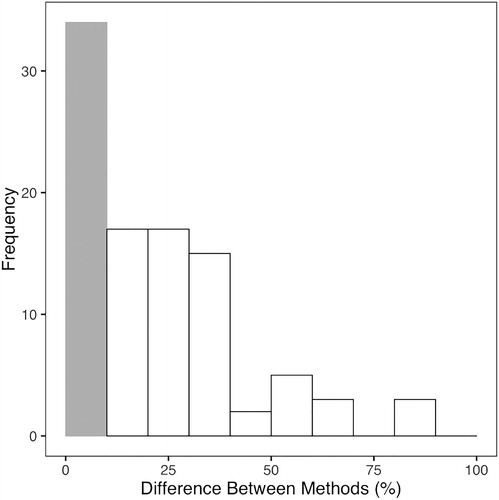
Comparison of absolute differences in TP concentrations demonstrates a significant difference between methods (p < 0.001, Wilcoxon signed rank test). Absolute mean difference between methods was 16 µg P/L, with 90% confidence intervals of 31 µg P/L, and maximum differences up to 120 µg P/L. Large differences between methods were observed at high and low TP concentrations, but inline-UV digestion consistently yielded lower concentrations than manual digestion at low-level TP concentrations (). Although 34 of the samples (n = 96) yielded <10% difference between methods, generally acceptable for QA/QC protocols on duplicate samples, 64 sample results exceeded the 10% criterium. Mean percent difference between method was 22%, with a median of 19%, and a maximum difference of 84% between methods ().
Figure 2. Histogram of percent difference between TP digestion methods for all samples (n = 96). Grey bar represents samples that displayed <10% difference between methods (n = 34), and white bars outlined in black represent samples that displayed >10% difference (n = 62).
TMDL TP limits and/or target reductions in lakes are frequently set below 20 µg P/L (Wagner and Corbin Citation2003, Fulton and Smith Citation2008). Conclusions about lake trophic classification would be significantly altered at the observed degree of variation detected between methods (Auer et al. Citation1986). For example, a ±31 µg P/L margin of error, which encompasses the 90% confidence intervals surrounding our data, could lead to misinterpretation of lake impairment, trophic status, or compliance with mandated regulatory goals, and could grossly misrepresent the biochemical forces driving lake productivity. Lake and reservoir managers should be aware of the potential errors that may be associated with switching methods or laboratories simply to achieve cost savings or decreased sample processing time using automated instruments. Even if methods and laboratories are accredited, there is a potential that switching methods could lead to misinterpretations of long-term nutrient data trends. For example, previous work demonstrated that long-term nutrient monitoring on Long Lake (Spokane, WA) may have been biased as a consequence of adjusted methodology (Brett et al. Citation2016). Interestingly, the method in question was also inline-UV digestion, which resulted in 4 to 20 µg P/L (∼19%) higher TP estimations compared with more robust methods (Cusimano Citation2003, Hallock Citation2012, Brett et al. Citation2016). Our data generally contrast with the Long Lake results and indicate that inline-UV digestions consistently yield unacceptably low TP at low concentrations compared to manual persulfate digestion. However, results from several lake and stream samples in our data set yielded higher TP estimations by inline-UV digestion (). Ultimately, we suggest that both studies demonstrate the inability of inline-UV digestion to accurately estimate TP concentrations at low-levels in natural waters.
We believe that differences between TP digestion methods are influenced by physical and chemical properties of the phosphorus-containing materials in natural waters. Quality control samples are typically comprised of well-mixed, dissolved organic forms of P. Natural surface waters most often contain a more complex mixture of particulate, as well as dissolved organic and inorganic P compounds. Autoclave digestion likely produces more representative concentrations as particulate and dissolved forms of P are more evenly distributed within samples prior to digestion, and the larger volumes required from the autoclave method likely decrease bias from differing forms of P, especially in particulates. A review of P analytical methods in natural waters suggests persulfate digestions by autoclave or microwave provide the highest degree of precision (Maher and Woo Citation1998).
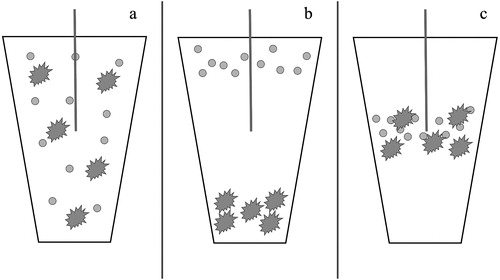
In the case of inline-UV digestion, samples may sit in a quiescent condition in the sample tray prior to analysis, allowing settling of particulates prior to sample loading into the analytical stream (). Therefore, there is likely sufficient time for negatively (e.g., diatoms) and/or positively (e.g., cyanobacteria) buoyant particulates to spatially separate, and be excluded from analysis, as the sampler extracts only a portion of the resulting heterogeneous sample () (Lund et al. Citation1963, Henriksen Citation1970, Reynolds Citation1973, Citation1984, Reynolds and Wiseman Citation1982). Selective bias of a heterogeneous sample by the automated sample probe could drastically alter TP estimations, and intrasample replicate variance could remain low as the physical properties of particulates between sample cups are similar. Spatial separation of particulates is one mechanism by which inline-UV digestion may underestimate () or overestimate () TP in natural waters, as plankton cells are a primary pool of standing-crop P in freshwater ecosystems (Henriksen Citation1970, Gulati et al. Citation1992, Havens and Schelske Citation2001). For example, Clark et al. (Citation2010) demonstrated that a single large-bodied zooplankton (i.e., Daphnia sp.) could contaminate a 35 mL water sample with up to 25 μg P/L. Therefore, depending on particle density and size attributes, the automated sampler could entrain more or less biomass than is naturally present in a homogeneous sample that is more representative of natural water conditions (). TP variation is likely further exacerbated in automated inline-UV digestion because small volumes (i.e., 1.5 mL) do not capture the complete distribution of P fractions.
Figure 3. Graphical representation of (a) homogenized sample within a sample cup, (b) possible separation of positively and negatively buoyant particles within sample cup leading to underestimation of TP, and (c) possible congregation of neutrally buoyant particles within sample cup leading to overestimation of TP concentration.
Our results do not provide absolute conclusive evidence that automated inline-UV analysis is less precise than manual digestion as variance within triplicate samples is often less than the variance observed with manual digestions (). However, our data do suggest that particulate or other component(s) within the automated UV method could lead to over- or underestimation of TP concentrations in natural samples. Autosampler extraction of small volumes of heterogeneous samples containing particulate matter is one mechanism that could result in these errors ().
There is also the possibility that inline-UV digestion may not provide adequate time needed for UV exposure and heat treatment to completely oxidize strong organic-P bonds in compounds found in many natural waters (Maher and Woo Citation1998). For example, high concentrations of organic C have been shown to interfere with persulfate oxidation of P bonds (Williams et al. Citation1995, Maher and Woo Citation1998), although high organic C levels needed to interfere with persulfate oxidation (i.e., >200 mg C/L) are not commonly observed in natural waters (Thurman Citation1985). However, this does not negate the possibility that chemical constituents in natural waters may result in inaccurate and imprecise estimation of TP by both methods. We suggest that further work should be conducted before accepting automated inline-UV TP digestion for analyses of natural water samples.
Inline methods show great promise for streamlining analytical workload for TP, but may require significant modifications to improve reliability and comparability with autoclave digestions. For example, longer residence times in digestion and heat-bath loops and sampler agitators might overcome the issues identified in this and other studies. Sample mixing or agitation might be used to address heterogeneous distribution of particulates. Our results suggest that current QC standards may not truly evaluate the ability of analyses to provide accurate and precise TP concentrations in natural waters. We suggest that QC standards should be comprised of more complex mixtures of compounds, similar to the mixtures found in natural waters, to truly evaluate accuracy of analyses involving TP digestions in natural waters.
References
- American Public Health Association (APHA). 2005. Standard methods for the examination of water and wastewater. 21st ed. Port City Press: Baltimore (MD).
- Auer MT, Kieser MS, Canale RP. 1986. Identification of critical nutrient levels through field verification of models for phosphorus and phytoplankton growth. Can J Fish Aquat Sci. 43(2):379–388. doi:10.1139/f86-048.
- Benson RL, McKelvie ID, Hart BT, Truong YB, Hamilton IC. 1996. Determination of total phosphorus in waters and wastewaters by on-line UV/thermal induced digestion and flow injection analysis. Anal Chim Acta. 326(1–3):29–39. doi:10.1016/0003-2670(96)00044-X.
- Brett MT, Ahopelto SK, Brown HK, Brynestad BE, Butcher TW, Coba EE, Curtis CA, Dara JT, Doeden KB, Evans KR. 2016. The modeled and observed response of Lake Spokane hypolimnetic dissolved oxygen concentrations to phosphorus inputs. Lake Reserv Manage. 32(3):246–258. doi:10.1080/10402381.2016.1170079.
- Canfield DE, Jr., Bachmann RW. 1981. Prediction of total phosphorus concentrations, Chlorophyll a, and Secchi depths in natural and artificial lakes. Can J Fish Aquat Sci. 38:414–423. doi:10.1139/f81-058.
- Carlson RE. 1977. A trophic state index for lakes. Limnol Oceanogr. 22(2):361–369. doi:10.4319/lo.1977.22.2.0361.
- Clark BJ, Paterson AM, Jeziorski A, Kelsey S. 2010. Assessing variability in total phosphorus measurements in Ontario’s lakes. Lake Reserv Manage. 26(1):63–72. doi:10.1080/07438141003712139.
- Cooke GD, Welch EB, Perterson SA, Nichols SA. 2005. Restoration and management of lakes and reservoirs. 3rd ed. Taylor & Francis: Boca Raton.
- Correll DL. 1998. The role of phosphorus in the eutrophication of receiving waters: a review. J Environ Qual. 27(2):261–266. doi:10.2134/jeq1998.00472425002700020004x.
- Cusimano B. 2003. Data summary: Spokane River and Lake Spokane (Long Lake) pollutant loading assessment for protecting dissolved oxygen. Washington: Washington State Department of Ecology, Publication No. 03-03-023.
- Dillon PJ, Rigler FH. 1974. The phosphorus-chlorophyll relationship in lakes. Limnol Oceanogr. 19(5):767–773. doi:10.4319/lo.1974.19.5.0767.
- Effler SW, O'Donnell SM, Matthews DA, Matthews CM, O'Donnell DM, Auer MT, Owens EM. 2002. Limnological and loading information and a phosphorus total maximum daily load (TMDL) analysis for Onondaga Lake. Lake Reserv Manage. 18(2):87–108. doi:10.1080/07438140209354140.
- Fulton RS, III, Smith D. 2008. Development of phosphorus load reduction goals for seven lakes in the upper Ocklawaha river basin, Florida. Lake Reserv Manage. 24(2):139–154. doi:10.1080/07438140809354057.
- Goossen JTH, Kloosterboer JG. 1978. Determination of phosphates in natural and waste waters after photochemical decomposition and acid hydrolysis of organic phosphorus compounds. Anal Chem. 50(6):707–711. doi:10.1021/ac50027a013.
- Guildford SJ, Hecky RE. 2000. Total nitrogen, total phosphorus, and nutrient limitation in lakes and oceans: is there a common relationship? Limnol Oceanogr. 45(6):1213–1223. doi:10.4319/lo.2000.45.6.1213.
- Gulati RD, Ooms-Wilms AL, Van Tongeren OFR, Postema G, Siewertsen K. 1992. The dynamics and role of limnetic zooplankton in Loosdrecht Lakes (The Netherlands). Hydrobiologia. 233(1–3):69–86. doi:10.1007/BF00016097.
- Hallock D. 2012. River and stream water quality monitoring report water source 2011. Washington: Washington State Department of Ecology, Publication No. 12-03-039.
- Hargeby A, Andersson G, Blindow I, Johansson S. 1994. Trophic web structure in a shallow eutrophic lake during a dominance shift from phytoplankton to submerged macrophytes. Hydrobiologia. 279:83–90. doi:10.1007/BF00027843.
- Havens KE, Nürnberg GK. 2004. The phosphorus-chlorophyll relationship in lakes: potential influences of color and mixing regime. Lake Reserv Manage. 20(3):188–196. doi:10.1080/07438140409354243.
- Havens KE, Schelske CL. 2001. The importance of considering biological processes when setting total maximum daily loads (TMDL) for phosphorus in shallow lakes and reservoirs. Environ Pollut. 113(1):1–9.
- Havens KE, Walker WW. 2002. Development of a total phosphorus concentration goal in the TMDL process for Lake Okeechobee, Florida (USA). Lake Reserv Manage. 18(3):227–238. doi:10.1080/07438140209354151.
- Henriksen A. 1970. Determination of total nitrogen, phosphorus and iron in fresh water by photo-oxidation with ultraviolet radiation. Analyst. 95(1131):601–608. doi:10.1039/an9709500601.
- Jarvie HP, Withers PJA, Neal C. 2002. Review of robust measurement of phosphorus in river water: sampling, storage, fractionation and sensitivity. Hydrol Earth Syst Sci. 6(1):113–132. doi:10.5194/hess-6-113-2002.
- Jones JR, Bachmann RW. 1976. Prediction of phosphorus and chlorophyll levels in lakes. J Water Pollut Control Fed. 48:2176–2182.
- Kortmann RW, Rich PH. 1994. Lake ecosystem energetics: the missing management link. Lake Reserv Manag. 8(2):77–97. doi:10.1080/07438149409354462.
- Lathrop RC, Carpenter SR, Robertson DM. 1999. Summer water clarity responses to phosphorus, daphnia grazing, and internal mixing in Lake Mendota. Limnol Oceanogr. 44(1):137–146. doi:10.4319/lo.1999.44.1.0137.
- Lund JWG, Mackereth FJH, Mortimer CH, S FR. 1963. Changes in depth and time of certain chemical and physical conditions and of the standing crop of asterionella formosa hass. in the north basin of Windermere in 1947. Phil Trans R Soc Lond B. 246:255–290.
- Maher W, Woo L. 1998. Procedures for the storage and digestion of natural waters for the determination of filterable reactive phosphorus, total filterable phosphorus and total phosphorus. Anal Chim Acta. 375(1–2):5–47. doi:10.1016/S0003-2670(98)00274-8.
- McKelvie ID, Hart BT, Cardwell TJ, Cattrall RW. 1989. Spectrophotometric determination of dissolved organic phosphorus in natural waters using in-line photo-oxidation and flow injection. Analyst. 114(11):1459–1463. doi:10.1039/an9891401459.
- Nürnberg GK. 1984. The prediction of internal phosphorus load in lakes with anoxic hypolimnia1. Limnol Oceanogr. 29(1):111–124. doi:10.4319/lo.1984.29.1.0111.
- Prepas EE, Trew DO. 1983. Evaluation of the phosphorus-chlorophyll relationship for lakes off the precambrian shield in western Canada. Can J Fish Aquat Sci. 40(1):27–35. doi:10.1139/f83-005.
- Reynolds CS. 1973. The seasonal periodicity of planktonic diatoms in a shallow eutrophic lake. Freshwater Biol. 3(1):89–110. doi:10.1111/j.1365-2427.1973.tb00065.x.
- Reynolds CS. 1984. Phytoplankton periodicity: the interactions of form, function and environmental variability. Freshwater Biol. 14(2):111–142. doi:10.1111/j.1365-2427.1984.tb00027.x.
- Reynolds CS, Wiseman SW. 1982. Sinking losses of phytoplankton in closed limnetic systems. J Plankton Res. 4(3):489–522. doi:10.1093/plankt/4.3.489.
- Schindler DW. 1977. Evolution of phosphorus limitation in lakes. Science. 195(4275):260–262. doi:10.1126/science.195.4275.260.
- Schindler DW, Hecky RE, Findlay DL, Stainton MP, Parker BR, Paterson MJ, Beaty KG, Lyng M, Kasian SEM. 2008. Eutrophication of lakes cannot be controlled by reducing nitrogen input: results of a 37-year whole-ecosystem experiment. Proc Nat Acad Sci USA. 105(32):11254–11258. doi:10.1073/pnas.0805108105.
- Søndergaard M, Lauridsen TL, Johansson LS, Jeppesen E. 2017. Nitrogen or phosphorus limitation in lakes and its impact on phytoplankton biomass and submerged macrophyte cover. Hydrobiologia. 795(1):35–48. doi:10.1007/s10750-017-3110-x.
- Thurman EM. 1985. Amount of organic carbon in natural waters. In Organic geochemistry of natural waters. developments in biogeochemistry, vol 2. Springer, Dordrecht. p. 7–65.
- Vallentyne JR. 1974. The algal bowl: lakes and man. Miscellaneous special publication 22. Department of Fisheries and Oceans. Winnipeg, Manitoba. 197 pp.
- Vollenweider RW. 1968. Scientific fundamentals of the eutrophication of lakes and flowing waters, with particular reference to nitrogen and phosphorus as factors in eutrophication. Organization for Economic Cooperation and Development. Paris.
- Wagner KJ, Corbin WB. 2003. Approaches for determining appropriate nutrient targets in TMDL development for lakes. Proc Water Environ Fed. 2003(4):554–571. doi:10.2175/193864703784828363.
- Wetzel RG. 2001. Limnology lake and river ecosystems. 3rd ed. San Diego: Academic Press.
- Williams BL, Shand CA, Hill M, O'Hara C, Smith S, Young ME. 1995. A procedure for the simultaneous oxidation of total soluble nitrogen and phosphorus in extracts of fresh and fumigated soils and litters. Commun Soil Sci Plant Anal. 26(1-2):91–106. doi:10.1080/00103629509369283.