
 ?Mathematical formulae have been encoded as MathML and are displayed in this HTML version using MathJax in order to improve their display. Uncheck the box to turn MathJax off. This feature requires Javascript. Click on a formula to zoom.
Abstract
Austin D, Scharf R, Chen C-F, Bode J. Hypolimnetic oxygenation and aeration in two Midwestern USA reservoirs. Lake Reserve Manage. 35:266–276.
This study compares performance of hypolimnetic aeration (HA) with hypolimnetic oxygenation (HO) from 1988 to 2018, over multiple project phases and a baseline period 1984 to 1986. Saint Paul Regional Water Services, Minnesota, pumps 170 MLD (45 MGD) from the Mississippi River through a chain of 4 lakes before treatment. Two, Pleasant Lake and Vadnais Lake, were equipped with partial-lift HA later replaced by linear diffuser HO. Ferric chloride was injected into inflows and into Vadnais at the HA or HO system. HA failed to relieve hypolimnetic hypoxia in Pleasant (median DO 1.7 mg/L) or Vadnais (median DO 2.7 mg/L). Median HO values were aerobic (Pleasant 4.2 mg/L, Vadnais 8.5 mg/L). Both HA and HO raised hypolimnetic oxidation reduction potential to high positive values from negative values associated with Mn and Fe solubilization. Compared to HA, HO reduced median hypolimnetic total Mn concentrations by 75% in Pleasant and in 93% in Vadnais, and hypolimnetic total Fe by 84% in Pleasant and 81% in Vadnais. HA significantly lowered median hypolimnetic TP from baseline, 0.552 mg/L to 0.146 mg/L in Pleasant, and 0.533 mg/L to 0.045 mg/L in Vadnais. HO median hypolimnetic TP was significantly lower at 0.053 mg/L in Pleasant, 0.030 mg/L in Vadnais. Superior performance of HO occurred at similar oxygen delivery rates: 1775 kg/d in Pleasant and 970 kg/d in Vadnais, versus HA of 1200 kg/d in each lake. Performance differences are likely due to lower induced currents at the sediment surface by HO compared to HA.
Study site and background
Saint Paul Regional Water Services pumps Mississippi River water from north of Saint Paul, MN, through a chain of lakes: Charley, Pleasant, Sucker, and Vadnais, in order of flow (Walker et al. Citation1989). This water supply system has been in operation for more than a century to improve the quality of Mississippi River water by natural means before treatment. Two lakes are deep enough to have stable thermal stratification in the summer: Pleasant (average depth 8 m, maximum 15 m) and Vadnais (average depth 8 m, maximum 16.5 m) (). There is ice cover on the lakes, November through April. The McCarrons Water Treatment Plant draws from Vadnais at an average flow of 170 MLD (45 MGD) and up to 302 MLD (80 MGD).
Table 1. Summary of reservoir management actions.
Prior to European settlement in the mid-19th century, both lakes are estimated to have been mesotrophic per methods of Vighi and Chiaudani (Citation1985), which is consistent with sediment core diatom reconstruction of water quality in similar nearby lakes (Heiskary and Swain Citation2002). Vadnais was moderately eutrophic by 1915, forcing algae management with copper sulfate (Huff and House Citation1916). By the 1970s, both lakes where highly eutrophic with severe taste and odor problems and persistent phytoplankton blooms (Walker et al. Citation1989). Phosphorus solubilization from anoxic sediments caused surface TP concentrations to reach 100 to 200 μg/L at fall turnover. Since 1984, remediation of water quality in both lakes has gone through several stages: baseline assessment, ferric chloride (FeCl3) injection (continuing to the present), hypolimnetic aeration, and hypolimnetic oxygenation ().
Oxygenation and aeration systems
Both lakes are of glacial origin with similar bathymetry formed from surface collapse over buried ice as the Laurentide ice sheet retreated approximately 12,000 years ago. As is common regionally, there are deep “pothole” zones in the lakes formed by melting of large ice blocks. Each lake has two deep zones at maximum depth ().
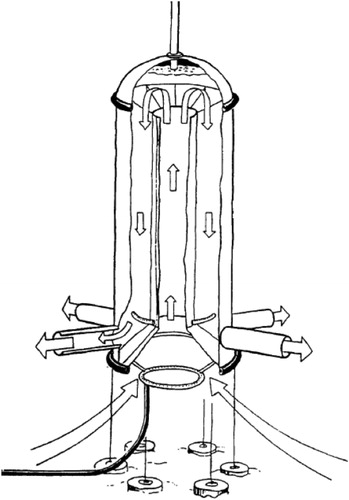
Two partial-lift hypolimnetic aerators, one per deep zone, were operated in each lake (, ). Each aerator had a design oxygen transfer capacity of 600 kg O2/d. Walker (Citation1985) based design hypolimnetic oxygen demand (HOD) on an empirical relationship between the mean spring 1984 chlorophyll-a concentration and sediment oxygen demand (SOD) (Equationequation 1(1)
(1) ). With SOD applied to the area under the thermocline, Walker calculated that the HOD for Vadnais was 1086 kg O2/d and for Pleasant 1165 kg O2/d. At the time of replacement, the Vadnais aerators may have lost approximately 50% of design capacity (Cook Citation2009), but compressors delivered airflow within design specifications of 235 normal (N) m3/hr (115 standard cubic feet per minute, scfm) to each aerator. Aerator efficiency was calculated from the difference between inlet and outlet DO concentrations. Chemical oxygen demand (COD) of inlet water, such as would be exerted by oxidation of Fe2+ or Mn2+/3+, was not considered as a factor in apparent O2 transfer efficiency. Therefore, it is not clear whether low observed O2 transfer efficiency can be attributed to aerator physics (design fault or mechanical problems) or unanticipated COD.
(1)
(1)
Figure 1. Cut-away schematic of partial-lift hypolimnetic aerators. Air was injected into the bottom of the draft tube, which was open to the lake, creating an air-lift pump. Entrained water flowed downward and out through ports radially distributed at the bottom (12 total). Air is vented out of the top. Aerators were buoyant and anchored to the bottom. Draft tube length was approximately 9 m.
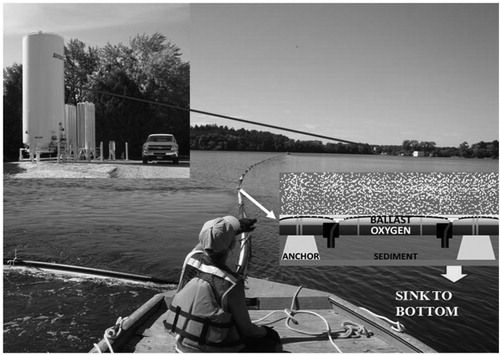
The Pleasant aerators ceased functioning in 2006 because of disengagement of the feed lines with the hypolimnetic aeration (HA) structure. Hypolimnetic oxygenation (HO) systems using linear diffusers sparging pure oxygen bubble plumes () replaced the aerators in Vadnais in late 2011 and in late 2013 in Pleasant. Aerators were removed prior to installation of HO.
Figure 2. Hypolimnetic oxygenation diffuser placement montage in Vadnais. Diffusers run off the vaporization pressure of liquid oxygen. After manufacture at the lake side, diffusers were placed over deep holes and sunk to position by flooding the ballast pipe. (Photo credit: Jacobs. Schematic: Mobley Engineering, Inc.).
Methods
Oxygen demand for HO was determined from SOD studies in both lakes using isolation chambers per the US EPA method (Murphy and Hicks Citation1986, US EPA Citation2009): 3.7 g O2/m2/d in Vadnais, 2.9 g O2/m2/d in Pleasant. Note that the SOD chambers are mixed with an average velocity of 3 to 4 cm/s. Because shear of diffusional boundary layers at the sediment surface will affect diffusion rates of sediment pore water, chamber SOD should be regarded as partially dependent on the water velocity at the sediment surface. Assuming diffusers do not induce higher velocity currents at the sediment surface, chamber SOD values may represent maximum design values.
As with hypolimnetic aeration, the area under the thermocline (6 m depth) was used to determine HOD: Vadnais with a hypolimnetic area of 930,700 m2 and HOD of 3444 kg/d, Pleasant at 984,000 m2 and 2834 kg/d. Final system capacity for each reservoir was 6500 kg O2/d if diffusers are run at maximum flux rates. Gas flux can be increased from design values if gas velocity at diffuser orifices remains subsonic. Thus, the dialup capacity (design to maximum O2 flux rate) of Vadnais is 89% of design, Pleasant 229%.
Linear diffusers (Mobley Engineering, Inc.) were manufactured at lake edges and sunk into lake deep zones, requiring two diffuser lines per lake. Liquid oxygen and vaporizers supply pure O2 gas to diffusers.
Oxygen delivery was recorded by SCADA as scfm as an hourly average. These results were converted to Nm3/h and kg O2/d at 1.429 kg O2/m3.
Standard methods for analysis of grab samples (total phosphorus [TP], total Fe, total Mn, chlorophyll-a [Chl-a]) or field parameters (dissolved oxygen [DO], oxidation reduction potential [ORP], temperature) were applied ().
Table 2. Method summary.
Grab samples and vertical profile data were taken once or twice per month, depending on sampling year. Results for DO are presented for June through August to avoid data influenced by spring and fall turnover, and for June through September for all other samples to capture summer conditions. For the 1984–2018 study period, grab samples were not taken for 1989–1993, 1997–1998, and 2000–2006.
Trophic state indices (TSI) for Secchi disk, TP, and Chl-a were calculated per Carlson (Citation1977) for each sample day.
Statistical analyses were done with Excel and Kaleidagraph software. Isopleths were done using DPlot software. Nonparametric statistics used the Wilcoxon–Mann–Whitney rank sum test for comparison of median value and Kruskal–Wallis for comparison of variance.
Results
Thermal stratification
HA systems preserved thermal stratification in both lakes (Engstrom Citation2005, Cook Citation2009). HO preserved thermal stratification in both lakes (). There was partial destratification, however, during the first year of Pleasant HO operation (2014) at a gas flux rate of 97 Nm3/h (), which was about double the rates of 2015–2018 ().
Figure 3. Temperature isopleths for Vadnais (left) and Pleasant (right). Dots are data points. The bottom meter is truncated from plots to avoid interpolation errors from missing data points. Pleasant hypolimnetic mean temperature is warmer than for Vadnais because of Mississippi River inflows.
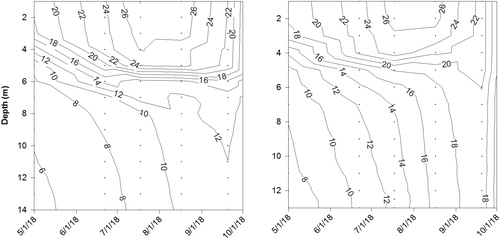
Figure 4. Pleasant partial destratification under first year gas flux rate.
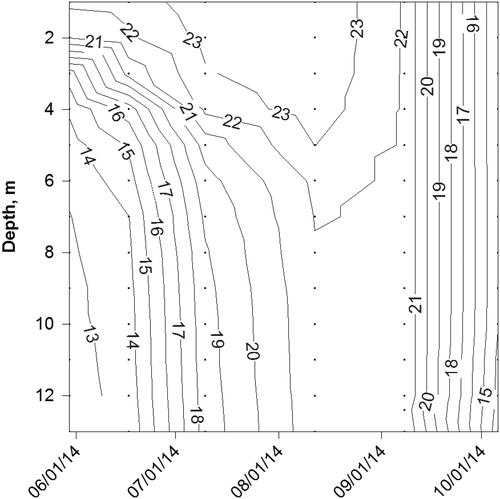
Table 3. Summer mean daily oxygen delivery rates. Normal cubic meters per hour (Nm3/h) is converted directly from standard cubic feet per minute (scfm).
Dissolved oxygen
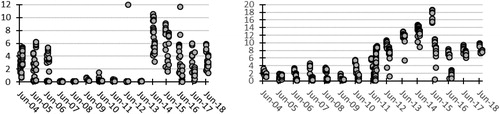
In Pleasant (), the median hypolimnetic (≤10 m) HA DO of 2.6 mg/L was significantly higher (p < 0.0001) than baseline DO (0.11 mg/L). The HO median hypolimnetic DO of 4.2 mg/L was significantly higher (p < 0.0001) than with HA. In Vadnais (), the HO median hypolimnetic DO of 8.5 mg/L was significantly higher (p < 0.0001) than HA DO (1.7 mg/L). Vadnais baseline median hypolimnetic DO was 0.2 mg/L.
Figure 5. Pleasant (left) and Vadnais (right) hypolimnetic DO (mg/L) at 10–15 m depth, Jun–Aug. Note that Vadnais had no HA nor HO in 2011.
Oxygen demand
Oxygen demand for HO has varied little (). Excluding excessive gas supply in 2014, Pleasant summer oxygen demand has averaged 1775 kg/d, which is a mean gas supply rate of 52 Nm3/h. Vadnais mean summer oxygen demand has been 970 kg/d (28 Nm3/h).
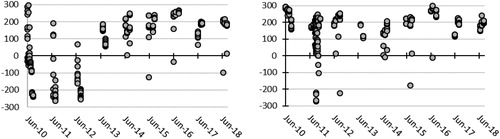
Oxidation reduction potential
Oxidation reduction potential (ORP) in Pleasant and Vadnais has been monitored in vertical profiles since 2010. In Pleasant, the median hypolimnetic ORP of −49 mV after HA had ceased to function was significantly (p < 0.0001) less than the HO hypolimnetic ORP of +179 mV (). In Vadnais, the median HA hypolimnetic ORP of +200 mV was not significantly different (p = 0.09) from the HO hypolimnetic value of +197 mV ().
Figure 6. Pleasant (left) and Vadnais (right) hypolimnetic ORP (mV) at 10–15 m depth, Jun–Aug. Note that aerators were removed from Vadnais in May 2011. HO was commissioned in October 2011.
Iron
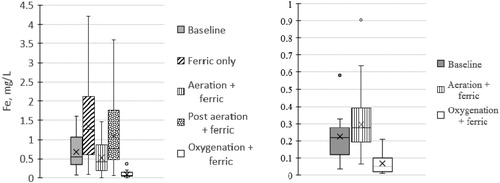
In Pleasant, the HO median hypolimnetic total Fe of 0.067 mg/L was significantly (p < 0.0001) less than the HA median of 0.426 mg/L (). Note that FeCl3 addition at the pump station significantly (p = 0.02) increased hypolimnetic total Fe from the baseline median of 0.54 mg/L to 1.3 mg/L prior to installation of the HA system. The HA system significantly (p = 0.0002) lowered the hypolimnetic median total Fe to 0.43 mg/L compared to the period of FeCl3 addition prior to aeration but this was not significantly different from baseline data (p = 0.34). In Vadnais, the HO median total Fe concentration of 0.044 mg/L was significantly (p < 0.0001) less than the HA median of 0.232 mg/L (), but there was no significant difference (p > 0.1) in median hypolimnetic total Fe between baseline and HA periods.
Figure 7. Pleasant (left) and Vadnais (right) summer (Jun–Sep) hypolimnetic total Fe.
Manganese
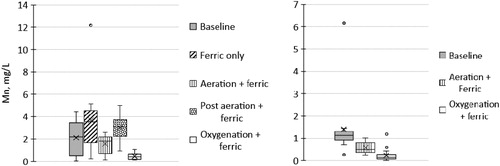
In Pleasant, the HO median hypolimnetic total Mn concentration of 0.45 mg/L was significantly (p < 0.0004) less than the HA median of 1.78 mg/L (). In Vadnais, the HO median total Mn hypolimnetic concentration of 0.14 mg/L was significantly (p < 0.0001) less than the HA period median of 0.48 mg/L (). In both lakes HA significantly (p < 0.05) reduced hypolimnetic total Mn from baseline concentrations of 2.2 mg/L in Pleasant and 1.1 mg/L in Vadnais.
Figure 8. Pleasant (left) and Vadnais (right) summer (Jun–Sep) hypolimnetic total Mn.
Total phosphorus
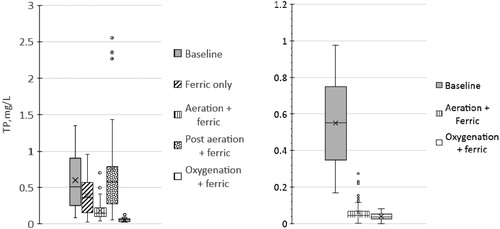
In Pleasant, the HO median TP hypolimnetic concentration of 0.053 mg/L was significantly (p < 0.0001) less than the HA median of 0.146 mg/L (), which was significantly (p < 0.0001) less than the baseline hypolimnetic median TP of 0.552 mg/L.
Figure 9. Pleasant (left) and Vadnais (right) summer (Jun–Sep) hypolimnetic total phosphorus.
Injection of FeCl3 at the Mississippi River pump station significantly (p = 0.001) reduced Pleasant surface TP from the baseline median of 0.072 mg/L to 0.040 mg/L. The HA system median surface TP of 0.039 mg/L was not significantly different (p = 0.11) from ferric addition alone. The HO system median surface TP of 0.028 mg/L was not significantly (p = 0.34) different from the previous period (no HA) median of 0.032 mg/L.
In Vadnais, the HO median TP hypolimnetic concentration of 0.030 mg/L was significantly (p < 0.0005) less than the HA median of 0.045 mg/L. HA significantly reduced hypolimnetic TP (p < 0.05) from the baseline median of 0.533 mg/L (). The HO median surface TP of 0.025 mg/L was significantly (p = 0.002) less than the HA median of 0.028 mg/L (). The median HA surface TP was significantly (p < 0.0001) less than the baseline median surface TP of 0.062 mg/L.
Figure 10. Summer (Jun–Sep) surface TP distribution in Pleasant (left) and Vadnais (right).
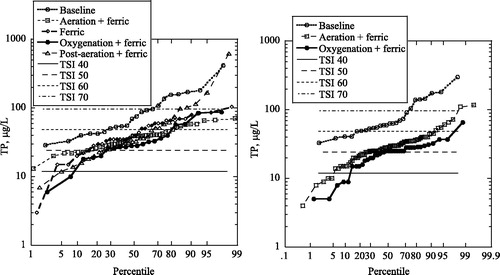
Remediation lowered the trophic state in both lakes as indicated by the trophic state index for P, TSI(P). In Pleasant, the percentages of surface TP concentrations that were greater than or equal to high eutrophic, TSI(P) > 60, were approximately 70% for the baseline condition, 40% for ferric addition alone, and 20% for HA or HO with ferric (). In Vadnais, the percentages of surface TP concentrations that were high eutrophic or greater were approximately 80% for baseline, 5% for HA, and 1% for HO ().
Chlorophyll-a
In Pleasant, HO reduced chlorophyll-a (Chl-a) to a median value of 12 μg/L compared to 16 μg/L of the preceding period without aeration (). The difference in median values may not be significant (p = 0.097).
Figure 11. Summer (Jun–Sep) chlorophyll-a distribution in Pleasant (left) and Vadnais (right).
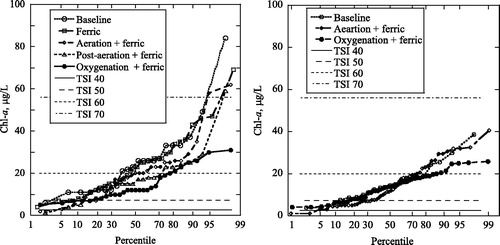
In Vadnais, there is no statistically significant difference between median Chl-a concentrations (11.8 to 14.5 μg/L) of successive project phases (). However, the HO variance of 35 μg2/L2 is low compared to 71 μg2/L2 for baseline and 96 μg2/L2 for HA. Data sets are close to linear distribution (linear fit R2 range 0.91 to 0.97) on the probability plot (), which is indicative of normal distribution (Helsel and Hirsch Citation2002). The F-probability between baseline and aerated periods is 0.46, suggesting no significant difference in variance. Between aerated and oxygenated periods, the F-probability is 0.0006, and 0.05 between baseline and oxygenated periods, suggesting that there is significantly less variance with HO.
As with surface TP, remediation shifted the trophic state downward in both lakes. In Pleasant, the percentages of Chl-a concentrations that were high eutrophic (TSI(CHL) > 60) or greater were approximately 60% for the baseline condition, 50% for ferric addition alone before HA, 40% for HA, 30% after HA ceased, and 20% for HO (). In Vadnais Lake, the percentages of surface Chl-a concentrations that were high eutrophic or greater were approximately 30% for baseline, 20% for HA, and 10% for HO ().
Discussion
The common effect of HO in both lakes has been to eliminate hypoxic conditions with strong suppression of sediment solubilization of TP, Fe, and Mn. In contrast, hypoxic conditions prevailed with HA, but HA did substantially suppress internal P-loading and Mn solubilization. Only oxygenation, however, was able to substantially lower hypolimnetic total Fe.
The common effect of HA and HO has been a sharp increase in hypolimnetic ORP. Although ORP monitoring only began in 2010, hypolimnetic Mn, Fe, and TP values allow inferences because of high solubilization under low ORP values. Addition of FeCl3 to both lakes raised hypolimnetic total Fe. Aeration mass transfer of O2 to the hypolimnion created or maintained sufficient Fe3+ to scavenge and sequester phosphate (PO43-) into ferric hydroxide complexes, and thus lower TP. Sharply lower hypolimnetic Mn concentrations with HA clearly indicates oxidizing conditions in the hypolimnia of the lakes. Greater Fe oxidation with HO scavenged and sequestered more PO43-, substantially lowering hypolimnetic TP compared to all other project phases. High ORP values, therefore, reflect substantial oxidation of Mn and Fe, but not necessarily high DO.
Hypolimnetic hypoxia during HA may not have been due to mechanical problems. In both lakes, observed HOD from oxygen gas flux () was not far from the HA design oxygen delivery rate of 1200 kg/d per lake, −32% for Pleasant and +19% for Vadnais. These percentage differences do not account for the large difference in oxidizing power of HO compared to HA. The difference may be due to hydrodynamics and the HOD exerted by Fe2+ and Mn2+/3+ in sediments as detailed in the following.
Estimated water flow within each aerator was approximately 488,000 m3/d, with an observed mass transfer of 322 kg O2/d (Cook Citation2009). Chemical oxygen demand (COD) exerted by reduced solutes (e.g., Fe2+ or Mn2+/3+) could be responsible for poor oxygen transfer efficiency as measured by inlet–outlet DO concentrations.
During aeration the June through September median total hypolimnetic Fe concentration was 0.426 g/m3 in Pleasant and 0.237 g/m3 in Vadnais. If the difference in total Fe between HA and HO periods were due to dissolved Fe (Fe2+), as much as 80% of HA total Fe could have been in the ferrous state (Fe2+) while HA operated. At estimated flow rates, the median Fe2+ flux through each aerator would have been up to 166 kg/d in Pleasant and 93 kg/d in Vadnais. Exerting a COD (Equationequation 2(2)
(2) ) of 0.142 kg O2/kg Fe2+, the median hypolimnetic oxygen demand exerted by Fe2+ could have been as much as 24 kg/d in Pleasant Lake and 14 kg/d in Vadnais Lake.
(2)
(2)
Per Equationequation 3(3)
(3) , the COD for Mn is 0.291 kg O2/kg Mn2+. In Pleasant Lake, baseline median hypolimnetic Mn of 2.2 g/m3 could exert an HOD up to 1073 kg/d at estimated flow rates if all reduced Mn were oxidized. In Vadnais Lake, the baseline hypolimnetic Mn of 1.1 g/m3 could exert an HOD up to 556 kg/d.
(3)
(3)
The COD potentially exerted by hypolimnetic Fe2+ and Mn2+/3+ is a rough estimate. Nevertheless, hypolimnetic COD exerted by Fe2+ and MN2+/3+ clearly could have been a major contributor to low apparent O2 mass transfer performance observed by Walker et al. (Citation1989) and Cook (2009), and consequent inability of HA to relieve hypolimnetic hypoxia except in late spring and early fall.
Hypoxia during HA operation may also be due to induced SOD. As noted previously, Cook (Citation2009) observed a fourfold increase in oxygen demand of Vadnais Lake sediment cores from quiescent to a mixed water column. The HA systems directed jets of water across the sediment surface. Hydrodynamics of bubble plumes in horizontally stratified water columns suggest that the HO systems do not induce currents of similar intensity across sediment surfaces. As the bubble plume rises there is a continual process of entrainment of water and horizontal detrainment of water along microdensity gradients (Asaeda and Imberger Citation1993, McGinnis et al Citation2004). Thus, only a small fraction of the near-field horizontal flow induced by HO flow occurs close to the sediment surface. In the HA systems, currents at the sediment surface, at least near the aerators, would shear diffusion boundary layers, increasing flux rates of soluble, reduced compounds from the sediment into the water column.
Differences between HA and HO performance are due fundamentally to the physics of oxygen mass transfer. By the law of partial pressures, the saturation of DO in water at the gas–water interface is approximately 5 times higher for a pure O2 bubble than an air bubble. For the same gas volume, O2 mass flux to the water column is commensurately higher for pure O2 than air for a given gas flux rate. The air flux rate to each lake (390 Nm3/d) was about 4.4 times greater than the mean O2 gas flux rate in Pleasant Lake (2015–2018), 8.1 times higher in Vadnais Lake (2012–2018). The combined effect of higher oxygen flux rates and lower induced currents at the sediment surface is a probable cause of superior HO performance over HA at approximately the same design HOD.
Dynamics of Chl-a in each lake are more complex than DO, ORP, Mn, Fe, or TP because phytoplankton dynamics are not entirely dominated by aqueous geochemistry. Phytoplankton biomass, for which Chl-a is a proxy, can also be a function of top-down trophic dynamics. Fish community structure determines zooplankton community size class structure, which in turn determines size class structure or biomass of phytoplankton (Brooks and Dodson Citation1965, Scheffer Citation1998, Wetzel Citation2001).
Fishing is highly restricted in both lakes. The Minnesota Department of Natural Resources fish surveys indicate above-average abundance of top predators (Esox lucius, Zander vitreus) in both lakes (MDNR Citation2019). Negligible fishing pressure may be an unexamined influence on Chl-a concentrations because of high piscivorous fish population preying upon planktivorous fish populations, thereby reducing predation of large-bodied zooplankton and increasing grazing pressure on algae.
Both lakes have been infested with zebra mussels (Dreissena polymorpha) since 2007. Thus, other ecosystem dynamics may influence phytoplankton density and size class structure and water clarity.
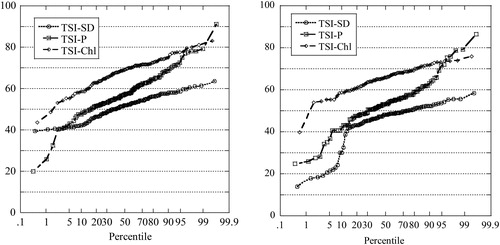
Effects of ecosystem trophic structure on study results can be inferred by observing relationships between trophic state indices (Carlson and Havens Citation2005) across the entire study, 1984–2018 (). Median values and variance are significantly (p < 0.0001) different between TSI(SD), TSI(CHL), and TSI(P). Phytoplankton dominance by large bioparticles can be inferred because TSI(CHL) ≫ TSI(SD) in both lakes. Dominance of large or colonial phytoplankton is caused by strong grazing pressure by large-bodied zooplankton (Bergquist et al. Citation1985). Strong P limitation to primary productivity can be inferred because TSI(CHL) ≫ TSI(P). Thus, in both lakes Chl-a concentrations would be strongly influenced by lowering of TP but probably are also partly controlled by ecosystem trophic structure.
Figure 12. Distribution of trophic state indices 1984–2018 in Pleasant (left) and Vadnais (right), Jun–Sep values.
Whatever the impact of ecosystem structure may be on primary productivity, HO substantially lowered variance of Chl-a in both lakes, and median Chl-a in Pleasant. Utilities prize predictability of raw water quality to facilitate consistent production of high-quality drinking water. This effect of HO therefore is important to reservoir management.
Lowering of surface TP by HO is a likely leading factor in Chl-a results. However, HO substantially changes lake ecology by creating summer hypolimnetic and benthic habitat historically unavailable because of anoxia or hypoxia. Data from this study do not support strong mechanistic explanations of HO-induced changes to Chl-a observed herein. Future studies of the effect of HO on water quality may benefit from analyses of HO-induced changes to habitat indices or invertebrate/fisheries community structure.
Conclusions
Hypolimnetic oxygenation outperformed hypolimnetic aeration in Pleasant Lake and Vadnais Lake in terms of relief of hypoxia, oxidation of Fe and Mn, suppression of internal P-loading, reduction of surface TP, and reduction of extremes of Chl-a concentrations. Differences can be attributed to higher mass transfer efficiency of pure O2 compared to air, and lower currents induced by HO compared to HA.
Addition of FeCl3 also has decisively improved water quality. There must be sufficient Fe3+ in the lakes to bind hypolimnetic and surficial sediment PO43-. Otherwise, O2 transfer to the hypolimnion will not control internal P-loading (Walker et al. Citation1989, Hupfer and Lewandowski Citation2008). Because HO demonstrated more oxidation of Fe than HA for approximately the same design O2 mass transfer rates, HO removed more PO43- from the hypolimnion, lowering TP.
The authors are not aware of a similar study comparing HA and HO performance under the same operating conditions. Because differences in performance are so markedly different, and physical differences so distinct, we strongly encourage that the term “oxygenation” in lake and reservoir management be reserved exclusively for technologies that inject high-purity O2 into the hypolimnion. Technologies using sparged air should be termed “aeration.” Mechanical mixing should be termed “mixing.” These methods all entail some degree of mixing, but the mechanisms of O2 transfer to the hypolimnion or benthic sediments differ. Thus, terminology for these important limnological process engineering methods should align with the engineering process literature where these process mechanical distinctions have long been unambiguously delineated (Metcalf and Eddy Citation2003).
References
- Asaeda T, Imberger J. 1993. Structure of bubble plumes in linearly stratified environments. J Fluid Mechanics. 249:35–57.
- Bergquist AM, Carpenter SR, Latino JC. 1985. Shifts in phytoplankton size structure and community composition during grazing by contrasting zooplankton assemblages. Limnol Oceanogr. 30(5):1037–1045. doi:10.4319/lo.1985.30.5.1037.
- Brooks JL, Dodson SI. 1965. Predation, body size, and composition of plankton. Science. 150(3692):28–35. doi:10.1126/science.150.3692.28.
- Carlson R. 1977. A trophic index for lakes. Limnol Oceanogr. 22(2):361–369. doi:10.4319/lo.1977.22.2.0361.
- Carlson R, Havens KE. 2005. Simple graphical methods for the interpretation of relationships between trophic state variables. Lake Reserv Manage. 21(1):107–118. doi:10.1080/07438140509354418.
- Cook J. 2009. Assessment of Vadnais Lake hypolimnetic aerators. Minneapolis (MN): University of Minnesota.
- Engstrom DR. 2005. Long-term changes in iron and phosphorus sedimentation in Vadnais Lake, Minnesota, resulting from ferric chloride addition and hypolimnetic aeration. Lake Reserv Manage. 21(1):95–105. doi:10.1080/07438140509354417.
- Heiskary S, Swain E. 2002. Water quality reconstruction from fossil diatoms: applications for trend assessment, model verification, and development of nutrient criteria for lakes in Minnesota, USA. Saint Paul (MN): Minnesota Pollution Control Agency.
- Helsel DR, Hirsch RM. 2002. Chapter A3, Statistical methods in water resources. In: Techniques of water-resources investigations of the United States Geological Survey Book 4, Hydrologic analysis and interpretation. Reston (VA): United States Geological Survey.
- Huff NL, House GO. 1916. Copper sulphate treatment of St. Paul, Minnesota, water supply. J AmWater Works Assoc. 3(2):581–621. doi:10.1002/j.1551-8833.1916.tb11927.x.
- Hupfer M, Lewandowski J. 2008. Oxygen controls the phosphorus release from lake sediments—a long-lasting paradigm in limnology. Int Rev Hydrobiol. 93(4–5):415–432. doi:10.1002/iroh.200711054.
- McGinnis DF, Lorke A, Wüest A, Stöckli A, Little JC. 2004. Interaction between a bubble plume and the near field in a stratified lake. Water Resource Res. 40(10):W10206.
- MDNR. 2019. LakeFinder. [accessed 2019 Feb 20]. https://www.dnr.state.mn.us/lakefind/index.html
- Metcalf and Eddy, Inc. 2003. Wastewater engineering, treatment and reuse. 4th ed. New York (NY): McGraw-Hill.
- Murphy PJ, Hicks DB, editors. 1986. In-situ method for measuring sediment oxygen demand. Athens (GA): University of Georgia, Institute of Natural Resources.
- Scheffer M. 1998. Ecology of shallow lakes. London (UK): Chapman & Hall.
- US EPA. 2009. Sediment oxygen demand. Athens (GA): Division SaES.
- Vighi M, Chiaudani G. 1985. A simple method to estimate lake phosphorus concentrations resulting from natural, background, loadings. Water Res. 19(8):987–991. doi:10.1016/0043-1354(85)90367-7.
- Walker W. 2000. Evaluation of water quality controls in the St. Paul Water Utility watershed: analysis of 1984–1999 monitoring data. Saint Paul (MN): St. Paul Regional Water Services.
- Walker WW. 1985. Empirical methods for predicting eutrophication in impoundments; report 3, phase II: model refinements. Vicksburg (MS): US Army Corps of Engineers, Water Ways Experiment Station.
- Walker WW, Westerberg CE, Schuler DJ, Bode JA. 1989. Design and evaluation of eutrophication control measure for the St. Paul water supply. Lake Reserv Manage. 5(1):71–83. doi:10.1080/07438148909354683.
- Wetzel RG. 2001. Limnology: lake and river ecosystems. Amsterdam (The Netherlands): Elsevier Science.
