
Abstract
Welch EB, Bouchard D, Frodge J, Jacoby JM. Stability of Lake Sammamish phosphorus despite land use changes. Lake Reserv Manage. 35:167–180.
Total phosphorus (TP) concentration in Lake Sammamish has not changed significantly following recovery in the 1970s from wastewater diversion, despite increases in developed land and impervious area of 100% and 60%, respectively, from 1980 to 2011. Annual mean, whole-lake TP has remained constant at about 18 µg/L. Summer mean TP and chlorophyll a (Chl-a) have not changed either, and transparency increased from 3.8 m in the 1970s to consistently around 5 m since the 1980s. Reasons for the stability of annual mean TP through the 1980s were (1) hypolimnetic TP had declined by nearly 50% since the 1970s, due to 62% less internal loading; (2) water residence time increased slightly since the 1970s, allowing more settling of particulate matter; and (3) hypolimnetic TP content at turnover did not persist. In 1992, annual TP was predicted to increase from 18 to 28 µg/L if the watershed was developed to 64% from 36% as projected, without substantial forest retention and runoff controls. Developed land increased to half the watershed, but lake TP remained unchanged. Reasons for the continued stable TP over the subsequent 2 decades are that (1) use of land for agriculture ceased; (2) runoff controls were installed; and (3) more forest was retained (64% of the watershed that supplies 70% of the lake’s inflow remained 68% forested). With the implementation of runoff controls, concomitant with increased forest retention and decreased agriculture in the watershed, lake TP and water quality were more stable than originally predicted without these measures.
Stormwater runoff from urbanized land has long been considered an important source of phosphorus (P) contributing to lake eutrophication. Areal yields and concentrations of P from urbanized land are often an order of magnitude greater than from forested land (Omernik Citation1977; McDowell and Omernik Citation1979; Reckhow and Chapra Citation1983). Thus, degraded water quality was an expected outcome of such land use change in a lake’s watershed. There is a concern among some managing lake water quality that best management practices (BMPs), or other runoff protections, cannot effectively either prevent or help a lake to recover from such degradation (Wagner Citation2013; Osgood Citation2017). Thus, watershed development over the last 40 yr was expected to degrade the quality of Lake Sammamish, despite instituting stormwater controls.
Lake Sammamish received high P in storm runoff from developed areas in the 1970s, while only a quarter of the watershed was developed, mostly on the west side. For example, stormwater runoff in 1976–1977 from 3 small residential basins on the lake’s west side contained total phosphorus (TP) ranging from 20 to 490 µg/L with an annual flow-weighted mean of 109 µg/L (Welch et al. Citation1980; Welch and Perkins Citation1980). These results suggest that extensive further development of the watershed could lead to degraded water quality. Projected mass balance modeling of TP in the lake from 1992 conditions indicated that if 64% of the watershed were developed with no protections from runoff, annual mean whole-lake, volume-weighted (v-w) TP would increase to 28 µg/L from a post wastewater diversion level of 17 to 19 µg/L (Perkins et al. Citation1997). That concentration would approach the pre-diversion level of 35 µg/L. These projections initiated watershed protections in the mid-1990s.
Developed land did increase by 40% from 1990, with 50% of the watershed developed by 2011 but not yet to 64% as projected (Welch and Bouchard Citation2014). Understandably, then, water quality in Lake Sammamish was expected to decline from 1992 onward given the projected increase in development and the potential for increased TP content in stormwater runoff reaching the lake. This analysis documents and explains the long-term stability of TP concentrations in Lake Sammamish, and associated water quality.
Study site
Lake Sammamish is located in Washington State in the Pacific Northwest United States (longitude 122°05′W, latitude 47°36′N; ). Watershed land area was 235 km2, and lake area was 19.8 km2 with mean and maximum depths of 16.5 and 32 m, respectively. Western Washington has a maritime climate with annual average precipitation of 99 cm, falling mostly during late fall to early spring.
Figure 1. Lake Sammamish and tributary streams on the east and west side and Issaquah Creek subbasins.
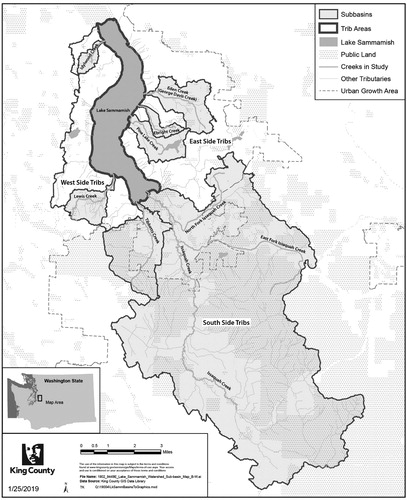
Predominant soils in the basin are a light gray glacial till consisting of clay, sand, silt, and gravel. The watershed was heavily logged at the turn of the century, with today’s remaining forest, mostly in the Issaquah Creek basin, in second-growth Douglas fir, western red cedar, alder, and some big leaf maple. The highest sediment accumulation rate (0.67 cm/yr) occurred during 1932–1944, which is the period following the greatest rate of deforestation and probably the most erosion. Sedimentation during the subsequent 30 yr was 0.32 cm/yr (Birch Citation1976: lead-210 dating).
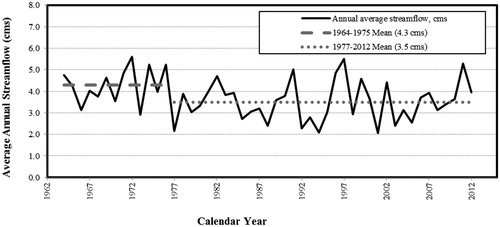
Issaquah Creek drains the largest part (64%) of the watershed and represents 70% of the lake’s surface inflow, with the remainder from 12 minor tributaries from the east and west sides (Moon Citation1973; ). Annual mean flow decreased by about 20% on average since 1976, as did winter mean flow, though still variable year-to-year, and there was no long-term trend in mean flow (). The decrease coincided with a shift in the Pacific Decadal Oscillation (PDO) from a cool/wet phase to a warm/dry phase in more recent years (Welch and Bouchard Citation2014). Prior to the decrease in the 1970s, average flow of Issaquah Creek was 4.3 m3/s, and it was 3.5 m3/s for the next 3 decades (). Expanding inflow to the whole watershed, since Issaquah Creek supplies 70% of the lake’s inflow (1/0.7), resulted in an increase on average of the lake’s residence time from 1.7 to 2.1 yr, although it varies from year to year as inflow varies ().
Figure 2. Annual average Issaquah Creek flow (calendar year) from 1964 through 2012.
Land use change
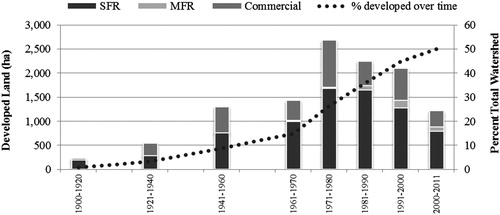
Developed land more than doubled between 1970 and 1990, from 15 to 36% of the total watershed (). After 1991, land developed as single (0.1–0.2 ha) and multiple family housing and commercial use continued to increase, and by 2011, 50% of the watershed was devoted to those land uses () with a concomitant 50% increase in impervious surface. The proportionate areas developed in the 3 subbasins were 61% on the west side, 72% on the east side, and 41% in the Issaquah Creek basin.
Figure 3. Total single family, multifamily, and commercial developed land in the Sammamish watershed from 1900 to 2011 based on total “as-built” area in hectares for the specified time period.
Watershed protections
Watershed protections were instituted in the mid-1990s to reduce TP in stormwater runoff from new urban development. Runoff controls (i.e., retention basins) were intended to retain P bound to particulate matter, with a nominal removal efficiency for TP of around 50% for wet retention ponds. A review citing 34 sources nationally showed a mean TP removal of 55% (±20% SD) (International Stormwater BMP database Citation2014). Two wet ponds on the west side with retention times of 1 week and 1 d removed sizable fractions of SRP and bioavailable P, as well as TP: more than 50% for the longer retention wet pond (Comings et al. Citation2000). However, most installed stormwater controls were designed for detention, having only short retention times and usually dry. Of 150 stormwater ponds on the lake’s west side watershed, 145 were for detention only, also in addition to 81 vaults for detention (Shuster J, City of Bellevue, Stormwater Manager, 2017, pers. comm.). One unit, designed with added P removal in runoff from a 100-ha development, retained 39% of TP and 28% of SRP (BUD Citation1999). The Issaquah Creek watershed had 217 operative stormwater units, most of which were for volume runoff control but also including 19 biofiltration swales and 17 limited impact systems (Walker H, City of Issaquah, WA, Manager Storm and Sewer Operations, 2017, pers. comm.). The detention facilities were designed to reduce runoff rate and erosion. The density of units in developed areas are 18 and 42 ha/unit on the west side and Issaquah Creek portions, respectively. Detention facilities were installed on the east side as well, but quantifiable data are currently unavailable.
Based on zoning, urbanization did not increase in rural areas following establishment of urban growth boundaries (UGB) and refinement of the urban growth area as part of a 1994 King County Comprehensive Plan. The plan included special designations for the protection of farmed areas and provisions for housing on larger lots in rural areas, forest production districts, and open space areas for protection of the natural environment. Forest land was acquired in the upper Issaquah Creek basin, although forest cover declined inside the UGB, due to development in urban areas.
Other regulatory changes may have resulted in less TP loading to tributaries to the lake. These changes included bans in 2007 on P in dish soap, dishwasher detergent, and laundry detergent, which would otherwise be released in rural areas from on-site septic systems, which can yield P in this area (Jacoby et al. Citation1997). The changes also included the implementation of the King County Critical Areas Ordinance, which intended to limit development in riparian areas along tributaries to the lake and on steep slopes that might erode and result in sediment and TP transport to the lake.
Methods
Sampling
Water samples collected at a deep (27 m) site toward the southern end of the lake were used in this analysis because consistent monitoring of the lake’s quality began there in 1964–1966 (average 32 trips/yr) by the Municipality of Metropolitan Seattle (METRO; Isaac et al. Citation1966). Sampling at that site was conducted by the University of Washington from 1970 through 1975 at least twice monthly in spring–summer and monthly and often twice monthly in winter (average 21 trips/yr; Welch Citation1977; Welch et al. Citation1980). METRO/King County restarted monitoring the lake at that site at about the same frequency in summer 1979. Beginning in 1981, this site was sampled monthly, and some years twice monthly, during winter (Dec–Feb) and twice monthly the rest of the year (average 18 trips/yr). Samples for alkalinity, TP, and soluble reactive phosphorus (SRP) were collected by METRO/King County at various depths through the water column using Niskin bottles. Specific conductance (SC) was determined with a Hydrolab unit at 1-m intervals and transparency with a standard Secchi disk. During 1970–1973, samples for TP were collected with a Van Dorn bottle from 4 depths in the photic zone (1 sample each from surface, 1 m, 2 m, and 1 sample up to 10 m), and 2 depths (17 and 27 m) in the hypolimnion during 1970–1973 and from surface, 5, 10, 15, 20, and 22 m during 1974–1975 (Welch Citation1977; Welch et al. Citation1980).
Sampling for chlorophyll a (Chl-a) varied as follows. Water from 2 depths (surface and bottom of photic zone) in the epilimnion was analyzed for Chl-a in earlier years (Welch Citation1977; Welch et al. Citation1980). From 1979 to 1994, samples for Chl-a were collected from a depth of 1 m. From 1994 to 2004, the water column was analyzed in a composite from 1 m to the Secchi depth. After 2004, composited samples from the surface to 10 m were collected with a weighted 1.6-cm diameter Tygon tube. Differences in concentrations between the composited methods were noted but were not expected to affect long-term trends in seasonally averaged concentrations (King County Citation2004). Comparability of these sampling procedures is supported by the consistent Chl-a:TP ratio of 0.3 observed since the mid-1970s.
Monthly surface grab samples (about 12 cm below the surface of the deepest part of the stream segment) were collected by King County at the mouths of the 7 tributaries to Lake Sammamish for nutrients and total suspended solids (TSS). Specific conductance, temperature, and dissolved oxygen (DO) were measured using a calibrated Hydrolab unit. Continuous gauges measured flow for several of the creeks. Period of record varies for each creek, with Issaquah Creek having the longest consistent record beginning in 1980.
All stream and lake data reported are time-weighted by calculating the monthly mean when more than 1 sample was collected in a given month. Volume-weighted (v-w) concentrations were calculated for the epilimnion from 0 to 10 m and for the hypolimnion >15 m. The hypolimnion volume used was 98 × 106 m3 with a mean depth of 8.17 m. The whole-lake volume was 327 × 106 m3 with a mean depth of 16.5 m and maximum depth of 32 m, and the lake area was 19.8 km2.
Analytical procedures
TP analyses in the 1960s were with sulfuric acid for total soluble P (TSP; Isaac et al. Citation1966). These values were corrected by an average TP/TSP ratio of 1.2 determined by a comparative analysis. TP was determined by persulfate digestion and ascorbic acid in the 1970s according to Strickland and Parsons (Citation1968), using a 10-cm light path with detection at 1 µg/L. TP analysis changed in 1998 from a single to a combined digestion that resulted in a bias toward lower TP. Comparison with results using the previous and subsequent methods produced an r2 = 0.99 and a correction factor of 1.262 to increase TP determined after July 1998.
Analyses for alkalinity, SRP, and TP were performed according to standard methods during the 1980s and 1990s (Eaton et al. Citation2005). TP was determined using persulfate digestion and the ascorbic acid method (SM 4500-P-BE). SRP was determined following filtration (SM 4500-P-F). Detection limits were 2 µg/L for SRP and 5 µg/L for TP.
Chl-a was determined spectrophotometrically according to standard methods in the 1960s, and in the 1970s by the fluorometric technique according to Strickland and Parsons (Citation1968). During the 1980s to mid-1990s, Chl-a was determined according to standard method procedures (SM 10200-H) with a detection limit of 0.5 µg/L. However, side-by-side comparisons of an improved extraction method in 1996 resulted in an increase in Chl-a of 14%. Thus, between 1979 and 1996, Chl-a concentrations were increased by that fraction for long-term comparison. The validity of that adjustment is indicated by the consistent Chl-a:TP ratio of 0.3 since the mid-1970s.
Sediment-P release rates were determined from the rate of buildup in hypolimnetic TP below a depth of 15 m. Rates determined in this manner were like those from in vitro sediment cores under anoxic conditions (Welch Citation1977), a similarity also observed by others (Nürnberg Citation1987). Rates for all data during 1964–2011 were calculated from regression lines of v-w hypolimnetic TP versus time, generally from August, when hypolimnetic TP began to increase, until turnover.
A nonparametric seasonal Kendall test was used to determine whether observed trends in lake TP were unlikely to be due to random variation (Helsel and Frans Citation2006). A standard P value of <0.05 was used to determine if the null hypothesis should be rejected. The P values and relative significance reported are as follows: very strong P < 0.01; strong 0.01 < P < 0.05; weak 0.05 < P < 0.10; not significant P > 0.10.
Development in the watershed over time was evaluated in two ways. Total developed land from 1900 to 2011 was based on as-built area for each specified decadal period (e.g., 1900–1920, 1921–1940, 1941–1960, 1960–1970, 1971–1980, 1981–1990, 1991–2000, 2001–2011). Single-family, multifamily residential, and commercial residential parcels were selected from the countywide parcel dataset using the Property Type attribute (Welch and Bouchard Citation2014). Impervious area was also used to evaluate changes in land use between 1991 and 2011. This analysis was conducted using the 1991 and 2011 NOAA Coastal Change Analysis Program (C-CAP) data with land classes grouped as “developed open space” and “high, medium and low intensity developed.” The C-CAP data were also used to assess forest cover in 1992 and 2011.
Results
Phosphorus
Annual mean whole-lake v-w TP declined from an average pre-diversion concentration of 32 µg/L in 1964–1966, to an average of 26 µg/L during the first 5 yr after wastewater diversion in 1968 (). Developed land was only about 15% of the watershed then and mostly on the west side (). The decline continued, reaching an apparent equilibrium of 17–19 µg/L through the 1980s, but then gradually increased through the mid-1990s to a high of 24 µg/L in 2006 (). Annual, whole-lake TP subsequently returned to the 17–19 µg/L level and has remained so since the late 1990s, as developed land reached 40%.
Figure 4. Mean annual whole-lake volume-weighted TP and SRP. TP data compared with lake management goal of 22 µg/L and projected full build-out (Perkins et al. Citation1997). Arrow indicates wastewater diversion in 1968. Note: Data for 1964–1966 from METRO (Isaac et al. Citation1966); 1970–1975 from University of Washington (UW) Department of Civil Engineering (Welch Citation1977, Welch et al. Citation1980); 1982–2011 from King County (Welch and Bouchard Citation2014). Summer data only in 1981 so not included in annual means. Significant declining TP 1964–2011 (P < 0.01) and SRP 1982–2011 (P < 0.01). No significant trends in TP 1982–2011 or 1995–2011 (P > 0.10).
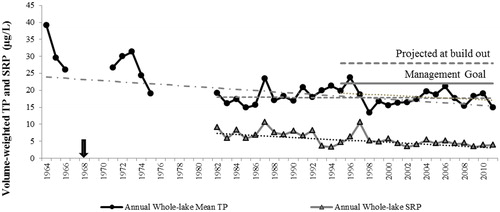
While the long-term trend is significant (P < 0.01), there is no significant trend (P > 0.10) in annual mean TP since either 1982 or 1995. The long-term mean during 1982–2016 was 17.7 ± 3.3 µg/L. Thus, annual, whole-lake TP has been consistently averaging about 18 µg/L since recovery from wastewater diversion, while developed land doubled. Development-driven increases expected since 1992 did not occur, either as projected or as as-built land use increased. The long-term consistency of annual TP is also shown with 6-yr group means with little difference over the past 30 yr ().
Table 1. Mean annual whole-lake, winter whole-lake, summer hypolimnion (Jun–turnover), and summer epilimnion (Jun–Sep) total phosphorus (TP) during equivalent periods. All values are volume-weighted (µg/L). Wastewater diversion was in 1968.
Summer mean v-w hypolimnetic TP also declined significantly over the long term (P < 0.01) since wastewater diversion, as well as since 1981 (P < 0.05; ). Mean v-w hypolimnetic TP decreased from nearly 60 µg/L before diversion to less than 20 µg/L currently (). Although concentrations were lower since 2005, there was no significant trend from 1995 to 2011 (P > 0.10). The long-term decrease was due to a gradual decline in sediment-P release rate: 76% since before diversion and 62% since the 1970s after diversion (). The rate has averaged about 3 mg/m2 per day since the 1990s with no trend.
Figure 5. Volume-weighted mean summer hypolimnetic (Jun–turnover) TP and SRP and maximum TP (triangles). Arrow indicates wastewater diversion in 1968. Data for 1964–1966 from METRO (Isaac et al. Citation1966); 1970–1975 from UW Department of Civil Engineering (Welch Citation1977, Welch et al. Citation1980); 1982–2011 from King County (Welch and Bouchard Citation2014). Significant declining TP 1964–2011 (P < 0.01) and 1981–2011 (P < 0.05); SRP 1982–2011 (P < 0.01).
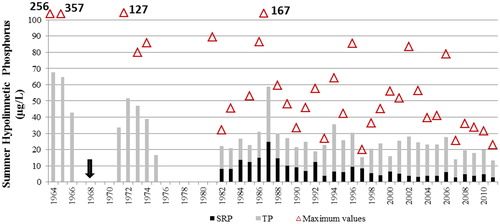
Table 2. Mean (± SD) sediment P release rates in mg/m2 per day for equivalent time periods. Wastewater diversion was in 1968.
Annual mean v-w TP was affected by the magnitude of hypolimnetic TP. Highs and lows in the equivalent-year annual means, and in individual years, have shown an association with hypolimnetic TP (r2 = 0.72; ). That association is not surprising, because maximum hypolimnetic TP had reached over 300 µg/L before wastewater diversion, and near 100 µg/L in the 1970s after diversion. The decrease in 6-yr mean hypolimnetic TP concentrations of 18.1 µg/L since the 1970s amounts to a calculated decrease in internal load of 1774 kg annually. That represents 64% of the 8.5 µg/L (2780 kg) decrease in annual mean v-w TP since the 1970s (). Had hypolimnetic TP not decreased, annual mean v-w TP would be closer to 23 instead of 17.9 µg/L during the 2005–2011 period.
A large fraction of TP load to the lake usually occurred during the high-rainfall period, which is typically during winter (Nov–Mar) in the Pacific Northwest (PNW). During high-rainfall periods, half the annual load has entered the lake in a few days or weeks (Welch Citation1977; Perkins et al. Citation1997). Thus, increased stormwater runoff from increased development would be expected to have much more effect on lake TP in the winter. However, the 6-yr winter mean v-w TP has changed little since the mid-1980s, ranging from 23 to 26 µg/L, with no trend (P > 0.10) since 1982, and has remained around 23 µg/L since the mid-1990s.
Also, the high hypolimnetic TP had only a short-term effect on winter TP because iron buildup to as high as 1 mg/L in the anoxic hypolimnion, in concert with TP, removed much of that TP during turnover when the water column became oxygenated (Welch Citation1977; Welch et al. Citation1980). Before diversion of wastewater, when hypolimnetic TPs were much higher, the post-turnover decrease was 80% in 1964 (123 to 25 µg/L) and 93% in 1965 (256 to 19 µg/L; King County Citation1995). For years with adequate data (n ≥ 12) during the 1970s and 1980s, the average maximum v-w whole-lake TP prior to turnover (usually in Nov) was 38.5 µg/L. Following turnover, average whole-lake v-w TP decreased by December to an average of 21.7 µg/L or 44% (± 20% SD). That fractional loss decreased between 1990 and 2011 when pre-turnover whole-lake TP exceeded post-turnover TP only half the time. Furthermore, the average whole-lake TP decrease for those years was only 9%. The reduced loss of TP at turnover was due to declining hypolimnetic TP maxima (). Thus, hypolimnetic TP had minimal effect on annual TP and its apparent stability since 1990.
Summer (Jun–Sep) epilimnetic mean TP did not show a clear pattern of recovery, as did annual mean TP, following wastewater diversion (). Pre-diversion means ranged from 5 to 15 µg/L, while half of the post-diversion means were above 15 µg/L. Some of the pre–post diversion difference may be due to different pre-diversion analytical methods when only TSP was determined. However, epilimnetic TP showed no significant (P > 0.10) trend since the 1980s, ranging from 7.6 to 20.1 µg/L, with a long-term mean of 12 µg/L (; ).
Figure 6. Mean summer (Jun–Sep) epilimnetic TP and SRP concentrations. Arrow indicates wastewater diversion in 1968. No significant trends.
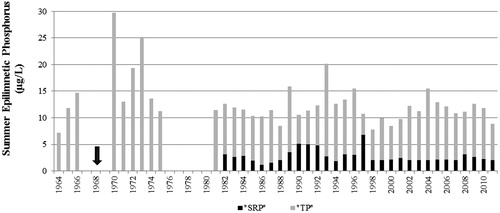
Annual whole-lake and summer hypolimnetic mean SRP concentrations have shown significant (P < 0.01) decreased trends since the 1980s ( and ). The progressive and significant long-term decrease in summer hypolimnetic SRP is consistent with the decreased release rate of P, which is mostly as SRP, from the sediments since the 1980s (). Epilimnetic SRP has mostly remained less than 5 µg/L, with no significant trend (P > 0.10) since the 1980s ().
Alkalinity and specific conductance
Annual mean alkalinity and SC increased approximately 16% and 23%, respectively, in the lake since the 1980s (). Specific conductance, which is composed of largely conservative (i.e., nonreactive) substances, increased only slightly in Issaquah Creek, the main inflow (70%) to the lake over the same 35-yr time period, from about 105 to 115 μS/cm. However, annual mean SC in 2 eastside basin creeks, Ebright (1996–2008) and Eden (1987–2008), and 2 west-side basin creeks, Idylwood (1995–2008) and Lewis (1995–2009), significantly (P < 0.10–0.05) increased by an average of 20%. The increases in SC in the smaller creeks were much more than the principal inflow, Issaquah Creek, and over a shorter period (Welch and Bouchard Citation2014). These 4 small streams, entering the lake from the more developed east and west sides, had an average SC of 157 μS/cm (± 40 SD), while the lake and Issaquah Creek averaged only 105 and 115 μS/cm, respectively. The total of 6 monitored east- and west-side streams averaged 164 μS/cm (± 42 SD). Also, the average increase in SC in the 6 east- and west-side streams was 18% (± 11% SD) between 1995 and 2009, nearly as much as in the lake (23%). The long-term, 30-yr increase in SC in Issaquah Creek was only about half that, and only about 5% between 1995 and 2008. The relatively small increase in SC in Issaquah Creek was probably due to the low portion of impervious cover (6.6%) in the watershed (). On the other hand, impervious area increased by 98% on the east side between 1991 and 2011, covering 19% of the area, and increased 23% on the west side, covering 23% of the area ().
Figure 7. Mean annual whole-lake specific conductance (µS/cm) and alkalinity (mg/L CaCO3). Alkalinity for 1984 and 1989 not included due to insufficient data. Alkalinity averaged 33 mg/L in the early 1970s (Welch Citation1977). Significant increasing trends for both parameters (P < 0.01).
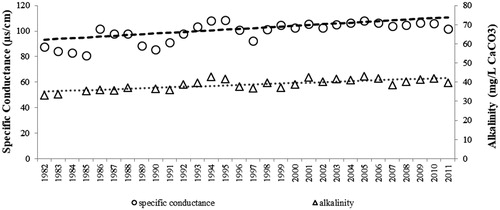
Table 3. Impervious area (ha) in the east, west, and Issaquah basins in 1991 compared with 2011 using the 1991 and 2011 NOAA Coastal Change Analysis Program (C-CAP) data.
Trophic state
Summer mean epilimnetic TP remained constant over the past 4-plus decades, as well as showing no significant (P = 0.10) trend, despite an observed increase in developed land of 100% since the 1980s (; ). Total P was higher in the 1970s, following diversion of one-third of the lake’s TP load in 1968, and then declined to its current levels by the 1980s (). In contrast, Chl-a decreased and Secchi transparency increased following diversion but only by about 20% (). Since the mid-1970s, summer Chl-a has averaged less at about 3 µg/L, and the Chl-a:TP ratio was about 0.3, which was close to the world average for most mesotrophic lakes of 0.35 (Figure 6.35 in Welch and Jacoby Citation2004). The ratio was lower (0.2) in 1971–1975 following wastewater diversion.
Table 4. Mean (±SD) summer (Jun–Sep) epilimnetic TP and Chl-a in µg/L, and Secchi disk transparency (m) during equivalent time periods. Pre-1995 data from King County (Citation1995). Wastewater was diverted in 1968.
Transparency was also consistent since the 1980s, averaging 5 m, with maxima of 6–8 m (). The average Chl-a of 3.1 µg/L since the 1970s should have resulted in an average transparency of 3.6 m, 1.4 m less than observed (Carlson Citation1977). In the 1960s and 1970s, expected transparency from Chl-a was only 0.5 m less than observed. Transparency may have been greater than expected from Chl-a because water residence time averaged 23% greater since the 1970s than before, which would have allowed more time for settling of non-algal particulate matter entering with stormwater runoff. Based on transparency, the lake has consistently been oligotrophic since the 1970s, and meso-oligotrophic based on Chl-a and TP (Nürnberg Citation1996).
Discussion
Annual mean, whole-lake TP has remained stable since the 1970s. Overall stability in TP has occurred despite marked land use change in the watershed, with residential and commercial development roughly doubling since the 1980s and impervious surface increasing by 60% since 1991. Nearly two-thirds of the long-term stability in annual whole-lake TP can be explained by reduced hypolimnetic TP as the sediment-P release rate gradually declined (72%) since the 1970s following wastewater diversion. Continued decline in internal loading over a decade or two after wastewater diversion was not uncommon in recovering lakes (Cooke et al. Citation2005; Jeppesen et al. Citation2005).
Some of the resistance of lake TP to increase with such markedly increased development through the 1980s may be attributed to the lake’s iron cycle. During anoxia, iron has reached concentrations in the hypolimnion of 1 mg/L or more. Total v-w iron content steadily increased from about 0.2 to 0.9 mg/L during October through November in 1973 as DO was <1 mg/L. Iron increased to 0.4 mg/L during that period in 1973 and 3.4 mg/L in 1974 (Welch Citation1977). Upon fall destratification and aeration, the high iron was oxidized and bound P, removing a large fraction of P from the water column. That removal of P averaged 44% during the 1970s and 1980s (Welch Citation1977; Welch et al. Citation1980; Perkins et al. Citation1997). Thus, the high hypolimnetic P concentrations during stratification were largely unavailable for algal uptake the following spring in this monomictic lake. That process may have compensated, to some extent, for an increase in TP in storm runoff in nonstream sources (e.g., pipes and nearshore runoff) from greater areas of developed urban land, which occurs predominantly during fall and winter mixed oxic conditions in the lake. The removal of hypolimnetic P by iron may also explain the relative stability of summer Chl-a and TP (i.e., trophic state) over the long term, even before and after wastewater diversion (one-third reduction in TP loading) and greatly increased urbanization of the watershed. However, the relative effect of iron diminished after the 1980s as internal loading and maximum hypolimnetic TP decreased. Therefore, iron was relatively unimportant at maintaining stable TP during and after the 1990s. The decrease in the iron process was not due to less anoxia, because the areal hypolimnetic oxygen deficit (AHOD) has also shown no trend, even after wastewater diversion, averaging 0.56 ± 0.11 g/m2 per day for 1981–2011, and ranging from 0.412 to 0.747 (Welch and Bouchard Citation2014).
Also, some of the explanation for long-term TP stability may have been due to slightly longer water residence time since the 1970s, which would allow more time for particulate matter to settle, including particulate P. Water residence time increased about 23% during the past 3 decades, from 1.7 to 2.1 yr, which could have amounted to a decrease of about 4 µg/L in annual mean TP (Welch and Bouchard Citation2014). That prospect is supported by greater mean summer transparency despite no change in Chl-a since the 1970s.
Increased development with forest removal and soil disturbance and more impervious surfaces in urban areas resulted in increases in SC and alkalinity in lakes (Edmondson Citation1994). In Lake Sammamish, increased development (50% increase since 1991) has likely led to the observed 23% increase (P < 0.01) in SC in the lake since the 1980s (), as was observed in nearby Lake Washington (Edmondson Citation1994). Alkalinity probably increased also because cations and anions in alkalinity increased and are also responsible for part of electrical conductance. The higher SC in the 6 monitored inflow streams (average 164 μS/cm) than in the lake (average 105 μS/cm) suggests that lake SC has been influenced more by runoff from the highly developed east and west sides than from the largely forested Issaquah Creek basin (average 115 μS/cm). Alkalinity has also increased, but by a lesser amount (16%). The effect of watershed development on alkalinity was also observed in Lake Washington, where alkalinity increased from 27 mg/L in 1956 to 40 mg/L in the early 1990s (Edmondson Citation1994).
Calcium and other major ions that contribute strongly to SC are weathered from soil and rock mixtures and bedrock in the watershed due to their dissolution by the acidity from atmospheric carbonic acid in precipitation (Stumm and Morgan Citation1970; Wright and Henriksen Citation1978). Precipitation pH in the local area is around 5, which is slightly lower than natural due to nitrogen oxides in the urban area and natural sulfur compounds from the ocean (Duncan et al. Citation1986; Larson TV, professor, University of Washington Department of Civil and Environmental Engineering, Seattle, WA, 7 Apr 2014 and 17 Dec 2015, pers. comm.). Soil disturbance and imperviousness in urbanized areas expose greater surface area to weathering enhanced by acidic precipitation. Many of the impervious surfaces are concrete, a large component of which is calcium, which is a large part of SC and alkalinity, and concrete is known to weather (Davis et al. Citation2010; Kaushal and Belt Citation2012).
Thus, runoff from increased urban development has apparently affected the lake given the observed increase in SC and alkalinity. However, these constituents are composed of conservative substances, which would not settle in stormwater retention ponds or in the lake or be much affected by detention units designed to reduce erosion. Particulate P tends to settle if retention time is sufficient, and erosional inputs were likely reduced by stormwater detention units, so stormwater runoff controls, which were required in new development starting in the mid-1990s, may be responsible for some of the more recent stability of annual TP. The extent and effectiveness of installed runoff controls have not been quantified. Thus, there is no direct evidence of their role in recent TP stability, although annual mean TP in Issaquah Creek, which represents 70% of the lake’s inflow, has remained stable at 40–50 µg/L (mean 42 µg/L), with no significant (P > 0.10) trend over the past 3 decades. Also, there was no trend in other minor streams since the 1980s, despite increased development (Welch and Bouchard Citation2014). Nevertheless, mean TP in the 6 minor streams draining the east- and west-side basins was much higher at 79 µg/L (± 46 SD), probably reflecting a greater fraction (72% versus 41%) of developed area.
More forest retention than projected may be another important reason for annual TP remaining stable since the mid-1990s. Much of the Issaquah Creek sub-watershed, which is 64% of the total, was still 68% forested, based on C-CAP data in 1992 and 2011 (Welch and Bouchard Citation2014). The forest fraction in the Issaquah Creek basin has changed little (<1%) during the past 20 yr, which is partly due to the goal of 65% forest retention and no development in rural areas instituted in the mid-1990s through the interjurisdictional Lake Management Plan (Entranco and Herrera Environmental Consultants Citation1996). Also, while impervious surface nearly doubled in the Issaquah Creek drainage, only 6.6% of its total area was impervious, compared to 19.4 and 24.7% on the more developed east and west sides. Forest retention also contributed to a lower yield of TP from the Issaquah Creek watershed of 31 mg/m2 per year, versus 44 mg/m2 per year from the east and west sides, using mean TP in respective inflow streams and the mean flow of Issaquah Creek as 70% of total inflow.
Forest retention may be another part of the explanation for why SC has increased only slightly in Issaquah Creek, in contrast to the lake and in streams draining the highly developed urban and much more impervious east and west sides (Welch and Bouchard Citation2014). Those subbasins have only 2 and 14% of original forest remaining, respectively, as determined by impervious area.
Agricultural land use has also greatly declined since the mid-1990s; from 872 ha in the Issaquah Creek watershed to zero by 2003 (Brett et al. Citation2005; Ellison and Brett Citation2006). Similarly, land used for agriculture on the lake’s east side, which was 171 ha in 1994, has been developed and only 2% has remained forested (Welch and Bouchard Citation2014). While agricultural land was a small fraction of these sub-watersheds, only 6.1 and 2.6% on the east and west sides, respectively, their conversion to urban use may have offset some of the increased TP load. Stream TP has also decreased elsewhere (Ontario) as agriculture was reduced by urbanization (Raney and Eimers Citation2014).
The continued stability of lake TP, despite increased development, was not predicted by the TP mass balance model based on 1992 zoning and calibrated runoff coefficients. The model performed well against observed data and increasing zoned development through 1992 (Perkins et al. Citation1997). Lake TP did not increase in response to further increased urban development as projected, partly because as-built development by 2011 was less (22%) and forest retention greater (16%) than projected from 1992 zoning to build-out. Thus, loading would not have increased as projected. Also, runoff coefficients that were calibrated and verified for 1992 zoned conditions probably changed, because as-built development in 1990 was slightly more (14%) and forest less (13%) than 1992 zoned development. Coefficients may have changed further as retained forest cover matured with increased canopy cover and detention facilities were installed, both of which would have reduced the rate of runoff.
That TP loading did not increase is evidenced by lack of significant change in TP concentrations in stream inflows since the 1980s. If stream TP concentrations did not change and groundwater inflows were assumed to have remained relatively small contributors (7%) to the total TP load, then loading probably did not change, because average annual inflow volumes have not changed in the principal inflow, Issaquah Creek. Even if inflow volumes were larger in more developed areas drained by east and west side streams, producing higher mass loading, such increased loading would not have raised lake TP above the stream inflow concentration. In effect, lake concentration is determined by the volume-weighted inflow concentration (Brett and Benjamin Citation2008). However, runoff from increased development did affect the lake as shown by increased conservative substances indicated by SC and alkalinity. Why inflow TP concentrations did not increase may well be due to the greater forest retention than projected, tree canopy increase, and other instituted runoff controls as described above.
Conclusions
Increased urbanization did not lead to the degradation of lake water quality in the case of Lake Sammamish. Instead, the recovery from wastewater with reduced internal loading and the inherent stabilizing characteristics (anoxia and iron) maintained lake quality as watershed development increased through the 1980s. Subsequent institutionally enacted controls on development and stormwater (e.g., installation of stormwater runoff controls, reduction in agricultural land uses, forest retention in the lake’s major watershed) since the mid-1990s probably served to protect the lake from increased urbanization and stormwater TP. Lack of change in TP content of the principal inflow and minor streams since the 1980s is evidence that these measures were effective.
Acknowledgments
We thank the King County Environmental Laboratory for water quality sampling and analysis, as well as the staff in King County Science and Technical Support Section, especially Rachael Gravon and Andrew Miller for data analysis. Sally Abella, Curtis DeGasperi, Jim Simmonds, Kate O’Laughlin, and Dave White provided significant contributions with their technical reviews and Rich Horner provided data on stormwater treatment. Three anonymous reviewers provided constructive comments that improved earlier drafts of this article.
Funding
Project funding for sampling, analysis and staff time was through the Major Lakes Monitoring Program, King County Department of Natural Resources and Parks.
References
- Bellevue Utilities Department and Shapiro and Associates, Inc. (BUD). 1999. Lakemont Storm Water Treatment Facility Monitoring Report, Final Report. Partially Funded by Washington Department of Ecology, Stormwater Soil Infiltration Monitoring Study.
- Birch PB. 1976. The relationship of sedimentation and nutrient cycling to the trophic status of four lakes in the Lake Washington drainage basin [dissertation]. Seattle (WA): University of Washington.
- Brett MT, Arhonditsis GB, Mueller SE, Hartley DM, Frodge JD, Funke DE. 2005. Non-point-source impacts on stream nutrient concentrations along a forest to urban gradient. Environ Manage. 35(3):330–341. doi: 10.1007/s00267-003-0311-z.
- Brett MT, Benjamin M. 2008. A reassessment of lake phosphorus retention and the nutrient loading concept in limnology. Freshwater Biol. 53:194–211.
- Carlson RE. 1977. A trophic state index for lakes. Limnol Oceanogr. 22(2):361–368.
- Comings KJ, Booth DB, Horner RR. 2000. Stormwater pollutant removal by two wet ponds in Bellevue, Washington. J Environ Eng. 126(4):321–330. doi: 10.1061/(ASCE)0733-9372(2000)126:4(321).
- Cooke GD, Welch EB, Peterson SA, Nichols SA. 2005. Restoration and Management of Lakes and Reservoirs. 3rd ed. Boca Raton (FL): CRC Press.
- Davis PJ, Wright IA, Jonasson OJ, Findlay SJ. 2010. Impact of concrete and PVC pipes on urban water chemistry. Urban Water J. 7(4):233–241. doi: 10.1080/1573062X.2010.484502.
- Duncan CL, Welch EB, Ausserer W. 1986. The composition of precipitation at Snoqualmie Pass and Stevens Pass in the central Cascades of Washington State. Water Air Soil Pollut. 30:217–229. doi: 10.1007/BF00305192.
- Eaton AD, Clesceri LS, Rice EW, Greenberg AE, Franson MAH. 2005. Standard methods for the examination of water and wastewater. 21st ed. Washington (DC): American Public Health Association, Water Environment Federation and American Water Works Association.
- Ellison ME, Brett MT. 2006. Particulate phosphorus bioavailability as a function of stream flow and land cover. Water Res. 40(6):1258–1268. doi: 10.1016/j.watres.2006.01.016.
- Edmondson WT. 1994. Sixty years of Lake Washington: curriculum vitae. Lake Reserv Manage. 10(2):75–94. doi: 10.1080/07438149409354178.
- Helsel DR, Frans LM. 2006. Regional Kendall test for trend. Environ Sci Technol. 40(13):4066–4073.
- Entranco and Herrera. Environmental Consultants. 1996. Lake Sammamish Water Quality Management Plan – 1996. Prepared for King County, City of Bellevue, City of Redmond, and City of Issaquah (WA).
- Isaac GW, Matsuda RI, Walker JR. 1966. A limnological investigation of water quality conditions in Lake Sammamish. Seattle (WA): METRO.
- International Stormwater BMP database. 2014. BMP performance summaries and statistical appendices. http://www.bmpdatabase.org/performance-summaries.html.
- Jacoby JM, Welch EB, Anderson CW. 1997. Pine Lake response to diversion of wetland inflow. Lake Reserv Manage. 13(4):302–314. doi: 10.1080/07438149709354321.
- Jeppesen E, Sondergaard M, Jensen JP, Havens KE, Anneville O, Carvalho L, Coveney MF, Deneke R, Dokulil MT, Foy BOB, et al. 2005. Lake responses to reduced nutrient loading: an analysis of contemporary long-term data from 35 case studies. Freshwater Biol. 50(10):1747–1771., doi: 10.1111/j.1365-2427.2005.01415.x.
- Kaushal SS, Belt KT. 2012. The urban watershed continuum: evolving spatial and temporal dimensions. Urban Ecosyst. 15(2):409–435. doi: 10.1007/s11252-012-0226-7.
- King County. 1995. Lake Sammamish total phosphorus model. Prepared by W.W. Perkins for METRO-King County Surface Water Management. Seattle (WA).
- King County. 2004. Major lakes phytoplankton study – comparison of composite sampling techniques. Prepared by Curtis DeGasperi, Water and Land Resources Division. Seattle (WA).
- McDowell TR, Omernik JM. 1979. Nonpoint source-stream nutrient level relationships: a nationwide study. EPA-60013-79-103.
- Moon CE. 1973. Nutrient budget following wastewater diversion from a mesotrophic lake. [master’s thesis]. Seattle (WA): University of Washington.
- Nürnberg GK. 1987. A comparison of internal loads in lakes with anoxic hypolimnia: laboratory incubation versus in situ hypolimnetic phosphorus concentration. Limnol Oceanogr. 32(5):1160–1164. doi: 10.4319/lo.1987.32.5.1160.
- Nürnberg GK. 1996. Trophic state of clear and colored, soft-and-hardwater lakes with special consideration of nutrients anoxia, phytoplankton and fish. Lake Reserv Manage. 12(4):432–437. doi: 10.1080/07438149609354283.
- Omernik JM. 1977. Nonpoint source stream nutrient level relationships: a nationwide study. Corvallis (OR): U.S. EPA, Environmental Research Laboratory. EPA/600/3-77/105.
- Osgood RA. 2017. Inadequacy of best management practices for restoring eutrophic lakes in the United States: guidance for policy and practice. Inland Waters. 7(4):401–407. doi: 10.1080/20442041.2017.1368881.
- Perkins WW, Welch EB, Frodge J, Hubbard T. 1997. A zero degree of freedom total phosphorus model 2. Application to Lake Sammamish, Washington. Lake Reserv Manage. 13(2):131–141. doi: 10.1080/07438149709354304.
- Raney SM, Eimers MC. 2014. Unexpected declines in stream phosphorus concentrations across southern Ontario. Can J Fish Aquat Sci. 71(3):337–342. doi: 10.1139/cjfas-2013-0300.
- Reckhow KH, Chapra SC. 1983. Data analysis and empirical modeling. Engineering approaches for lake management. Vol. 1. Boston (MA): Butterworth.
- Strickland JD, Parsons TR. 1968. A practical handbook of sea-water analysis. Ottawa: Fisheries Research Board of Canada.
- Stumm WA, Morgan JJ. 1970. Aquatic chemistry. New York (NY): Wiley-Interscience.
- Wagner K. 2013. Keeping the lake in lake management. Lake Line. 33:4–6.
- Welch EB. 1977. Nutrient diversion: resulting lake trophic state and phosphorus dynamics. U.S. EPA. Ecol. Res. Series. EPA-60013-77-003.
- Welch EB, Bouchard D. 2014. Lake Sammamish water quality response to land use change, King County. Seattle (WA): Department of Natural Services and Parks. http://your.kingcounty.gov/dnrp/library/2014/kcr2654/kcr2654-rpt.pdf
- Welch EB, Jacoby JM. 2004. Pollutant effects in freshwater: applied limnology. 3rd ed. New York (NY): Spon Press, Taylor & Francis Group
- Welch EB, Perkins MA. 1980. Nearshore impact of stormwater on Lake Sammamish. Final Report for OWRT No.8-068.
- Welch EB, Rock FA, Howe RC, Perkins MA. 1980. Lake Sammamish response to wastewater diversion and increasing runoff. Water Res. 14(7):821–828. doi: 10.1016/0043-1354(80)90263-8.
- Wright RF, Henriksen A. 1978. Chemistry of small Norwegian lakes, with special reference to acid precipitation. Limnol Oceanogr. 23(3):487–498. doi: 10.4319/lo.1978.23.3.0487.
