
 ?Mathematical formulae have been encoded as MathML and are displayed in this HTML version using MathJax in order to improve their display. Uncheck the box to turn MathJax off. This feature requires Javascript. Click on a formula to zoom.
Abstract
Loffredo JR, Moore BC, Lee RW, Katz SL, Cross BK. 2019. Trophic status of a non-native crayfish in an oligotrophic lake: Bottom-up view of a mixed warmwater and coldwater sport fishery food web. Lake Reserv Manage. 35:396–414.
Numerous studies in recent decades have observed variable trophic status for freshwater crayfish among endemic and exotic populations in lentic or lotic habitats. In this study, we used stable isotope analyses (SIA) to explore trophic status of an introduced population of northern crayfish (Faxonius virilis) in Buffalo Lake, Washington. Northern crayfish are an important prey item for introduced warmwater and coldwater fish species in this lentic system and may buffer competitive interactions between largemouth bass (Micropterus salmoides), rainbow trout (Oncorhynchus mykiss), and kokanee (Oncorhynchus nerka). In 2017, the δ13C and δ15N values of liver samples from 208 crayfish informed proportional diet estimates. Crayfish diets were comprised of 8 littoral sources and were examined for cannibalism, temporal, spatial, and ontogenetic trophic shifts. There was no significant spatial or temporal trophic shift detected in this crayfish population. Seasonal δ15N values among all crayfish size classes mirrored seasonal abundance shifts of littoral macroinvertebrates. A multiple-source stable isotope mixing model and relative trophic positions provided evidence for an ontogenetic trophic shift between juvenile and adult crayfish, from a generalist detritivore to a predatory diet dominated by Chironomidae and Ephemeroptera. The trophic status of Buffalo Lake crayfish may affect salmonid management goals if interspecific competition for food between crayfish and sport fish is biologically significant. Our research is an important first step to understanding crayfish trophic status in a lentic food web, and should inform fish stocking regimes and fishery regulations in management efforts to achieve long-term sustainability of this diverse fishery.
In the past century, there have been numerous crayfish introductions into novel habitats around the world (Chucholl Citation2012; Moore et al. Citation2012; Twardochleb et al. Citation2013). The adaptability and high fecundity of crayfish often lead to high standing-stock biomass in their introduced habitats. Non-native crayfish populations have potential for altering aquatic systems by suppressing macrophyte growth, changing littoral macroinvertebrate assemblages, mobilizing nutrients between littoral and profundal zones, and creating water quality issues through bioturbation (Nystrom et al. Citation1999; Twardochleb et al. Citation2013; Ruokonen et al. Citation2014). Crayfish may also impact fisheries through cascading ecological effects, by competing with fish for food resources, and may themselves provide important food resources for fish. Therefore, understanding of crayfish ecology and food web interactions may be a critical element for fisheries management (Dorn et al. Citation2005; Elliott et al. Citation2007; Baldridge and Lodge Citation2013). Crayfish can also provide harvest opportunities for humans and can be an important aspect of fisheries management for multiple sport fish species. In spite of the frequency of introduction and the high potential for impacting sport fisheries, few studies have documented the impact of crayfish to sport fishery food web structure.
In most aquatic food webs, crayfish act as detritivores and scavengers (Pierce and Hinrichs Citation1997; Dorn and Wojdak Citation2004; Zhang et al. Citation2004). Studies observing stomach contents from pond-dwelling crayfish determined that crayfish could also function as primary consumers by feeding primarily on macrophytes (Momot Citation1995; Elliott et al. Citation2007). The omnivorous diet of crayfish allows them to shift between food sources when needed (Parkyn et al. Citation2001; Usio and Townsend Citation2004). Therefore, crayfish omnivory can lead to changing trophic status through their life history; such changes may be system specific (Roth et al. Citation2006). For example, numerous studies have documented crayfish as tertiary trophic consumers, as a functional predator of littoral macroinvertebrates, or as opportunistic predators of fish eggs through nest raiding behavior (Parkyn et al. Citation2001; Elliott et al. Citation2007; Baldridge and Lodge Citation2013).
The underlying biology of crayfish can explain their omnivory and plastic diet that allows these crustaceans to exploit a variety of prey items at various life stages. Like all crustaceans, crayfish have a ridged exoskeleton comprised of chitin, a structural polysaccharide (Kaestner Citation1970). The rigid exoskeleton limits linear crayfish growth, requiring individuals to molt 1 or more times each year to increase in size and for sexually maturity. Northern crayfish (Faxonius virilis, Crandall and De Grave Citation2017) molts can be Form I or Form II depending on reproductive status, which is reproductively active and inactive, respectively (Momot Citation1967). Unlike some other crustaceans with a free swimming larval stage, northern crayfish hatch as morphologically fully developed crayfish of <1 cm total length (Aiken and Waddy Citation1992). They hatch in spring as juvenile instars, and undergo 3 sexually immature molts, doubling in size by the end of their first summer. During their second summer northern crayfish molt to the sexually mature stage, Form I, and mate before entering winter hibernacula. Form I molts can mate again the following spring before molting to Form II for the duration of late-spring and summer months. With the onset of fall, northern crayfish again molt to Form I, and mate. This seasonal succession between Form I and Form II molts continues until the organisms die, typically at about 3–4 yr (Weagle and Ozburn Citation1972).
With each successive molt, increasing size reduces the crayfish vulnerability to gape-limited predators. Older, larger crayfish are subject to predation pressure from only the largest predators (Stein Citation1977; Wainwright and Richard Citation1995). Increasing body size also allows northern crayfish to procure larger prey items (MacIsaac Citation1994; Nystrom and Perez Citation1998). Better predator evasion and expanding dietary niche with increasing body size are critical elements in changing trophic status and ecological roles through crayfish life history (Reynolds Citation2011).
In prior ecosystem analyses of lake systems, the littoral zone ecology has received less attention than more structurally simple pelagic and profundal zones (Vadeboncouer Citation2009). Stable isotope methods allow a bottom-up analysis of littoral food webs that, coupled with pelagic food web data, can provide more complete understanding of whole-lake food webs and energy flows (Prestie et al. Citation2019). Stable isotope methods can be especially useful in quantifying system-specific feeding behaviors of freshwater crayfish (Jackson et al. Citation2014). The utility of stable isotopes in food web studies includes quantifying proportional diet contributions from multiple sources, investigating diet niche overlap between consumers, and detecting direct and indirect effects on consumer trophic position due to consumer-prey abundance and distribution (Garvey et al. Citation1994; Momot Citation1995; France Citation1996).
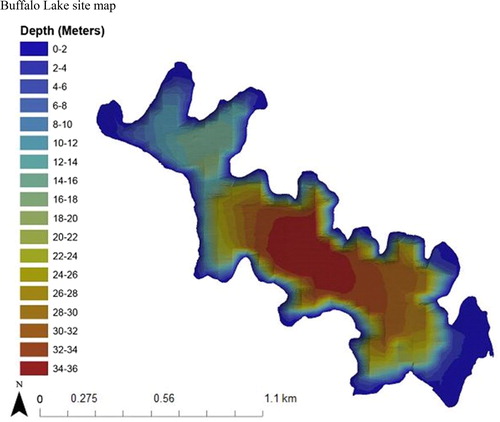
Buffalo Lake, located in north-central Washington, is managed by the Colville Confederated Tribes (CCT) and contains a fully introduced fish assemblage, including northern crayfish (). The CCT’s primary management goal for the mixed warmwater and coldwater fishery is to maintain a self-sustaining population of kokanee (Oncorhynchus nerka) (CCTFW Citation2012). Secondary goals include maintaining trophy largemouth bass (Micropterus salmoides) and triploid rainbow trout (Oncorhynchus mykiss) fisheries. The CCT has mostly followed an adaptive management approach geared to reduce largemouth bass predation pressure on kokanee spawning size classes and to reduce seasonal diet niche overlap with stocked rainbow trout for winter zooplankton resources. Largemouth bass are ambush predators that utilize a steep littoral shelf along much of the Buffalo Lake shoreline to prey on pelagic, planktivorous kokanee, especially as they move into spawn on littoral substrates in late fall. Rainbow trout are more generalist feeders and can shift from a littoral dominant diet in summer to a more pelagic diet in the winter, when they may directly compete with kokanee for limited winter zooplankton resources. These predation and competition effects may be exacerbated by low-water years when the littoral zone is compressed, or in high-ice years when ice cover limits zooplankton production.
Figure 1. 2015 Bathymetric map of Buffalo Lake located in north-central Washington State, managed by the Confederated Tribes of the Colville Reservation. The lake is characterized as a deep, cold oligotrophic lake with a surface area of 225 ha, average annual total phosphorus 0.027 mg/L, average pH 8.1, average summer water temperature <10 C, and Zmax of about 33–38 m. The lake’s variable maximum depth is attributed to the closed, 54.4 km2 basin draining occupied by Buffalo Lake. With no surface outlet and only ephemeral inputs, the lake level is extremely vulnerable to changes in year-to-year precipitation patterns. The annual variability in lake level also has a profound effect on littoral habitat availability throughout the lake, as is evident through its bathymetry. In low-water years, the steep drop-offs from the littoral to pelagic zones become more pronounced, limiting total littoral area. In high-water years, littoral shelves in the lake’s numerous coves become inundated and can even flood riparian vegetation for months. The large littoral shelf in the southern end of the lake contains most of lake’s macrophyte production, consisting of soft mud substrate that crayfish largely avoid. Littoral zone habitat throughout the rest of the lake is dominated by sand, small–large cobble, and bedrock substrates where crayfish abundances have been observed to be highest.
From 2015 to 2017, stomach content analysis (SCA) on Buffalo Lake largemouth bass and triploid rainbow trout documented that both species exploit northern crayfish as a dominant summer food source. Crayfish constituted nearly 100% of summer diets for largemouth bass and >50% of summer diets for rainbow trout (Lanouette et al. Citation2017; Confederated Colville Tribes, unpublished data). We believe the crayfish population is reducing seasonal predation pressure by bass and seasonal diet overlap by rainbow trout experienced by kokanee. Therefore, proper management of the crayfish population may be a key component for an ecologically sustainable kokanee fishery in Buffalo Lake.
Despite the relative importance of northern crayfish to the Buffalo Lake food web, little to no information exists on the dietary preferences for this stream-dwelling, tertiary burrowing crayfish native to the Ohio River Valley in a deep, cold, oligotrophic, lentic system (Hazlett, et al. Citation1974; Richards et al. Citation1996; Garvey et al. Citation2003; Davis and Huber Citation2007; Loughman Citation2010). Lack of crayfish diet data leaves CCT managers without a comprehensive understanding of their potential keystone role within the littoral food web (Momot Citation1995; Parkyn et al. Citation1997). In this study, we used stable isotope analysis (SIA) to perform a bottom-up analysis of the Buffalo Lake food web to quantify the feeding behavior and ecological role of introduced northern crayfish.
Study site
Buffalo Lake is located on the southern boundary of the Okanogan Highland in north-central Washington. The lake occupies a northwest–southeast oriented trench in the Okanogan metamorphic core complex bedrock (Joseph Citation1990). The lake is about 730 m above sea level and has an area of about 225 ha. Maximum depth (Zmax) is between about 33 and 38 m (). The watershed is about 54.4 km2. The lake is in a semi-arid climatic setting and there is 1 ephemeral inlet and no surface outlet. Annual high-water level is largely dependent on snowmelt from the previous winter, driving relatively high year-to-year Zmax variability. The geomorphology of the basin is reflected in a relatively high pH and specific conductivity; 2015–2018 averages were pH 8.1 and 77.0 mg/L, respectively. Grasses and small shrubs dominate the riparian areas, with a few stands of ponderosa pine and quaking aspen on north and east aspect slopes. Buffalo Lake is a meso- to oligotrophic system; mean 2017 total phosphorus was about 0.027 mg/L. Total phosphorus throughout the water column ranges from 0.010 mg/L to 0.040 mg/L. The lake is generally less productive than total phosphorus concentrations would indicate. Large-scale logging operations in the upper watershed and livestock grazing along the entire lakeshore represent the major anthropogenic impacts to this otherwise undeveloped watershed and may threaten the long-term water quality of this closed system.
The Buffalo Lake shoreline is characterized by steep slopes, so that the littoral zone is mostly a narrow band along most of the shoreline that quickly transitions to the pelagic zone. Littoral substrates are predominately bedrock, large cobble (>30 cm, LRB), small cobble (<30 cm, SRG), and sand. There is a littoral shelf in the southern end of the lake, mean depth <4 m, with littoral substrate dominated by dense macrophyte beds consisting of small and large plant growth (SPG, LPG). The soft mud bottom and summer Nostoc blooms on this southern littoral shelf provide less suitable crayfish habitat. For the duration of this study, highest densities of northern crayfish in Buffalo Lake were observed in rocky and sandy substrates (Loffredo Citation2018).
The Buffalo Lake fishery consists of several introduced fish species and 1 native fish species, bridgelip sucker (Catostomus columbianus). Beginning in 1946–1949, and again in 1958, the Washington Department of Fish and Wildlife stocked kokanee, which quickly became naturalized (Arterburn Citation2003). In recent decades, several warmwater sport fish species, including largemouth bass, black crappie (Pomoxis nigromaculatus), and pumpkinseed sunfish (Lepomis gibbosus), were introduced by unknown means and also have become naturalized. CCT staff annually stock catchable-size triploid rainbow trout to supplement the coldwater recreational fishery. The CCT first documented northern crayfish in Buffalo Lake in 2002, at which time they were already characterized as extremely abundant (Fairbank Citation2003). Because of the high standing-stock biomass (2017 mean ∼14.4 g/m2), CCT fisheries managers have implemented a Buffalo Lake summer sport fishery without a daily bag limit for crayfish harvest (CCTFW Citation2012; Loffredo Citation2018).
Materials and methods
We compared δ13C and δ15N from 8 potential littoral food sources to the δ13C and δ15N values of northern crayfish liver and bulk tissue collected in Buffalo Lake between May and October 2017. We set 1 baited crayfish trap twice monthly at 20 sites around the lake and captured 540 crayfish across all sites during the 2017 season (). From 2015 to 2018, we used modified gee minnow traps baited with 50 g tuna fillets placed at depths of 1–5 m in stratified locations to assess crayfish relative abundance (see ; Larson and Olden Citation2013; Loffredo Citation2018). At the time of collection, we recorded trap depth and dominant littoral habitat type. Habitat types include sand, SRG, LRB, SPG, and LPG. Baited crayfish traps have an inherent size bias as larger, more aggressive crayfish are usually captured in traps at higher frequencies than juveniles (Dorn and Wojdak Citation2004; Larson and Olden Citation2013). To supplement the lack of juvenile crayfish caught in traps, 8 littoral sites, representing different habitat types, were sampled with kick-nets monthly between May and October 2017 ().
Table 1. Latitude and longitude for 22 baited crayfish trap locations in Buffalo Lake, Washington. Northern crayfish were trapped twice monthly, May–Oct 2017.
Table 2. Latitude and longitude coordinates for monthly littoral macroinvertebrate, juvenile crayfish, and periphyton sampling for 2017 in Buffalo Lake, Washington.
Carapace length (CL) of each crayfish was measured to the nearest millimeter using dial calipers; these data were binned into five 1-cm CL size classes: 1, 2, 3, 4, and 5 cm CL for SIA. Dorn et al. (Citation2005) defined adult male Faxonius (previously Orconectes) crayfish as >1.9 cm CL. For the purposes of this study all crayfish <2 cm CL were categorized as juveniles and crayfish >2 cm CL were categorized as adults.
Traps and kick-net sites distributed around the shoreline were combined into 4 groups of 5 traps and 4 groups of 2 littoral sites, representing the 4 cardinal directions. For each sampling event, 5 crayfish from each size class per cardinal direction were subsampled prior to SIA (n = 208). Liver tissue was collected from all specimens large enough to be dissected (i.e., >1.5 cm CL). Crayfish too small to dissect were homogenized and SIA was performed on the bulk tissues. We analyzed liver rather than muscle tissues due to the short isotopic turnover rate of liver (2 weeks) vs. muscle (1 mo) (Stenroth et al. Citation2006). The short isotopic turnover rate of liver tissue, coupled with the intensive trapping scheme, allowed us to assess seasonal and ontogenetic trophic shifts in northern crayfish throughout spring, summer, and fall.
Littoral macroinvertebrates (Amphipoda, Ephemeroptera, Odonata, Chironomidae, Oligochaeta, Hirudinea), detritus, and epilithic periphyton were included as potential prey sources for our diet analyses. We collected prey items monthly between May and October 2017 from the same 8 littoral sampling sites used to obtain juvenile crayfish (). Littoral macroinvertebrates and detritus were collected with kick-nets after agitating the substrate, and periphyton was collected from unglazed ceramic tiles at depths 1–2 m.
All biological samples for this study were iced at the time of collection and stored at −20 C until sample processing. Crayfish >1.5 cm CL were dissected to remove liver tissues, while crayfish <1.5 cm CL and littoral macroinvertebrates (sorted to order) were bulk processed. Crayfish and macroinvertebrate samples were freeze-dried, homogenized, then analyzed for δ13C and δ15N. Periphyton was held at −20 C before being filtered under vacuum onto quartz fiber filters and then dried at 60 C. Once dried, periphyton was treated with 2 N phosphoric acid to remove calcium carbonate, homogenized, and then analyzed for δ13C and δ15N.
All stable isotope samples were analyzed using a GV Instruments Isoprime Isotope Ratio Mass Spectrometer. Internationally accepted standards were used to standardize final isotope values using the following formula:
(1)
(1)
The final isotope value (δX) is the quotient of the heavy to light stable isotope ratio for each sample (Rsample) and the heavy to light stable isotope ratio of the standard (Rstandard) (Fry Citation1988). Vienna Pee Dee Belemnite was used to standardize δ13C and N2 was used to standardize δ15N. Final isotope values are presented in delta (δ) notation per standard convention and expressed in per mil (‰) units (France Citation1996).
Average isotope values for potential littoral prey sources and northern crayfish were analyzed for proportional diet contributions using the SIMMR package in the program R (R Project for Statistical Computing). This multiple-source stable isotope mixing model uses the Markov-chain Monte Carlo statistical method to resample sources (prey items) and mixtures (crayfish) for δ13C and δ15N ratios up to 10,000 times to estimate dietary proportions that best fit the data. This is a Bayesian statistical approach that uses probability estimates to quantify each prey source’s proportional diet contribution, replacing traditional P values. For this analysis, SIMMR used the average δ13C and δ15N values of 8 littoral prey sources and the δ13C and δ15N values for 1–5 cm CL crayfish size classes to quantify size-class-specific proportional diet contributions.
Outputs from the SIMMR package include a stable isotope biplot that allows the user to see the distribution of source contribution to mixtures by plotting average δ13C and δ15N values for each crayfish size class and the standard error for each species’s average δ13C and δ15N values. Credible intervals constituting the probability estimates for each prey source’s contribution to overall crayfish diets are produced by SIMMR and represented as boxplots. To examine cannibalistic feeding behavior among Buffalo Lake northern crayfish, 1 cm CL crayfish were included as a ninth potential littoral food source for adult crayfish, >2 cm CL, proportional diet estimates.
To validate SIMMR results and examine evidence for a possible ontogenetic trophic shift within the northern crayfish population, we estimated relative trophic positions for each 1 cm CL size class. To calculate trophic position (TP), we adopted the TP formula from Kopanke (Citation2012) shown in Equationequation 2(2)
(2) . In this equation, the differences between average δ15N values per crayfish size class and average δ15N values for all prey items are divided by the δ15N trophic fractionation factor for northern crayfish (2.2‰), and added to the anticipated number of trophic levels crayfish occupy above primary producers (2):
(2)
(2)
This calculation is possible due to the predictable nature in which all stable isotopes fractionate as they are subjected to physiological processes upon being assimilated or passed through consumers. Nonradioactive organic elements, such as C and N, are considered stable because of their relatively long-lived nuclear half-lives. The number of neutrons present in the nucleus, that is, δ12C/δ13C or δ14N/δ15N, defines stable isotopes for each of these elements. The isotope with more neutrons is considered heavier than the light isotope with fewer neutrons. As isotopes fractionate in consumer tissue, the ratio of heavy to light isotopes for each element favors the accumulation of the heavier isotope in consumer tissue. Therefore, a tertiary trophic consumer will have a larger ratio of heavy to light stable isotopes than a primary producer or primary consumer. The rate of fractionation differs between elements but follows a predictable pattern up the food chain (Fry and Sherr Citation1989). Typical trophic fractionation rates for δ13C and δ15N are 0–2‰ and 2–8‰, respectively (Peterson and Fry Citation1987; Fry Citation1988).
Polynomial regression was used to correlate the nonlinear relationship between trophic position and crayfish size. One-way analysis of variance (ANOVA) and Tukey’s honestly significant difference (HSD) post hoc test were performed in program R to investigate how discrete variables such as location within the lake, littoral habitat, and season explain the variance between the TP (δ15N values) of 5 crayfish size classes.
Results
Two hundred and eight crayfish liver and bulk tissue samples were analyzed for δ13C and δ15N. Crayfish δ13C values range from −32.0 to −15.1‰, with an average δ13C of −24.8‰ (± SD 2.4). Adult crayfish tended to have more depleted δ13C values, while juvenile crayfish tended to have more enriched δ13C values. Crayfish δ15N values range from 2.8 to 11.6‰, with an average δ15N of 6.9‰ (± SD 1.7). Adult crayfish tended to have more enriched δ15N values and juvenile crayfish tended to have more depleted δ15N values. Eight littoral prey sources (n = 110) were analyzed as bulk tissue for δ13C and δ15N ().
Table 3. Average δ13C and δ15N values and standard deviations for 8 littoral prey items collected May–Oct 2017 and used in SIMMR to quantify proportional diet contributions for Buffalo Lake northern crayfish.
Table 4. Buffalo Lake northern crayfish catch-per-unit effort as a measure of relative abundance, 2015–2018. When water temperatures exceeded 20 C, 20 baited modified gee minnow traps were set overnight in littoral habitats distributed throughout the lake to quantify prey source availability for sport fish. Sampling bias associated with baited traps excludes juvenile crayfish from sample size. To supplement baited traps, littoral kick-net samples in 2016 and 2017 at 8 stratified sites throughout the lake sampled 1 m2 of substrate for 1 min to collect square meter density estimates of juvenile crayfish.
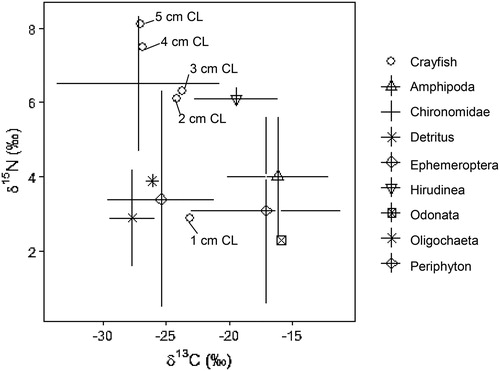
Average δ13C and δ15N values from all crayfish size classes are shown in to visualize the relationship between crayfish and littoral prey sources. Bivariate isotope plots using the standard error for each prey species’s average δ13C and δ15N values allow the user to interpret the overall food web structure of the Buffalo Lake littoral assemblage. Given trophic fractionation principles that ratios of δ15N will increase 2–8‰ per trophic level and δ13C ratios will increase 0–2‰ per trophic level, we observe that Chironomidae, Ephemeroptera, and detritus probably contribute the most to overall Buffalo Lake northern crayfish diets due to their depleted δ13C and δ15N values compared to crayfish. Periphyton, Amphipoda, Odonata, and Hirudinea are generally more enriched in δ13C than crayfish δ13C values, and therefore probably do not contribute as much to overall crayfish diets in Buffalo Lake ().
Figure 2. Biplot of δ13C and δ15N values for 8 potential littoral prey sources (n = 110) and northern crayfish (n = 208) collected May–Oct 2017 from Buffalo Lake, Washington. Average δ13C and δ15N values for 1–5 cm CL crayfish size classes are shown to visualize the relationship between crayfish and littoral prey sources. Bivariate isotope plots using the standard error for each prey species’s average δ13C and δ15N values allows the user to interpret the overall food web structure of the Buffalo Lake littoral assemblage. Given trophic fractionation principles that ratios of δ15N will increase 2–8‰ per trophic level and δ13C ratios will increase 0–2‰ per trophic level, we observe that Chironomidae, Ephemeroptera, and detritus probably contribute the most to overall Buffalo Lake northern crayfish diets due to their depleted δ13C and δ15N values compared to crayfish. Periphyton, Amphipod, Odonata, and Hirudinea are generally more enriched in δ13C than crayfish δ13C values, and therefore probably do not contribute as much to overall crayfish diets in Buffalo Lake.
Credible intervals produced by SIMMR after 10,000 resampling Markov-chain events show large differences in probabilities of proportional diet contributions from 8 littoral prey items for each 1 cm CL crayfish size class. The wide probabilities between the tail ends of the credible intervals indicated a large amount of model uncertainty when calculating percent diet contributions, although the convergence estimate for all prey items was 1.0, suggesting that the data fit the model well. Despite the large difference in credible interval probability estimates a discernable pattern of feeding behavior for each crayfish size class was evident ().
Figure 3. Proportional diet contributions and credible intervals from 8 littoral food sources for 1 cm CL northern crayfish in Buffalo Lake (n = 14). The smallest size class of crayfish obtained for this stable isotope analysis were gathered entirely from kick-net samples in <1 m depth in habitats spatially distributed throughout the lake. The wide distribution in credible intervals implies a large amount of uncertainty in the percent contribution estimates for littoral prey items; however, we conclude juvenile northern crayfish in Buffalo Lake have the most generalist diet compared to the larger size classes, with a dominate proportion of their diet attributed to detritus, periphyton, and Ephemeroptera.
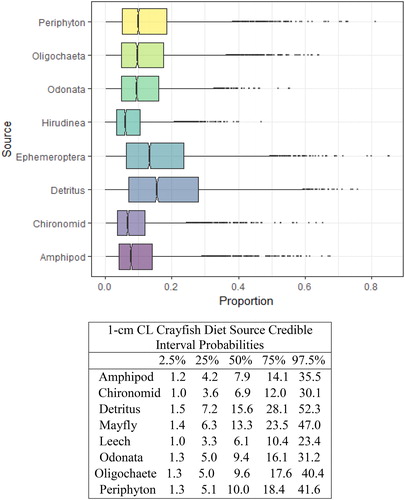
Figure 4. Proportional diet contributions and credible intervals from 9 littoral food sources for 2 cm CL northern crayfish in Buffalo Lake (n = 10). Members of the second smallest size class of northern crayfish obtained for this stable isotope analysis were trapped in baited minnow traps spatially stratified throughout Buffalo Lake in depths ranging from 1 to 5 m. The wide distribution in credible intervals implies a large amount of uncertainty in the percent contribution estimates for littoral prey items; however, we observe a potential ontogenetic diet shift between 1 cm CL and 2 cm CL northern crayfish in Buffalo Lake. From a largely generalist diet anchored by detritus and periphyton to a diet dominated by Ephemeroptera and Chironomidae.
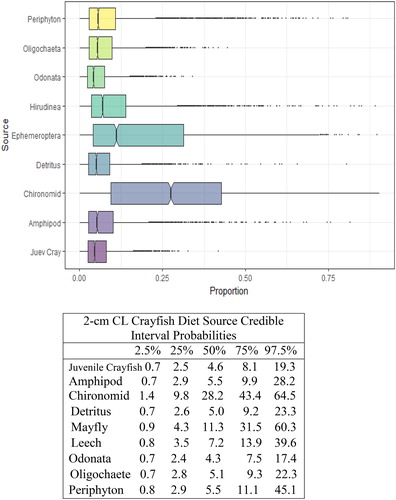
Figure 5. Proportional diet contributions and credible intervals from 9 littoral food sources for 3 cm CL northern crayfish in Buffalo Lake (n = 42). Members of the 3 cm CL size class of northern crayfish obtained for this stable isotope analysis were trapped in baited minnow traps spatially stratified throughout Buffalo Lake in depths ranging from 1 to 5 m. The wide distribution in credible intervals implies a large amount of uncertainty in the percent contribution estimates for littoral prey items; however, we observe an increasing shift in diet toward a greater reliance on Ephemeroptera and Chironomidae.
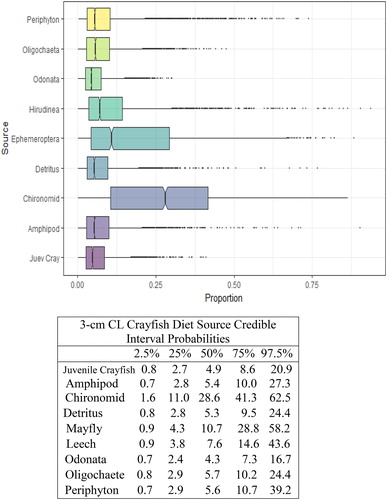
Figure 6. Proportional diet contributions and credible intervals from 9 littoral food sources for 4 cm CL northern crayfish in Buffalo Lake (n = 84). Members of the second largest size class of northern crayfish obtained for this stable isotope analysis were trapped in baited minnow traps spatially stratified throughout Buffalo Lake in depths ranging from 1 to 5 m. The 4 cm CL size class also represents the largest proportion of the total crayfish used for this study. The wide distribution in credible intervals implies a large amount of uncertainty in the percent contribution estimates for littoral prey items; however, we observe that the diet in this size class is now dominated by Ephemeroptera and Chironomidae with limited proportional diet contribution from juvenile crayfish.
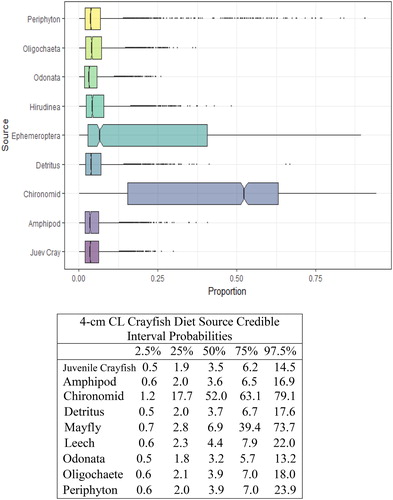
Figure 7. Proportional diet contributions and credible intervals from 9 littoral food sources for 5 cm CL northern crayfish in Buffalo Lake (n = 57). Members of the largest size class of northern crayfish obtained for this stable isotope analysis were trapped in baited minnow traps spatially stratified throughout Buffalo Lake in depths ranging from 1 to 5 m. The wide distribution in credible intervals implies a large amount of uncertainty in the percent contribution estimates for littoral prey items; however, we observe that the diet in this size class is now dominated by Ephemeroptera and Chironomidae with limited proportional diet contribution from juvenile crayfish.
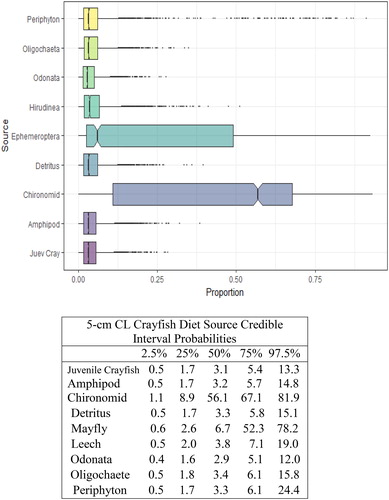
We observed the smallest crayfish size class (1 cm CL) had the most generalist diet, with detritus representing the largest proportion of their diet (). There was an apparent ontogenetic diet shift between the 1 and 2 cm CL size classes, as diet anchored by detritus shifted more to littoral macroinvertebrates, Chironomidae and Ephemeroptera. The proportion of macroinvertebrates in overall diet increased steadily between the 2 and 5 cm CL size classes (), and Chironomidae and Ephemeroptera contributed >50% of the diets for 4 cm CL and 5 cm CL crayfish.
Cannibalism among crayfish populations has been observed in aquaculture settings, attributed to high densities and heterogeneous size structures (Romano and Zeng Citation2016). To investigate the role of cannibalism in this introduced crayfish population, we included juvenile crayfish (1 cm CL) as the ninth littoral prey source in SIMMR for 2–5 cm CL size class crayfish. For all adult crayfish size classes, juvenile crayfish contributed <5.0% of total diet in the credible interval probability estimates (). Furthermore, the overall trend in crayfish δ13C values corroborates SIMMR model results for cannibalism. Crayfish δ13C values become more depleted in δ13C from 1–5 cm CL size classes, yet if adult crayfish were cannibalizing juvenile crayfish we would expect to see more enriched δ13C values in the adult crayfish compared to juvenile crayfish δ13C values ().
To validate the ontogenetic diet shift between juvenile (1 cm CL crayfish) and adult crayfish (>2 cm CL) observed in the SIMMR model, we calculated the relative TP for each crayfish size class using Equationequation 2(2)
(2) .
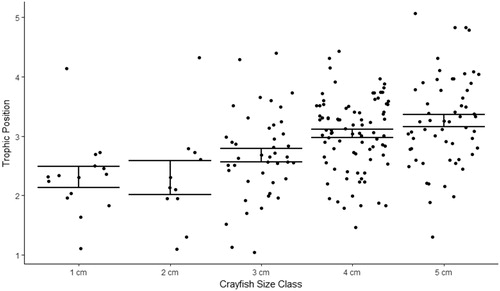
We observed minimal increase in TP between 1 cm and 2 cm CL size classes, 2.2 to 2.3 TP, respectively. The relative TP increased between 2 cm and 3 cm CL crayfish, from 2.3 to 2.7, respectively. TP increased to 3.0 for 4 cm CL crayfish, and 5 cm CL crayfish had the highest TP, 3.2. Taken together, we observed an increase of 1.0 trophic levels between juvenile crayfish and the largest adult crayfish in Buffalo Lake. A 3-order polynomial regression and one-way ANOVA showed a strong relationship between increasing TP with increasing crayfish size, (P = 0.003, r2 = 0.99, ). Tukey’s HSD post hoc detected significant differences between 5 cm CL crayfish and 1, 2, and 3 cm CL crayfish size classes (P < 0.001). While standard error among each size class TP did not vary significantly, the range of TP’s observed in each size class underpins the plastic diet of this highly adaptable omnivore ().
Figure 8. Five 1 cm CL crayfish size classes from Buffalo Lake and the average TP per size class. TP is the metric by which researchers can describe food web hierarchies by observing individual species δ15N values. Adopting the method from Kopanke (Citation2012), crayfish TP was calculated by taking the average δ15N value for each crayfish size class and subtracting the average δ15N value for all littoral prey items, normalized by the δ15N fractionation factor for northern crayfish, 2.2‰, plus the anticipated number of trophic levels crayfish occupy above primary producers, 2. We observed average δ15N ranging from 2.9 to 8.1‰ for smallest to largest crayfish size classes in this study. After calculating size-class-specific TP we observed an ontogenetic trophic shift from 2.2 to 3.2 TPs for 1 cm and 5 cm CL crayfish. Three-order polynomial regression shows a strong relationship between increasing TP with increasing crayfish size, which confirms the ontogenetic diet shift observed in the SIMMR model between 1 cm and 2 cm CL crayfish size classes.
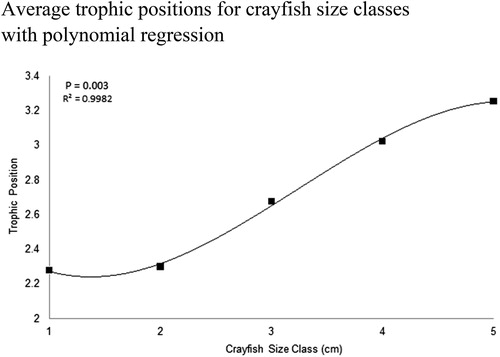
Figure 9. TPs for all northern crayfish (n = 208) analyzed for δ15N from Buffalo Lake in 2017. Error bars represent standard error of mean TP per 1 cm CL size class. Adopting the method from Kopanke (Citation2012), crayfish TP was calculated by taking the average δ15N value for each crayfish size class and subtracting the average δ15N value for all littoral prey items and normalized by the δ15N fractionation factor for northern crayfish, 2.2‰, plus the anticipated number of trophic levels crayfish occupy above primary producers, 2. Although the SIMMR model and polynomial regression indicate an ontogenetic diet and trophic shift among this crayfish population this plot shows the variable TP occupied for each crayfish size class and illustrates the highly plastic feeding behavior crayfish can utilize throughout their life history in Buffalo Lake.
One-way ANOVA and Tukey’s HSD were performed in the program R to examine evidence for a temporal trophic shift within the Buffalo Lake northern crayfish population between spring, summer, and fall. We determined that season was not a significant predictor of crayfish δ15N using one-way ANOVA (P = 0.06). Additionally, we performed pairwise comparison using Tukey’s HSD to look for significant differences of crayfish δ15N between seasons and found no significant difference between summer and spring (P = 0.06, ). While differences in crayfish δ15N values were not significant across season, we observed a decrease of 0.5 trophic positions (depleted δ15N values of 1‰) between spring and summer across all crayfish size classes. Subsequently, the crayfish population’s aggregate trophic position rebounded by 0.5 positions (enriched δ15N values of 1‰) between summer and fall and may be related to the pattern of littoral macroinvertebrate biomass observed over the same months (, and ).
Figure 10. 2017 Buffalo Lake northern crayfish seasonal trophic diversity. Average crayfish δ15N values are highest in spring, when δ15N was 7.45‰, and nearly identical in summer and fall, when δ15N was 6.9 and 6.8‰, respectively. Juvenile crayfish (1 cm CL) δ13C values shift from −30‰ in spring to −15‰ in summer, which is indicative of a shift from allochthonous (detritus) to autochthonous (periphyton) prey sources.
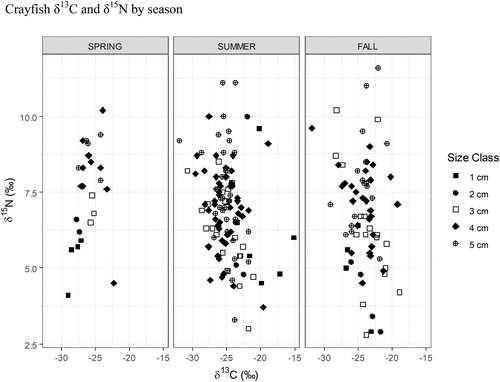
Figure 11. 2017 Buffalo Lake monthly littoral macroinvertebrate abundance summed across all taxa. Although not significantly different, seasonal δ15N values for crayfish may be correlated to boom/bust of littoral macroinvertebrate abundances observed throughout spring, summer, and fall. As is evident by the SIMMR model, this northern crayfish population relies heavily on littoral macroinvertebrates for a large proportion of their diet. The wide distribution of seasonal δ15N values and size class trophic positions demonstrates the highly plastic feeding behaviors that allow Buffalo Lake to consume detritus and periphyton when macroinvertebrates are not as abundant.
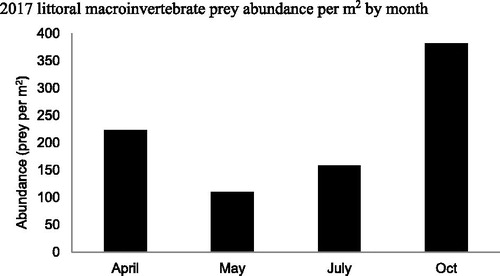
Table 5. Buffalo Lake 2016–2017 seasonal average littoral macroinvertebrate abundance per square meter. Eight littoral sites distributed throughout the lake were sampled quarterly for sport fish prey abundance estimates. Samples were gathered by agitating a 1 m2 area of substrate for 1 min and netting continuously with a 1 m2 kick-net. Macroinvertebrates were sorted to order and enumerated per site for square meter abundance estimates.
One-way ANOVA and Tukey’s HSD were also used to examine crayfish δ15N values as factors of littoral habitat and location within the lake. Habitat was not a significant predictor of crayfish δ15N values (one-way ANOVA P = 0.06). Tukey’s HSD for crayfish δ15N values between habitat types revealed only small plant growth and large rock/boulder habitats to produce significantly different crayfish δ15N values (P = 0.03, ). Location within the lake was defined as being 1 of 4 cardinal directions, where 20 traps were combined into 4 groups of 5 traps and 8 littoral sites were combined into 4 groups of 2 sites, representing north, east, south, and west ( and ). One-way ANOVA with location within the lake as a predictor variable of crayfish δ15N values did not differ significantly from zero (P = 0.12), and we did not detect any significant difference between location groups using Tukey’s HSD ().
Figure 12. 2017 Buffalo Lake northern crayfish trophic diversity as factor of habitat type. SAND = sand/silt, LRB = bedrock or rocks >30 cm, SRG = gravel/rocks <30 cm, SPG = small plant growth <30 cm/emergent vegetation, and LPG = large plant growth >30 cm. Crayfish trapped in SAND, LRB, and SRG have the highest average δ15N values of 6.96‰, 7.15‰, and 7.03‰, respectively. Crayfish trapped in SPG and LPG had the lowest average δ15N values of 5.83‰ and 6.57‰, respectively. One-way ANOVA for habitat as a factor of δ15N values, P = 0.06. Post hoc analysis of one-way ANOVA detected a significant difference in δ15N values between SPG and LRB (P = 0.03).
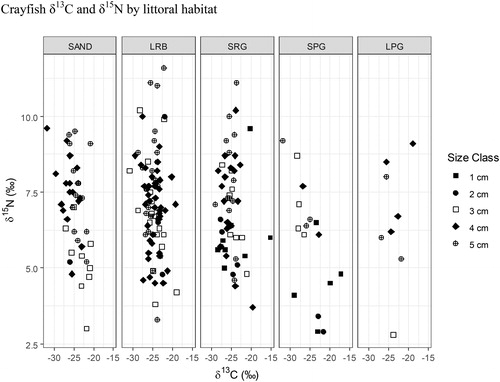
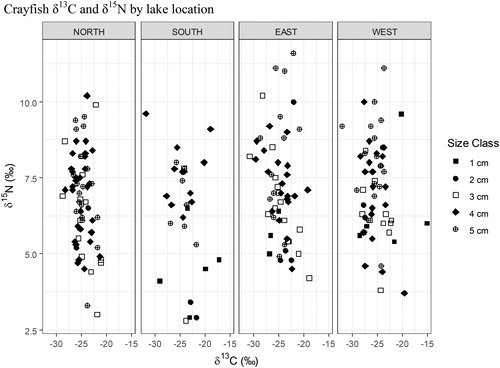
Figure 13. 2017 Buffalo Lake northern crayfish trophic diversity by lake location. Crayfish trapped along eastern and western lake shorelines have highest average δ15N values of 7.2‰. For crayfish trapped on the northern shoreline the average δ15N was 6.8‰, and for crayfish trapped on the southern shoreline the average δ15N was 6.3‰. One-way ANOVA for location as factor of δ15N values, P = 0.119. Post hoc analysis of one-way ANOVA did not detect a significant difference between locations. Lack of significant differences observed may be attributed to habitat heterogeneity between lake locations and/or crayfish movement between locations.
Discussion
Despite the large model uncertainty in percent diet contribution estimates from SIMMR, a discernable pattern emerged from the data. Taken together with relative trophic positioning for each crayfish size class, there is evidence to support an ontogenetic diet and trophic shift for this crayfish population. We observed that juvenile (1 cm CL) size class crayfish were the most generalist feeders, with a diet dominated by detritus. There was a shift in feeding behavior for adult crayfish (>2 cm CL), to a predatory diet, with Chironomidae and Ephemeroptera contributing >50% of proportional diet to the largest, 5 cm CL crayfish size class. The shift in diet may be related to the growth pattern associated with seasonal molting, predator escapement, and ability to handle larger and larger prey items.
The shift in diet may also be attributed to the hard substrates found throughout the lake that are mostly unsuitable for macrophytes but that do support relatively high abundances of littoral macroinvertebrates ( and ). As tertiary burrowers, Buffalo Lake northern crayfish preferentially utilize the hard substrates along the north, east, and west shorelines more than the soft substrates found in the south shoreline macrophyte beds (Loffredo Citation2018). This implies crayfish are exhibiting an opportunistic omnivorous feeding behavior, utilizing high littoral macroinvertebrate abundance in hard substrates rather than limited macrophyte resources (Loughman Citation2010).
We did not detect temporal or spatial trophic shifts among any crayfish size class. However, seasonal δ15N values among all size classes mirrored seasonal abundance shifts of littoral macroinvertebrates. Similar evidence of increasing adult crayfish trophic position with increasing littoral macroinvertebrate biomass was noted in nobel crayfish (Astacus astacus) in a Swedish lake (Olsson et al. Citation2008). Therefore, a significant temporal trophic shift may occur as Buffalo Lake crayfish population diets shift to larger percentages of littoral prey items.
We documented cannibalistic behavior in Buffalo Lake baited crayfish traps, observing that the largest crayfish consumed 2 and 3 cm CL crayfish in overnight sets. Cannibalism has been observed in commercial crayfish populations, where the behavior is dependent on high crayfish densities and size heterogeneity (Romano and Zeng Citation2016). After including <2 cm CL crayfish as a prey item for >2 cm CL crayfish in the SIMMR model, cannibalism was proportionally <5.0% of total crayfish diet regardless of size class. SIMMR model results, taken together with depleted δ13C values for adult crayfish compared to juvenile crayfish δ13C values, suggest that cannibalism is not a dominant feeding behavior in Buffalo Lake.
Our finding of an ontogenetic diet shift between juvenile and adult northern crayfish in Buffalo Lake is notable, because few studies of North American freshwater crayfish species have identified changing trophic status or ontogenetic diet shifts. SIA,studies of trophic status in native rusty crayfish (Faxonius rusticus) in 10 northern Wisconsin lakes showed no significant ontogenetic trophic shift between juveniles and adults (Roth et al. Citation2006). Additionally, only a slight increase of 0.5 trophic positions was observed between juvenile and adult crayfish, indicating that rusty crayfish in northern Wisconsin lakes predominately prey upon littoral macroinvertebrates regardless of life stage. In a similar study, Kopanke (Citation2012) used SIA to investigate trophic status of native signal crayfish (Pacifastacus leniusculus) populations in the Snake River drainage between Oregon, Washington, and Idaho. They found a slight decrease in trophic position with increasing crayfish size and no significant ontogenetic diet shift. Kopanke (Citation2012) also observed an increasing reliance on macrophytes in adult crayfish diets, which may explain the decreasing trophic position with increasing size in these signal crayfish populations.
These examples, taken together with the larger body of literature using stable isotopes to investigate crayfish trophic status, routinely find no ontogenetic trophic shifts and decreasing TP with increasing crayfish size (Whiteledge and Rabeni 1997; Parkyn et al. Citation2001; Bondar et al. 2005). This body of knowledge concerning trophic status of native and introduced crayfish is contrary to what we observed in the introduced northern crayfish population of Buffalo Lake. We identified an ontogenetic diet shift between 1 cm CL and 2 cm CL crayfish, a trophic shift between 1 cm CL and 5 cm CL crayfish (2.2–3.2 TP), and a significant increase in TP with increasing crayfish size (P = 0.003, r2 = 0.99).
The lack of significant differences in crayfish δ15N values across seasons and locations within the lake indicates that crayfish in this population are feeding at the same trophic level regardless of time of year or location within the lake (P = 0.06, P = 0.119). In fact, the only spatial difference in Buffalo Lake crayfish δ15N values was observed between large cobble and macrophyte-dominated habitat types (P = 0.03). These results demonstrate that Buffalo crayfish actively utilize higher trophic food sources, such as littoral macroinvertebrates, over periphyton, detritus, or macrophytes. However, the depleted δ15N values of crayfish captured in the limited macrophyte habitats may reflect diet plasticity in this introduced crayfish population.
The apparent reliance on littoral macroinvertebrates by the Buffalo Lake northern crayfish population could indicate potential competitive interactions between crayfish and higher trophic consumers such as rainbow trout and largemouth bass. A concurrent food web investigation by CCT biologists and Washington State University researchers looking at diet niche overlap, competition, and predation between Buffalo Lake sport fish species suggests that largemouth bass and rainbow trout rely on similar prey sources as crayfish during some portion of their life history (Lanouette Citation2019, Washington State University, forthcoming July). For example, 2015–2017 average δ15N value for largemouth bass was 10.9‰ (n = 62), and over the same 3 yr period rainbow trout average δ15N was 11.3‰ (n = 75). The higher average δ15N value for rainbow trout reflects the species’s generalist diet of pelagic and littoral food sources (confirmed with stomach content analysis), while the largemouth bass average δ15N value reflects a littoral food source signature.
In contrast, 2017 adult northern crayfish in Buffalo Lake average δ15N was 6.9‰ (± SD 1.7), ranging from δ15N 6.1 to 8.1‰ for adult, 2–5-cm CL crayfish. The largest crayfish in Buffalo Lake achieve total lengths >20 cm, thereby limiting predation pressure from all but the largest fish and allowing this size class to exploit a trophic niche only 1–2 trophic levels below largemouth bass and rainbow trout using a δ15N 2.2‰ trophic fractionation factor optimized for northern crayfish (Kopanke Citation2012).
Furthermore, SCA of Buffalo Lake largemouth bass and rainbow trout found littoral macroinvertebrates such as Chironomidae to be the second most abundant prey item after crayfish (Lanouette et al. Citation2017, unpublished, Colville Confederated Tribes, Lanouette Citation2019, Washington State University, forthcoming July). In lieu of crayfish, top fish predators in Buffalo Lake target littoral macroinvertebrates, while the largest crayfish target littoral macroinvertebrates year-round, leading to potential diet niche overlap between predator and prey. Precedence for interspecific competition between crayfish and fish already exists. In controlled settings, Carpenter (Citation2005) and Rogowski and Stockwell (Citation2006) explored diet overlap between introduced northern crayfish and endemic fish in the Colorado River basin. Both researchers independently demonstrated that fish growth was reduced in the presence of crayfish, indicating a competition for resources.
Prior studies have also assessed how crayfish introductions affect littoral macroinvertebrate assemblages. Moore et al. (Citation2012) observed introduced signal crayfish in a central California stream with increasing leaf litter breakdown rate, leading to an increase in algal production by suppressing grazer abundance and a decrease of the abundance and biomass of other benthic invertebrates. Furthermore, the introduced crayfish replaced caddisflies as the specialized detritivore in their lotic system, thereby shortening the food web through omnivory as a detritivore of basal resources and predator of macroinvertebrate grazers. Higher trophic status consumers could be significantly impacted by competitive exclusion of native macroinvertebrates by introduced crayfish. Examining crayfish-induced changes to the Buffalo Lake littoral macroinvertebrate assemblage was beyond the scope of this study but should remain an area of interest for lake managers, as changes to littoral invertebrate species richness and abundance can have effects on food availability for sport fish.
Interspecific competitive interactions between adult crayfish and higher trophic crayfish consumers could affect multiple levels of this lentic food web. For example, if the crayfish population in Buffalo Lake were to crash due to competition for resources, a shift in predation pressure from crayfish to kokanee by largemouth bass and increasing diet niche overlap between rainbow trout and kokanee for zooplankton resources could negatively affect the self-sustaining kokanee population. To keep predation pressure on kokanee by largemouth bass and diet overlap between rainbow trout and kokanee at a minimum, it will be critical to manage the common prey source, northern crayfish, at an ecologically sustainable level such that the population can sustain itself and remain a reliable food source for largemouth bass and rainbow trout (Zabel et al. Citation2003).
Creel surveys of summer crayfish trapping and annual population monitoring of crayfish abundance can help managers determine if this critical prey species is being overharvested to the detriment of the entire fishery. We suggest that managers should encourage largemouth bass harvest, limit rainbow trout stocking to once a year, and adjust stocking quantities based on annual hydrology to reduce detrimental impacts to the kokanee fishery. Long-term water quality of Buffalo Lake should be protected to help protect macroinvertebrate species richness and abundance. For example, watershed management measures, such as excluding livestock from riparian areas to minimize erosion and to keep excess nutrients from flushing into the lake during high-water years, could be employed to protect water quality. Moving forward, managers could apply bioenergetics models to better quantify the Buffalo Lake food web and to more precisely guide stocking rates, harvests, and management options. Our SIA has provided important baseline information on the northern crayfish feeding behaviors in a non-native habitat, will help guide fisheries management in Buffalo Lake, and contributes to the general knowledge of crayfish ecology. Clearly, freshwater crayfish are highly adaptable organisms, and our research indicates that understanding habitat-specific feeding behavior is likely to be critical for the ecologically sustainable management of this species in both lentic and lotic systems.
Acknowledgments
The primary author would like to thank the Confederated Tribes of the Colville Reservation for providing funding and generously donating the biological specimens for this research. Field aid came from Jeffrey Caisman, Timothy Taylor, Brian Lanouette, Zadie Bielejec, Montana Pakootas, and Bernie Fall.
References
- Aiken DE, Waddy SL. 1992. The growth process in crayfish. Rev Aqua Sci. 6:335–381.
- Arterburn J. 2003. Colville reservation lakes compendium, limiting factors, and management plan. June 2003. Nespelem, WA: The Confederated Tribes Fish and Wildlife Department [accessed 2016 Aug 15]. http://www.cctobmep.com/media/files/Colville%20Reservation%20Resident%20Fish%20Compendium%20and%20Management%20Plan.pdf.
- Baldridge AK, Lodge DM. 2013. Intragulid predation between spawning smallmouth bass (Micropterus dolomieu) and nest-raiding crayfish (Orconectes rusticus): implications for bass nesting success. Freshwater Biol. 58:2355–2365.
- Bondar CA, Bottriell K, Zeron K, Richardson JS. 2005. Does trophic position of the omnivorous signal crayfish (Pacifastacus leniusculus) in a stream food web vary with life history stage or density? Canadian Journal of Fisheries and Aquatic Sciences. 62(11): 2632–2639.
- Carpenter J. 2005. Competition for food between an introduced crayfish and two fishes endemic to the Colorado River basin. Environ Biol Fish. 72(3):335–342.
- Chucholl C. 2012. Understanding invasion success: life-history traits and feeding habits of the alien crayfish Orconectes Immunis. Knowl Managt Aqua Ecosyst. 404:4.
- Colville Confederated Tribes Fish and Wildlife Department (CCTFW). 2012. Lake management plan. Nespelem, WA: The Confederated Tribes Fish and Wildlife Department [accessed 2016 Aug 15]. https://static1.squarespace.com/static/56a24f7f841aba12ab7ecfa9/t/57bf567fb3db2bdb891e6061/1472157317556/Fish+%26+Wildlife+Management+Plan.pdf
- Crandall KA, De Grave S. 2017. An updated classification of the freshwater crayfishes (Decapoda: Astacidea) of the world, with a complete species list. J Crustac Biol. 37(5):615–653.
- Davis KM, Huber R. 2007. Activity patterns, behavioural repertoires, and agonistic interactions of crayfish: a non-manipulative field study. Behaviour. 144(2):229–247.
- Dorn NJ, Urgelles P, Trexler JC. 2005. Evaluating active and passive sampling methods to quantify crayfish density in a freshwater wetland. J N Am Benthol Soci. 24(2):346–356.
- Dorn NJ, Wojdak JM. 2004. The role of omnivorous crayfish in littoral communities. Oceologica. 140:50–159.
- Elliott BJ, Marsden JE, Fitzsimmons JD, Jonas JL, Claramunt RM. 2007. Effects of temperature and density on consumption of trout eggs by Orconectes propinquus and O. rusticus. J Great Lakes Res. 33:7–14.
- Fairbank D. 2003. Colville tribal fish hatchery annual report for 2003. Nespelem, WA: Colville Confederated Tribes Fish and Wildlife Department.
- France RL. 1996. Scope for use of stable carbon isotopes in discerning the incorporation of forest detritus into aquatic foodwebs. Hydrobiologia. 325(3):219–222.
- Fry B. 1988. Food web structure on Georges Bank from stable C, N, and S isotopic compositions. Limnol Oceanogr. 33(5):1182–1190.
- Fry B, Sherr EB. 1989. δ13C measurements as indicators of carbon flow in marine and freshwater ecosystems. Stable Isotopes Ecol Res. 68:196–229.
- Garvey JE, Rettig JE, Stein RA, Lodge DM, Klosiewski SP. 2003. Scale-dependent associations among fish predation, littoral habitat, and distributions of crayfish species. Ecology. 84(12):3339–3348.
- Garvey JE, Stein RA, Thomas HM. 1994. Assessing how fish predation and interspecific prey competition influence a crayfish assemblage. Ecology. 75(2):532–547.
- Hazlett B, Rittschof D, Rubenstein D. 1974. Behavioral biology of the crayfish Orconectes virilis I. home range. Am Midland Natural. 92(2):301–319.
- Jackson MC, Jones T, Milligan M, Sheath D, Taylor J, Ellis A, England J, Grey J. 2014. Niche differentiation among invasive crayfish and their impacts on ecosystem structure and functioning. Freshw Biol. 59(6):1123–1135.
- Joseph NI. 1990. Geologic map of the nespelem 1:100,000 quadrangle, Washington. Washington Division of Geology and Earth Resources, Washington State Department of Natural Resources. Report 90-16. September 1990.
- Kaestner A. 1970. Invertebrate zoology: Crustacea. Vol. 3. New York, NY: John Wiley & Sons.
- Kopanke J. 2012. Elucidating the ecological importance of the signal crayfish with the application of stable isotope analysis [MS thesis]. Pullman (WA): Washington State University.
- Lanouette B, Moore BC, Loffredo JR, Taylor T, Bielejec Z. 2017. Buffalo lake water quality and fishery assessment summary. Confederated Tribes of the Colville Reservation, Department of Fish and Wildlife, January 2018, unpubl.
- Lanouette B. 2019. Determining food web relationships to optimize kokanee management in Buffalo Lake, Washington [PhD thesis]. Pullman (WA): Washington State University, July 2019, forthcoming.
- Larson ER, Olden JD. 2013. Crayfish occupancy and abundance in lakes of the Pacific Northwest, USA. Freshw Sci. 32(1):94–107.
- Loffredo JR. 2018. Spatial and food web dynamics of non-native northern crayfish Orconectes virilis in Buffalo Lake, WA [MS Thesis]. Pullman (WA): Washington State University.
- Loughman ZJ. 2010. Crayfishes of western Maryland: conservation and natural history. Southeast Naturalist. 9:33–62.
- MacIsaac HJ. 1994. Size-selective predation on zebra mussels (Dreissena polymorpha) by crayfish (Orconectes propinquus). Freshw Sci. 13(2):206–216.
- Momot WT. 1967. Population dynamics and productivity of the crayfish, Orconectes virilis, in a marl lake. Am Midland Natural. 78(1):55–81.
- Momot WT. 1995. Redefining the role of crayfish in aquatic ecosystems. Rev Fish Sci. 3(1):33–63.
- Moore JW, Carlson SM, Twardochleb LA, Hwan JL, Fox JM, Hayes SA, Sarnelle O. 2012. Trophic tangles through time? Opposing direct and indirect effects of an invasive omnivore on stream ecosystem processes. PLoS One. 7(11):e50687.
- Nystrom P, Bronmark C, Graneli W. 1999. Influence of an exotic and a native crayfish species on a littoral benthic community. Oikos. 85(3):545–553.
- Nystrom P, Perez JR. 1998. Crayfish predation on the common pond snail (Lymnaea stagnalis): the effect of habitat complexity and snail size on foraging efficiency. Hydrobiologia. 368:201–208.
- Olsson K, Nystrom P, Stenroth P, Nilsson E, Svensson M, Graneli W. 2008. The influence of food quality and availability on trophic position, carbon signature, and growth rate of an omnivorous crayfish. Can J Fish Aquatic Sci. 65(10):2293–2304.
- Parkyn SM, Collier KJ, Hicks BJ. 2001. New Zealand stream crayfish: functional omnivores but trophic predators? Freshw Biol. 46(5):641–652.
- Parkyn SM, Rabeni CF, Collier KJ. 1997. Effects of crayfish (Paranephrops planifrons: Parastacidae) on in-stream processes and benthic faunas: a density manipulation experiment. NZ J Marine Freshw Res. 31(5):685–692.
- Peterson BJ, Fry B. 1987. Stable isotopes in ecosystem studies. Annu Rev Ecol Syst. 18(1):293–320.
- Pierce CL, Hinrichs BD. 1997. Response of littoral invertebrates to reduction of fish density: simultaneous experiments in ponds with different fish assemblages. Freshw Biol. 37(2):397–408.
- Prestie K, Philips ID, Chivers DP, Jardine TD. 2019. Effects of ontogeny and invasive crayfish on feeding ecology and mercury concentrations of predatory fishes. Can J Fish Aquatic Sci. doi:10.1139/cjfas-2018-0455.
- Reynolds JD. 2011. A review of ecological interactions between crayfish and fish, indigenous and introduced. Knowl Managt Aquat Ecosyst. 401:10.
- Richards C, Kutka FJ, McDonald ME, Merrick GW, Devore PW. 1996. Life history and temperature effects on catch of northern orconectid crayfish. Hydrobiologia. 319(2):111–118.
- Rogowski DL, Stockwell CA. 2006. Assessment of potential impacts of exotic species on populations of a threatened species, white sands pupfish, Cyprionodon tularosa. Biol Invasions. 8(1):79–87.
- Romano N, Zeng C. 2016. Cannibalism of decapod crustaceans and implications for their aquaculture: a review of its prevalence, influencing factors, and mitigating methods. Rev Fish Sci Aquaculture. 25:42–69.
- Roth BM, Hein CL, Vander Zanden MJ. 2006. Using bioenergetics and stable isotopes to assess the trophic role of rusty crayfish (Orconectes rusticus) in lake littoral zones. Can J Fish Aqua Sci. 63(2):335–344.
- Ruokonen TJ, Karjalainen J, Hämäläinen H. 2014. Effects of an invasive crayfish on the littoral macroinvertebrates oflarge boreal lakes are habitat specific. Freshwater Biol. 59(1):12–25.
- Stein RA. 1977. Selective predation, optimal foraging, and the predator-prey interaction between fish and crayfish. Ecology. 58(6):1237–1253.
- Stenroth P, Holmqvist N, Nystrom P, Berglund O, Larsson P, Graneli W. 2006. Stable isotopes as an indicator or diet in omnivorous crayfish (Pacifastacus leniusculus): the influence of tissue, sample treatment, and season. Can J Fish Aqua Sci. 63(4):821–831.
- Twardochleb LA, Olden JD, Larson ER. 2013. A global meta-analysis of the ecological impacts of nonnative crayfish. Freshw Sci. 32(4):1367–1382.
- Usio N, Townsend CR. 2004. Roles of crayfish: consequences of predation and bioturbation for stream invertebrates. Ecology. 85(3):807–822.
- Vadeboncouer Y. 2009. Encyclopedia of inland waters. Aquatic plants and attached algae. Oxford (UK): Elsevier; pp. 52–58.
- Wainwright PC, Richard BA. 1995. Predicting patterns of prey use from morphology of fishes. Environ Biol Fish. 44(1–3):97–113.
- Weagle KV, Ozburn GW. 1972. Observations on aspects of the life history of the crayfish, Orconectes virilis (Hagen), in northwestern Ontario. Can J Zool. 50(3):366–370.
- Whitledge GW, Rabeni CF. 1997. Energy sources and ecological role of crayfishes in an Ozark stream: insights from stable isotopes and guy analysis. Canadian Journal of Fisheries and Aquatic Sciences, 54: 2555–2563.
- Zabel RW, Harvey CJ, Katz SL, Good TP, Levin PS. 2003. Ecologically sustainable yield: marine conservation requires a new ecosystem-based concept for fisheries management that looks beyond sustainable yield for individual species. Am Scientist. 91:150–157.
- Zhang Y, Richardson JS, Negishi JN. 2004. Detritus processing, ecosystem engineering and benthic diversity: a test of predator-omnivore interference. J Animal Ecol. 73(4):756–766.
