
 ?Mathematical formulae have been encoded as MathML and are displayed in this HTML version using MathJax in order to improve their display. Uncheck the box to turn MathJax off. This feature requires Javascript. Click on a formula to zoom.
Abstract
Abobi SM, Mildenberger TK, Kolding J, Wolff M. 2019. Assessing the exploitation status of main fisheries resources in Ghana’s reservoirs based on reconstructed catches and a length-based bootstrapping stock assessment method. Lake Reserv Manage. 35:415–434.
The cichlid species Oreochromis niloticus, Sarotherondon galilaeus, and Coptodon zillii, which are among the most exploited resources in the small-scale fisheries of the Tono, Bontanga, and Golinga reservoirs in northern Ghana, were assessed based on length frequency samples. Growth, mortality, exploitation status, stock size, and relative yield per recruit reference points were determined using bootstrapping fish stock assessment (BFSA), a novel framework that allows for the estimation of uncertainties around the life-history parameters and reference levels (e.g., L∞, K, and F0.1). The results suggest that the 3 species studied are heavily exploited in all 3 reservoirs, but with no alarming signs of overexploitation. The fishing effort at Golinga is comparatively low as a result of insignificant fishing during the agriculture season, which relates to low exploitation rates. Sarotherondon galilaeus and C. zillii have the highest and lowest biomass (t/km2) respectively in all the 3 reservoirs. The small shallow reservoir (Golinga) has the highest biomass of the target resources per unit area. According to a second assessment approach, based on length-based indicators, all species at Bontanga and O. niloticus and S. galilaeus populations at Golinga have spawning stock biomasses below 40% of the unfished biomass. This points to a situation of a possible ongoing recruitment overfishing of those species in the 2 reservoirs and suggests that a further increase in fishing effort should be prevented. Further monitoring of these fisheries will be needed for the improvement of assessments and thus management advice.
Reservoirs, lakes, and rivers are essential food security and livelihood resources. Inland water bodies provide multiple community needs, including domestic water supply, irrigation, hydropower generation, recreation, fisheries, and aquaculture harvests (Deines et al. Citation2017; Lynch et al. Citation2016). Fish production from inland waters contributed 12.7% to total global capture fishery production in 2014 (FAO 2016). The management arrangements for reservoir fisheries in Ghana are no different from what has been noted globally for many inland water bodies. According to the Food and Agriculture Organization (FAO) and Michigan State University (MSU) (2016), many inland water bodies are lacking management that can adequately enforce the sustainable use of resources. Additionally, where management arrangements exist, compliance and enforcement are often minimal or nonexistent. This may result in excessive fishing pressure, decreased catch per unit effort, conflicts between fishers, and changes in the productivity of fishery resources. As a consequence, reductions in fishing capacity will be required in some areas. To facilitate fishery management, “The Rome Declaration: Ten Steps to Responsible Inland Fisheries” (FAO and MSU 2016) emphasizes the importance of (i) improving biological and production data assessment; (ii) developing and improving science-based approaches to fishery management; (iii) adequate valuing of inland aquatic systems; and (iv) improving access to and promoting better sharing of data and information about inland fisheries supporting the assessment–management cycle. Following these suggestions, the goal of this research was to contribute to the development of science-based approaches to reservoir fishery management in Ghana using assessment methods that offer extended and robust information on growth, mortality, exploitation, and stock status.
Fishing is a traditional activity in Ghana, particularly among rural communities along the coastline and the major rivers such as the Volta and its tributaries. Fishing provides a major source of employment and income, as well as food for people across the country. Five hundred thousand fishermen, fish processors, traders, and boat builders are employed in the fisheries sector of Ghana. Together with the dependents of these workers, the fisheries sector supports 10% of the Ghanaian population (Mensah Citation2012). In northern Ghana, fishes from rivers, reservoirs, and dugouts (constructed water retention ponds) are an important dietary supplement for the people.
The domestic demand for fish in Ghana has been rising in response to human population growth, rising incomes, and urbanization. Fish and fish products, including low-value species like tilapias, are gradually becoming more expensive and inaccessible to the poor, relative to other sources of animal protein. A continuous decline in fisheries production in Ghana’s inland waters, paralleled by increasing prices, will have disastrous consequences on food security, livelihoods, and national economy. The national demand for fish is estimated at 880,000 tonnes (t) annually, but approximately 50% is produced locally, leaving a supply deficit of a little more than 50%, filled in by fish imports worth more than US$200 million (MoFA 2012). This has become a real concern for policymakers in the fisheries subsector over the years. Fish production statistics from the Ministry of Fisheries and Aquaculture Development show that production from the aquaculture sector has been increasing by 6744 t per year since 2010, while inland fisheries production during the same period has declined by 910 t per year, that is, 1.1% of the average annual inland capture fisheries production. Also, it has been noted that for the past 20 yr, catches from the reservoirs in northern Ghana have been dwindling. Possible reasons for the decline in catch could be overexploitation of stocks, environmental degradation, and low water levels, which would have negatively impacted fish production (Abban et al. Citation2002, Amevenku and Quarcoopome Citation2006). Obodai and Waltia (Citation2003) attributed the lower catches in Tono Reservoir, the largest in the Upper East Region of Ghana, to poor management practices and overexploitation. The Ghanaian Fisheries Act (Fisheries Act Citation2002) allows for the declaration of closed seasons in specified areas of coastal waters or riverine system. Attempts by the fisheries commission to implement closed seasons to reservoir systems have generally not been successful in the past. However, the fishers of Tono enforce a ban on fishing at the upstream parts of the reservoir during the peak month (either August or September) of the raining season. Moreover, no fishing activity in the reservoir is allowed between 11:00 and 16:00 GMT. Fishers are allowed to set gillnets starting from 16:00 GMT and the nets are removed the next day before 11:00 GMT. The use of dynamite or poison for fishing is also prohibited.
The target fisheries of Tono, Bontanga, and Golinga reservoirs have not yet been assessed. Research has mainly focused on fisheries socioeconomics, water productivity, sedimentation, and water storage, in particular at Tono (Abache Citation2015, Abubakari Citation2015, Diekkrüger and Liebe Citation2002, Mdemu Citation2008, Okrah Citation2010). Recent work on the Tono Reservoir by Akongyuure et al. (Citation2017b) was focused on gillnet selectivity estimates of the target fish species. Kwarfo-Apegyah (Citation2008) studied the exploitation rates and management implications of the Bontanga Reservoir fisheries from 2004 to 2006 and reported that the reservoir had 26 fish species belonging to 19 genera in 11 families. Another study, by Quarcoopome et al. (Citation2008), focused on the fisheries and limnology of the Bontanga Reservoir. No fisheries studies have as yet been conducted on the Golinga Reservoir.
This study was aimed at assessing the stock sizes, growth parameters, and exploitation status of the target fish species Sarotherondon galilaeus (Linnaeus 1758), Oreochromis niloticus (Linnaeus 1758), and Coptodon zillii (Gervais 1848) in the Tono, Bontanga, and Golinga reservoirs. The study employed two complementary assessment approaches: (1) the analysis of periodically sampled length frequency data using the TropFishR software to estimate growth, mortality parameters, exploitation rates, stock size, and biological reference points from yield per recruit analysis and (2) the use of length-based indicators to estimate the spawning potential of the species under the current exploitation regime.
Materials and methods
The reservoir systems of northern Ghana
Northern Ghana is covered in Savannah and has a monomodal rainfall cycle that is subject to wide variation. Because of intermittent and terminal droughts, crop and animal production can be extremely difficult. To mitigate these challenges, reservoirs were constructed for domestic uses, livestock watering, fish farming, and irrigated agriculture (MoFA 2018). With time, they have grown into significant inland fishing grounds. This study was carried out at 3 reservoirs: Tono (10°52'48''N; 1°9'36''W), Bontanga (9°33'0''N; 1°1'12''W), and Golinga (9°21'36''N; 0°57'14.4''W) (). Tono is the largest reservoir in the upper east region of Ghana and has a surface area of 1,860 ha. Bontanga with a surface area of 670 ha is the largest reservoir in the northern region of Ghana, while Golinga is the smallest among the 3 reservoirs with an area of 62 ha. Bontanga and Golinga are only 20 km apart, while Tono is approximately 210 km away from Bontanga and Golinga (). Golinga has one landing site, Bontanga has 2 landing sites (named Voggu and Bontanga), and Tono has 5 landing sites (locally called “bays”).
Figure 1. Map showing the locations of Tono, Bontanga, and Golinga reservoirs in Ghana.
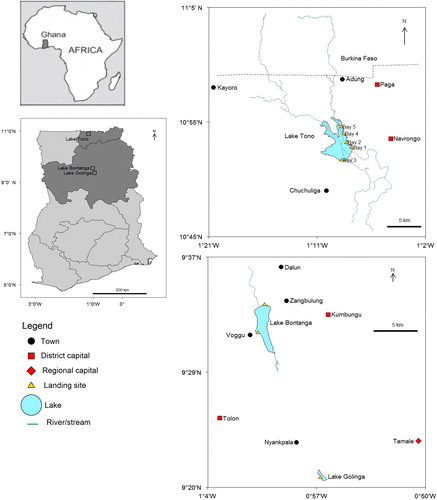
Table 1. Morphometric characteristics of Tono, Bontanga, and Golinga reservoirs.
Fisheries characteristics
The targeted cichlid species represent 89%, 74%, and 71% of the catch (landed weight) composition at Tono, Bontanga, and Golinga reservoirs, respectively. The main fishing gear used are gillnets, cast nets, traps, and hooks and lines. Typically, crews of 1–3 people use the gear from canoes (average length of 7 m) wading through the shallow regions. Fishers operate between 240 and 288 fishing days per annum. Over the course of the study we did not encounter any Fisheries Commission officers at Bontanga or Golinga. However, at Tono, a fisheries officer collects catch data on a monthly basis. The fisheries are managed by the riparian fishing communities and the management is headed by a chief fisher or/chairman. The chairman’s task is to ensure that fisheries regulations and agreed bylaws are followed. A task force enforces the regulations at Tono. Surveys conducted between July 2016 and June 2017 recorded 417 active fishermen at Tono, while Bontanga and Golinga had 96 and 18 active fishermen, respectively.
Catch and size frequency data collection
Fish landings were observed and recorded for 5 consecutive days in each month and extrapolated to the monthly catch using an estimate of the average number of fishing days per month. Respective information was obtained from the fishers at the 3 reservoirs. The bulk weight of each fisher’s catch per day was recorded and the caught fishes were then sorted into the target species, counted, and weighed. At Tono, the 3 landing sites with the largest fisher populations (i.e., bays 2, 3, and 4, ) were monitored simultaneously for 3 d and bays 1 and 5 were monitored for the remaining 2 d. The 2 landing sites at Bontanga were monitored simultaneously during the study period, while the single landing site at Golinga was only monitored from November 2016 to June 2017 as there was insignificant fishing during the preceding rainy season (Jul–Oct 2016).
Samples of the target fish species were collected from artisanal fishers from July 2016 to June 2017 at the Tono and Bontanga reservoirs and from November 2016 to June 2017 at the Golinga Reservoir. Fishers operate with gillnets of mesh sizes between 15 mm and 70 mm. The total lengths of the fish were measured to the nearest 0.1 cm using a fish measuring board. Each fish was then weighed with a digital weighing scale to the nearest 0.01g.
Length frequency data correction
Before the assessment steps, the length–frequency (LFQ) data collected were converted to the monthly catches for each target species, assuming that the sample adequately represents the length distribution of the total catch for the month (Supplemental Table S1). The LFQ data were then corrected by taking into account the selectivity of the gear. For this purpose, data from the field studies were processed and analyzed for gillnet selectivity using Pasgear II (Kolding and Skaalevik Citation2010). Details on the abundance of each species captured by gillnets of different mesh sizes at the 3 reservoirs are available (Supplemental Table S2). Pasgear II computes selectivity parameters using the SELECT statistical model method (Millar Citation1992, Millar and Fryer Citation1999, Millar and Holst Citation1997). Thereby, selectivity parameters are estimated indirectly from comparative data of observed catch frequencies across a series of mesh sizes using 5 different models (normal location, normal scale, log-normal, gamma, and bi- modal; Kolding and Skaalevik Citation2010). The model with the lowest deviance is selected as the best. To obtain the estimated (reconstructed) “true” frequencies of the monthly catches, the observed LFQ were finally corrected using a combined probability of the fleet selection (details: Supplemental Table S3).
Assessment approach
The TropFishR package
The R package TropFishR (Mildenberger et al. Citation2017) was used to assess the reservoir fisheries following the steps outlined in Sparre and Venema (Citation1998). TropFishR includes enhanced versions of all the functions in FAO-ICLARM Stock Assessment Tools II (FISAT II) (Gayanilo et al. Citation2005) with some more recent methods added. The package has traditional and updated versions of the electronical length frequency analysis (ELEFAN) method (Pauly Citation1980), used in growth parameter estimation, with new optimization techniques (Taylor and Mildenberger Citation2017), Millar’s nonlinear selectivity models (Millar and Holst Citation1997), and a complete set of methods for fisheries analysis with LFQ data. The package allows a stock assessment routine to derive reference levels (e.g., FMSY, F0.1) using yield per recruit modeling based on a single year of LFQ data (Mildenberger et al. Citation2017).
The individual steps of the length-based stock assessment outlined by Sparre and Venema (Citation1998) and for TropFishR by Mildenberger et al. (Citation2017) were implemented within a bootstrapping framework (Mildenberger et al. in prep., Schwamborn et al. Citation2019). This allows one to estimate uncertainty intervals for all parameters and avoid the seed effect (Schwamborn et al. Citation2019). The framework applies the 5 subsequent steps listed in the following sections to each resampled LFQ data set.
ELEFAN and growth parameters estimation
ELEFAN is a method to estimate growth parameters of the von Bertalanffy growth function (VBGF) from the progression of LFQ modes through time (Pauly Citation1980). It requires a vector with the mid-lengths of defined length classes, a matrix with catches in numbers per length class (rows) and per sampling time (columns), and a vector with the dates of the sampling times. The ELEFAN estimates the growth parameters following 3 steps: (i) “restructuring” of LFQ data according to a procedure that scores length bins based on deviations from a moving average across neighboring bins, (ii) calculation of the cumulative score for a given set of VBGF parameters based on the bin scores that are intersected by resulting growth curves, and (iii) search for VBGF parameters that result in the maximum score value (Mildenberger et al. Citation2017). After the LFQ adjustments, a bootstrapped ELEFAN with genetic algorithm optimization function (bootstrapped ELEFAN_GA) (Mildenberger et al. in prep., Schwamborn et al. Citation2019) was applied to the LFQ, allowing assessment of the uncertainties around the growth estimates. Total length measurements grouped into 1 cm class intervals were used to assess the growth parameters of the species using a seasonally oscillating von Bertalanffy growth function (soVBGF) (Pauly and Gaschutz Citation1979, Somers Citation1988):
(1)
(1)
where Lt is the total length of the fish at time t, L∞ is the asymptotic length of fish (cm), K is the rate at which Lt approaches L∞, and t0 is the theoretical age of the fish when Lt is equal to zero. S(t) = (CK∕2π) sin 2π(t − ts), C is a constant indicating the amplitude of the oscillation, typically ranging from 0 to 1 (a value >1 implies periods of shrinkage in length, which is rare), and ts is the fraction of a year (relative to the age of recruitment, t = 0) where the sine wave oscillation begins (i.e., turns positive).
An initial seed value of L∞ was based on Lmax, derived from the mean of the 1% largest fish in the sample and following the formula from Taylor (Citation1958):
(2)
(2)
The VBGF parameters were assessed using a moving average (MA) over 5 size intervals. Since the VBGF parameters are known to be sensitive to the MA setting (Taylor and Mildenberger Citation2017), the bootstrapped ELEFAN_ GA function was also rerun for each assessment with MA of 3 and 7 size intervals.
The estimated L∞ and K values were used to calculate the growth performance index (phi prime, φ′) defined by Pauly and Munro (Citation1984) as
(3)
(3)
If the LFQ of the fish from the individual reservoirs resulted in poor fits of the growth curve to the data, the data of the individual reservoirs were pooled for each species, resulting in significantly improved data sets per species (combined LFQ). The aggregation of LFQ increases the sample size, which is of high importance for ELEFAN (Mildenberger et al. in prep., Schwamborn et al. Citation2019). Growth parameters were then assessed for the combined datasets. The length-converted catch curves were conducted for each reservoir separately based on those growth parameters of the combined data sets. One additional output of the ELEFAN run in TropFishR is the parameter tanchor, which represents the fraction of the year where yearly repeating growth curves cross length equal to zero.
Mortality and exploitation rate
The instantaneous rate of total mortality (Z) was estimated by the linearized length-converted catch curve method:
(4)
(4)
where Ni is the number of individuals in length class I, dti is the time needed by the fish to grow in that class i (Pauly Citation1990, Pauly et al. Citation1995), a is the intercept, b corresponds to −Z, and t is the relative age (age − t0). The rate of natural mortality (M) was estimated using the empirical equation by Then et al. (Citation2015):
(5)
(5)
This approach is an update of Pauly’s growth-based method (Pauly Citation1980) of natural mortality estimation, recommended for data-poor situations. The method was used since the fisheries of the region is data-limited and no data on maximum age (tmax) are available for the target species. It should be noted that this approach is based on meta-analysis with a cross-validation prediction error of 0.6. Consequently, the uncertainties around the estimates of the total and fishing mortalities are compounded by the error associated with the natural mortality estimate. Fishing mortality rate (F) was estimated based on the relationship
(6)
(6)
The exploitation rate (E) was determined by
(7)
(7)
(Gulland Citation1971). Estimated values of E were then compared to a reference value of 0.5, which has been proposed as an upper level of sustainable exploitation for most fish species (Gulland Citation1971). The estimated exploitation rates were derived from maximum density values of distributions for each parameter obtained from the linearized length-converted catch curve through the bootstrapping approach. While F and M add up to Z on the level of the resamples, the maximum density estimates (and medians) do not have to add up, as the maximum density of each distribution is determined independently from the other parameters. The fishing mortality rate (F) estimate was also compared to the fishing mortality value at maximum sustainable yield (FMSY), defined (Zhou et al. Citation2012) as
(8)
(8)
Size at first capture
The mean length (Lc) at which 50% of the fish are retained by the gear was estimated from the individual observed catch frequencies of the different mesh sizes that are used to target species at each reservoir. The ogive selection routine of Pasgear II was used to estimate the Lc, assuming that the probability of capturing a fish is solely dependent on its length.
Stock size estimates through cohort analysis
A length-based virtual population analysis (VPA) (Jones Citation1984) was conducted to reconstruct the standing biomass of the stocks of the target species and to estimate fishing mortality per length class using the L∞ and K values from the bootstrapped ELEFAN_GA analysis. The annual mean value of F derived through the length-converted catch curve was used as an estimate for the fishing mortality of the last length class (terminal F). The last length classes, with low catch numbers, were grouped into plus groups for each species. The length-based VPA is based on the following two equations:
(9)
(9)
(10)
(10)
where N is the stock size in numbers, C is the catch, F is the fishing mortality, and M is the natural mortality. The biomasses of the different length classes were calculated with the length–weight relationship formula using the constant (a) and the exponent (b) values derived from the data of the study ().
Relative yield per recruit (Y'/R) and reference points
The model of Thompson and Bell (Citation1934), which estimates yields, biomass, and value as a function of fishing effort (or fishing mortality) and gear selectivity parameters, was used to predict (a) the fishing mortality that produces the highest yield per recruit (Fmax), (b) the fishing mortality that results in a 50% reduction of the biomass compared to the unexploited population (F0.5), and (c) a fishing mortality that corresponds to 10% of the slope of the yield per recruit curve at the origin (F0.1). This model builds on the output of the length-based VPA with the following input parameters: K (annual growth coefficient); ta (anchor point); L∞ (asymptotic length); M (Natural mortality); a (constant of LWR); b (exponent of LWR); Lr (length at recruitment to fishery); and L50 and L75 (selectivity parameters) (Thompson and Bell Citation1934, Sparre and Venema Citation1998). The 3 reference points, namely, Fmax, F0.5, and F0.1, with their confidence intervals, were used to determine the exploitation status of the 3 stocks of Bontanga, Tono, and Golinga reservoirs.
Length-based indicators for sustainable catches
Froese (Citation2004) proposed 3 length-based metrics indicative of sustainable fishing. These metrics form our second approach for the assessment of stock status, which are:
Pmat: the proportion of mature fish in the catch, with 100% as the reference target point, based on the formula
(11)
where Lm is the length at first sexual maturity. The desirable target would be to let as many fish as possible spawn at least once before they are caught, to rebuild and maintain healthy spawning stocks (Froese Citation2004). The total length at first sexual maturity was based on published research on the species (Adite and Van Thielen Citation1995, Akongyuure et al. Citation2017b, Duponchelle and Panfili Citation1998, Kwarfo-Apegyah and Ofori-Danson Citation2010, Lederoun et al. Citation2016, Ofori-Danson et al. Citation2008). The mean Lm values corresponded to 7.9 cm, 11.9 cm, and 11.3 cm for C. zillii, O. niloticus, and S. galilaeus, respectively.
Popt: the proportion of fish within a 10% range around the optimum length (Lopt) in the catch, with 100% as the reference target, based on the formula
where
The Lopt for the target species based on the preceding formula were 7.7 cm, 11.9 cm, and 11.3 cm for C. zillii, O. niloticus, and S. galilaeus, respectively.
Pmega: proportion of “mega-spawners” in the catch, with 30–40% as a desirable target reference point, based on the formula (Froese Citation2004)
The lengths (Lmega) for the Pmega calculation were 8.5, 13.1, and 12.40 cm for C. zillii. O. niloticus, and S. galilaeus, respectively.
Following a decision tree procedure by Cope and Punt (Citation2009), the 3 proportions were summed (Pmat + Popt + Pmega) to obtain Pobj, an indicator of stock status above spawning biomass (SB) reference points. The Pobj allows for differentiation of selectivity patterns, as the authors observed that Pobj had a more consistent relationship with spawning biomass (SB) than any of the individual metrics (Pmat, Popt, or Pmega) and that different selectivity patterns in the fishery were associated with a range of values of Pobj. Once a selectivity pattern is established based on Pobj, threshold values of Pmat, Pobj, and/or the Lopt/Lm ratio point to an estimated probability of the stock spawning biomass (SB) being below established reference points, either 40% or 20% of the unfished spawning biomass (0.4SB or 0.2SB).
Results
Eighteen thousand and fifty-nine fish were measured, consisting of 5,238 C. zillii, 6,473 O. niloticus, and 6,348 S. galilaeus. Monthly catch varied significantly among the species and the reservoirs. The lowest catch was at Golinga, where no significant commercial catches were obtained from July 2016 to November 2016 (). Details on the size composition are available in and .
Table 2. Summary statistics and length‐weight relationships of the target fish species from Bontanga, Tono, and Golinga reservoirs of northern Ghana.
Table 3. Catch (in tonnes) of Coptodon zillii, Oreochromis niloticus, and Sarotherondon galilaeus recorded through field survey at Tono, Bontanga, and Golinga reservoirs from July 2016 to June 2017.
Catch and gillnet selection correction
For the 3 species, at all the reservoirs, the period coinciding with the dry season (Jan–Jun) required a higher raising factor for the catch and gillnet selectivity correction than the raining season (Supplemental Table S1) due to reduced fishing activities as fishers add crop and vegetable production to their livelihood activities. The correction for gillnet selectivity was applied across the total length classes for the species based on the combined fleet selectivity (Supplement Table S3).
Growth parameters
The maximum density values after 500 resamples were closer to the upper limit of the respective confidence intervals. The maximum density estimates of K were similar between species: 0.71, 0.85, and 0.79/yr for C. zillii, O. niloticus, and S. galilaeus, respectively (). Sarotherondon galilaeus had the narrowest confidence intervals for L∞ and K, while O. niloticus and C. zillii had the highest uncertainties for the L∞ and K estimates, respectively (, ). The growth performance index values were similar among the 3 species and were within 2.40 and 2.78. The maximum density estimates of the parameter tanchor were 0.41, 0.52, and 0.64, representing the months of June, July, and September, where yearly repeating growth curves cross length equal to zero for C. zillii, O. niloticus, and S. galilaeus, respectively. The results of the ELEFAN assessments using an MA of 3 and 7 size intervals are available in .
Figure 2. Size distribution of O. niloticus, S. galilaeus, and C. zillii landings observed from July 2016 to June 2017 at Bontanga, Tono, and Golinga reservoirs of northern Ghana. The vertical lines represent the length-based reference values: length at first maturity (dashed line), optimum length Lopt (dotted line), and starting length of mega-spawners (“dot-dashed” line).
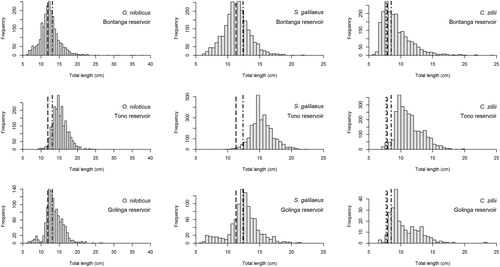
Figure 3. Scatter histogram of bootstrapped ELFFAN with genetic algorithm optimisation for the target species from 3 reservoirs using TropFishR. The points represent the individual combinations of L∞ and K estimates, while the contours represent the density of the combinations. The histograms represent the marginal distributions of the L∞ and K estimates, respectively.
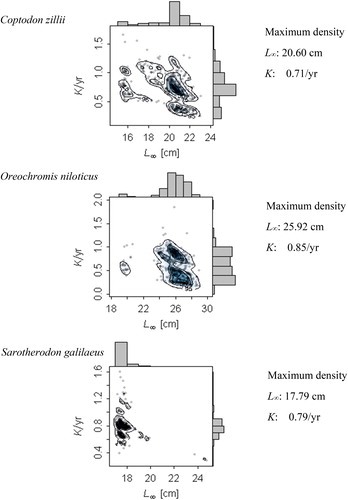
Table 4. Parameter estimates (mode of marginal distribution, Mod) of the seasonally oscillating von Bertalanffy growth function of the target fish species from reservoirs assessed with the bootstrapped electronic length frequency analysis with genetic algorithm function of TropFishR. Estimates based on the pooled length-frequency data of Tono, Bontanga, and Golinga reservoirs collected from July 2016 to June 2017. Lower and upper denote 95% confidence interval of the estimates.
Mortality and exploitation rate estimates
Estimates of total mortality were computed by applying the growth parameters of the pooled data assessed with MA of 5 to the individual LFQ data of the species. It should be noted that the natural mortality (M) value was assumed to be the same for a species across the reservoirs. Total and fishing mortalities, however, differed among the species and the reservoirs. The estimated exploitation rates for the different species in the 3 reservoirs ranged from 0.23 to 0.66/yr with confidence intervals within the range of 0.31–0.77/yr (, ). The maximum density values and confidence intervals of the exploitation rate of C. zillii stock at Bontanga and S. galilaeus at Golinga were below the optimal exploitation rate (E0.5). Oreochromis niloticus stock at Tono Reservoir had maximum density and confidence interval values above the optimal exploitation rate (E0.5). The rest of the stocks had maximum density and confidence intervals spanning between underexploitation and overexploitation. The length-frequency data of S. galilaeus stock in the Tono Reservoir did not allow for the running of linearized length-converted catch curve with the growth parameters from the ELEFAN with an MA equal to 5. However, the results on the exploitation of this stock assessed with an MA of 3 is presented in . The results indicate that most of the data points selected for the estimation of Z value for S. galilaeus and C. zillii after 500 resample were within the confidence limits, while O. niloticus had a wider distribution of data points ().
Figure 4. Length-frequency histograms with the growth curves (dashed lines) obtained through the bootstrapped ELEFAN with GA analysis superimposed for Coptodon zillii, Oreochromis niloticus, and Sarotherodon galilaeus. The bars represent the restructured length frequency data, where black bars indicate positive peaks and white bars represent negative peaks. The method tries to maximize the number of positive peaks hit. The faint blue and red colors emphasize positive and negative peaks, respectively.
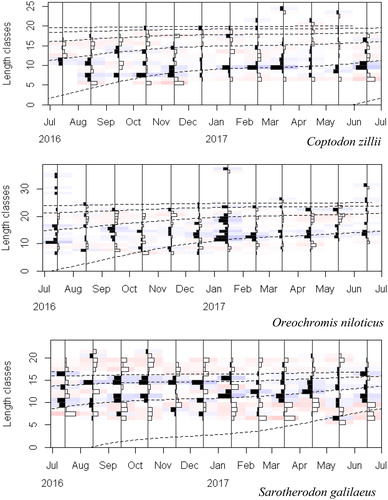
Figure 5. Bootstrapped linearized length-converted catch curve based on 1-yr catch data with selectivity correction. (a) C. zillii-Bontanga, (b) C. zillii-Tono, (c) C. zillii-Golinga, (d) O. niloticus-Bontanga, (e) O. niloticus-Tono, (f) O. niloticus-Golinga, (g) S. galilaeus-Bontanga, and (h) S. galilaeus-Golinga. The circles represent the points of the catch curve, which was applied to each resampled data set. The line represents the regression line corresponding to the maximum density estimates of the 500 estimated catch curves. The blue shaded area represents the 95% confidence interval for the maximum density regression line.
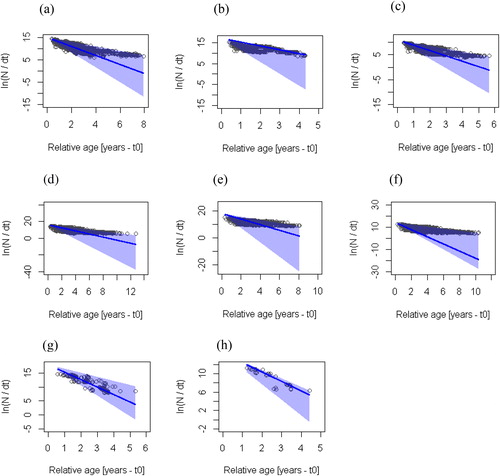
Table 5. Estimated mortality values (Z, M, and F), exploitation rate (E), and biological reference points of fishing mortality (FMSY, Fmax, F0.1, F0.5) for the target species of Tono, Bontanga, and Golinga reservoirs. Mod: mode of the marginal distribution. Low (lower) and Upp (upper) denote 95% confidence interval of the estimates. Estimates are based on the pooled growth parameters with moving average of 5, hence the M estimate of a species is a common value for all reservoirs.
Size at first capture
The mean length (Lc) at first capture varied among the species and the reservoirs. Coptodon zillii had the lowest Lc values, while those of O. niloticus and S. galilaeus were higher. Bontanga had the lowest Lc values, whereas Tono Reservoir had the highest Lc values for the 3 target species ().
Stock size estimates by cohort analysis
Coptodon zillii had the lowest biomass per unit of area in all the 3 reservoirs, with 3.08, 0.87, and 0.45 tonnes/km2 at Bontanga, Tono, and Golinga, respectively. Oreochromis niloticus biomass at Bontanga, Tono, and Golinga were 6.19, 6.03, and 13.05 tonnes/km2, respectively, while S. galilaeus had the highest biomass per unit of area in all the 3 reservoirs with 10.66, 9.33, and 16.52 tonnes/km2 at Bontanga, Tono, and Golinga, respectively. Overall, the 3 cichlid stocks combined had a biomass of 30.02 tonnes/km2 at Golinga, 19.93 tonnes/km2 at Bontanga, and 16.23 tonnes/km2 at Tono ().
Table 7. Proportions of mature fish (Pmat), optimum-sized fish (Popt), larger than optimum size fish (Pmega), and Pobj (= Pmat + Popt + Pmega) for each species, and from the 3 reservoirs based on the indicators proposed by Froese (Citation2004) and the formulas described in the Methods section. Stock condition interpretation is based on a decision tree proposed by Cope and Punt (Citation2009), aimed to assess whether spawning biomass (SB) is above (>) or below (<) a reference point (RP) of 0.4 unfished biomass. The last column indicates the estimated probability of SB being lower than 0.4 of unfished biomass based on the same authors. For further details refer to Supplemental Table S4.
Yield per recruit reference points
The estimated current fishing mortality values of the stocks are lower than the Fmax values predicted to give maximum relative yield per recruit, but were close to the F0.5 values (, ), indicating that the current fishing mortality maintains 50% of the biomass of the stock and the stocks are not overexploited but rather fully exploited. Comparing F0.1 to F indicates that the current fishing mortality rates of S. galilaeus in Bontanga and Golinga and those of O. niloticus in Tono and Golinga are below the rates at which the marginal yield per recruit is only 10% of the marginal yield-per-recruit of the unexploited stock. Although the 3 species showed slight differences in the Fmax values, the estimates for O. niloticus were similar across the 3 reservoirs. Similarly, the F0.5 values were close among the species and the reservoirs ().
Length-based indicators
The length-based indicators (LBI) show that the cichlid stocks at the Tono Reservoir have spawning biomasses above 0.4, which is the unfished biomass reference point. The cichlid stocks spawning biomasses at Bontanga were all below 0.4. The LBI analysis suggests that at Golinga only C. zillii has spawning biomass above the reference biomass of 0.4 times the unfished biomass. The length distribution of the fish caught at the reservoirs (, ) indicates that the 3 stocks at Tono had landings with 98% of the fish having a probability of being sexually mature of 50% (regarding the length at first sexual maturity). The landings at Bontanga had between 55 and 66% of fish being above the length at first sexual maturity, while the proportion of the landings at Golinga that had fish above the length at first sexual maturity spanned between 80 and 95%. Tono and Bontanga had the highest and the lowest Pmega values respectively for all the species. Pmat values followed the same order. Golinga had the highest Popt values for O. niloticus and S. galilaeus, while Bontanga had the highest Popt value for C. zillii. The lowest Popt values for all the species were at Tono ().
Table 6. Biomass (in tonnes) of Coptodon zillii, Oreochromis niloticus, and Sarotherondon galilaeus estimated using Jones’s cohort analysis.
Discussion
Length frequency analysis using TropFishR
Inland fish stocks in the tropics are largely assessed with length-based methods since other approaches (such as otolith techniques) are more difficult and costly to use. However, in northern Ghana, length-frequency data are not available from the fisheries authorities. This research, therefore, was conducted to obtain data for length-based assessments. We assumed that target fish stocks in systems with similar ecological characteristics but different fishing pressure may be effectively assessed by (1) pooling the individual length-frequency data of the studied reservoir systems for deriving common growth parameters and then (2) analyzing the fisheries exploitation and stock sizes for each reservoir system using individual system length-frequency data. Additionally, through the correction of the length-frequency data for gear selection and raising it to represent the total catch of the system over the study period, we achieved more robust and stable estimates of mortality. When length-frequency data are available without any information on gear selection, a study on gear selectivity of the same or related species from a similar system with detail information on gear and mesh sizes can be used to either estimate or assume the selectivity curve of the interested system. The gillnet selectivity of this study can thus be applied to the species in other reservoir systems of the region where no selectivity studies have been carried out.
Growth parameter estimates
The growth parameters obtained in our study for O. niloticus resemble those of populations studied in the reservoirs of Burkina Faso reported by Baijot and Moreau (Citation1997). For S. galilaeus our estimated asymptotic length (L∞ = 17.8 cm) is within what has been reported for this species in other reservoirs of West Africa, and our L∞ and K estimates resemble those reported by Baijot and Moreau (Citation1997) for populations in Loumbila and Ramitenga reservoirs in Burkina Faso. The similarity in the growth pattern of these two species can be attributed to the similar climatic conditions between Burkina Faso and the Northern sector of Ghana. However, studies on the same species in Doukon and Togbadji reservoirs in Benin by Lederoun et al. (Citation2016) depict a larger asymptotic length, while the K estimates are comparable to those reported in this study (). The growth parameters of the target species estimated in our study are also similar and comparable to those reported for C. zillii and O. niloticus in a previous study of the Bontanga Reservoir by Ofori-Danson et al. (Citation2008) but differ for S. galilaeus. The difference in the case of S. galilaeus could be a result of a more precise estimation of the growth parameters in our study due to methodological improvements from the previous study. The growth of C. zillii has not been extensively studied in West Africa. A study on Sourou Reservoir by Baijot and Moreau (Citation1997) reported slightly larger L∞ and K values compared to our estimated values.
Table 8. Growth parameters (L∞ = Asymptotic length and K = Growth coefficient), mortality estimates (Z = Total mortality, M = Natural mortality, and F = Fishing mortality), and exploitation rates (E) from different fishing areas in West Africa, including the estimates of the present study.
Fisheries exploitation
While the use of different MAs and bin sizes revealed differences in the levels of uncertainty associated with growth and mortality parameters and stock conditions, the estimated qualitative exploitation rate (i.e., underexploited, optimal, or overexploited) was not sensitive to these differences for 6 out of the 8 assessments that were conducted using the 3 MA settings. The bootstrapped linearized length-converted catch curve approach depicts that stocks assessed as underexploited or overexploited (considering the highest density of the estimated exploitation rate) may have confidence limits that are entirely within the limits of underexploitation (E ≤ 0.5) or overexploitation (E ≥ 0.5) or have the lower limit as underexploited and the upper limit in the range of overexploitation. The stocks of C. zillii at the Bontanga and Golinga reservoirs both had estimated exploitation rates below 0.5, but the uncertainty around the estimate was far larger for Golinga than for Bontanga. Knowledge of the uncertainty of parameter estimates reflects the uncertainty in the data and can inform data monitoring (e.g., whether available data are sufficient and which length classes are underrepresented). Furthermore, the uncertainties can inform managers about the applicability and suitability of certain assessment methods and can be used when comparing results from different assessment approaches. Most importantly, the parameter uncertainties can be used in the definition of stochastic harvest control rules (e.g., in defining a harvest control rule that allows a 5% probability of the stock falling below a biomass reference point).
The assessment of the 3 target species in Bontanga by Ofori-Danson et al. (Citation2008) indicated that these species were underexploited, whereas our study suggests that C. zillii and S. galilaeus are under optimal exploitation, and O. niloticus is overexploited. The shift from under- to overexploitation for this species is likely due to the increase in the number of active fishers from 61 in 2009 (Alhassan et al. Citation2014) to the current fisher population of 96. At Tono, the largest reservoir in northern Ghana and under great fishing pressure, our work is the first to provide information on the state of the exploited resources. While we recorded 417 active fishermen during our study, Akongyuure et al. (Citation2017a) estimated the total number of fishers operating on the reservoir as 950. This could help explain the very high exploitation rates obtained for the target species in this reservoir.
In the Golinga Reservoir, the cichlid resources appear to be underexploited, presumably because this reservoir is left unexploited for a quarter of the year due to the comparative advantage of crop production that the Golinga fishers engage in during the main farming season from July to October. A full-year exploitation cycle will likely cause an increase in exploitation rates for all the species in the future. It is expected that any revamping (e.g., desilting and expansion of reservoir surface area) of the reservoir would accelerate fishing activities and may require access regulation to maintain the sustainable exploitation of the resources.
Overall, the parameters of the assessment reveal that the stocks are optimally exploited and the proportions of fish targeted seem adequate for the reservoirs fisheries sustainability. However, the present level of full exploitation of the target resources indicates no scope for further development and effort increase of the fisheries. The fishery at Tono Reservoir is driven by market preferences. Large-sized Oreochromis niloticus, which are mostly spawners, are substantially targeted. If the current exploitation rate of 0.55/yr is not reduced, recruitment overfishing may prevail in the future. To prevent an increase in fishing effort, access rights to the fishery at Tono, Bontanga, and Golinga reservoirs need to be formalized and regulated by Kassena Nankana Municipal Assembly and Kumbungu and Tolon District Assemblies, respectively. Fishing community leaders and fisher groups should be involved in this process.
Length-based indicators
Commercial fishing leads to changes in the size composition of the fished populations, so that simple length indicators of the fished population may be used to estimate the degree of exploitation (Arlinghaus et al. Citation2008, de Castro et al. Citation2015, Froese Citation2004, Miranda and Dorr Citation2000). Length compositions of caught fish should demonstrate the conservation of large, mature individuals (Berkeley et al. Citation2004). The LBI depicting that the spawning biomass of the stocks at Tono is above reference point is in contradiction to the exploitation rates obtained for C. zillii and O. niloticus based on the linearized length-converted catch curve analysis. The high Pmega values for the stocks at Tono indicate that a large fraction of mature individuals/mega spawners are available in the reservoir and confirms the market-driven size-selective fishery ongoing at the reservoir. Considering the high Pmega values, the overexploitation of the C. zillii and O. niloticus stocks in Tono Reservoir may trigger recruitment overfishing, if a less selective fishing pattern is not adopted. Less selective fishing patterns have been observed to preserve the relative proportion of the components in the fish community. This phenomenon has been achieved in several high-yielding small-scale inland fisheries in Africa by largely maintaining a balanced reduction of all species and size groups (Misund et al. Citation2002, Kolding et al. Citation2003, Kolding and van Zwieten Citation2011, Kolding et al. Citation2014, Kolding et al. 2015). The results of the exploitation pattern at Tono, thus, call for a reconsideration of size-based regulations for the management of the reservoir fisheries. On the contrary, the size distribution of catches at the Bontanga Reservoir shows intensive exploitation of immature or small-sized fish. The retention of immature fish by gillnets at Bontanga is also evident from the low estimates of Lc for all the 3 species. This supports a previous study by Kwarfo-Apegyah and Ofori-Danson (Citation2010) that revealed that the target resources at Bontanga Reservoir had small sizes, with total length at first maturity corresponding to 11.8 cm, 9.3 cm, and 5.9 cm for O. niloticus, S. galilaeus, and C. zillii, respectively.
Before the creation and enforcement of gear and mesh size regulations, the management of reservoir fishery resources should consider funding monitoring projects to obtain essential information about the fisheries through relatively simple and less costly stock assessment approaches: for example, the estimation of biological reference points and length-based indicators from routinely collected length-frequency and gear selectivity data. This is because restrictions that are not based on the knowledge of a fishery are likely to be ineffective in managing it. We suggest that the Fisheries Commission of Ghana should consider collaborating with the universities to conduct joint sample-based surveys at least biennially. This will help to assess changes in stock and update management strategies.
Stock size
The high productivity of the resources in the smallest reservoir (Golinga) is consistent with studies that indicate that shallow and smaller African lakes are the most productive and that fish productivity generally declines with increasing lake size (Downing Citation2010, Fernando and Holčík Citation1982). The study on Bagré Reservoir in Burkina Faso by Villanueva et al. (Citation2006) reported biomasses of 5.12, 3.11, and 0.81 tonnes/km2 for S. galilaeus, O. niloticus, and C. zillii, respectively, which are comparable to the biomasses of the species estimated in Tono Reservoir. The higher biomass of C. zillii at Bontanga compared to Tono, Golinga, and Bagré reservoirs is most likely attributable to the low exploitation of the species over time. Similarly, the relatively high biomass of O. niloticus at Golinga also reflects the current exploitation rate (0.23/yr) of the species, which could be increased if fishing continues to be seasonal. The biomasses of S. galilaeus populations at Bontanga and Golinga are higher than in the much larger Tono and Bagré reservoirs, which could be due to the species preference for small, shallow, and highly productive systems.
Conclusions
The use of two approaches in assessing the resources of the reservoirs offers a broader understanding of the status of the fisheries exploitation and their sustainability. Bootstrapped length-frequency analysis with TropFishR provided a holistic and robust assessment of the fisheries with sequential estimation of growth, mortality, exploitation rates, stock size parameters, and biological reference points, with associated uncertainties.
The length-based indicator approach allowed us to make a rapid and relatively simple decision on the sustainability of the fisheries based on spawning biomass reference points. The LBI provides an indirect assessment of fishing impact and the effect of gear selection on stock size composition. It has been noted that the cost, complexity, and lack of technical capacity in many countries have made the scientific assessment and sustainable management of data-poor fisheries a persistent problem (Prince and Hordyk Citation2018). This is particularly the case for reservoir fisheries in many tropical countries. Although the BFSA approach is robust and can pass as the best assessment framework for the determination of management reference points for reservoir exploited stocks, in extremely data-poor fisheries, where personnel are limited, the LBI method can provide limited preliminary assessment of the fisheries sustainability.
Our findings suggest that the target resources of Golinga are optimally exploited, likely due to the fact that fishing activities are limited to only 8 mo of the year. While the length-frequency assessment shows no indication of overexploitation of the fishery resources at Bontanga, fishing pressure on immature C. zillii population is high and may become critical if it is increased, since the current Lc is below the length at first maturity and is also below the lower limit of the Lopt range. Therefore, managing this stock will require that fishers at Bontanga agree to create bylaws that provide size control measures (e.g., restrictions on fishing on nursery grounds) to reduce immature proportions of current landings. The fishing pressure on large-sized C. zillii and O. niloticus populations at Tono Reservoir should be reduced to avert recruitment overfishing. Fisheries at Golinga can be sustainably exploited with the prevailing fishing pressure and pattern, which depict underexploitation of the fisheries resources. Further research to generate adequate data and knowledge on size composition of fish landings from major reservoirs, gear selectivity, and sizes at first sexual maturity of commercially important species is recommended to improve assessment and thus management advice of reservoir fisheries resources in Ghana.
Conflict of interest
None to declare.
Supplemental Material
Download MS Word (51.8 KB)Acknowledgments
The authors are grateful to fishers of Tono, Bontanga, and Golinga reservoirs for allowing us to sample and measure their catch. We thank Leibniz Centre for Tropical Marine Research (ZMT) and Deutscher Akademischer Austauschdienst (DAAD) for granting us funds for the data collection. We are also grateful to Isaac Ansong Kissi and Jones Wonder Oyiadzo of the University for Development Studies, Ghana, for assisting with the data collection. We are equally thankful to M. Stäbler, P. Herrón, P. Tuda, L. Chong, and P. Curry for their encouragement and support in the writing of this article. We also appreciate the constructive comments of the editor, the associate editor, and the three anonymous reviewers.
Additional information
Funding
Related Research Data
References
- Abache G. 2015. The contribution of Tono Reservoir Fisheries to household livelihoods in selected communities in the Kassena Nankana East District of the Upper East Region of Ghana [master’s thesis]. [Kumasi (Ashanti), Ghana]: Kwame Nkrumah University of Science and Technology.
- Abban EK, Kwarfo-Apegyah K, Amedorme K. 2002. Fish monitoring in relation to Onchocerciasis Control Programme in Ghana. CSIR–Water Research Institute, Accra, Ghana, Annual Report.
- Abubakari A. 2015. Impact of land use changes on soil erosion and sedimentation in the Tono Reservoir Watershed using Geowepp Model [master’s thesis]. [Kumasi (Ashanti), Ghana]: Kwame Nkrumah University of Science and Technology.
- Adite A, Van Thielen R. 1995. Ecology and fish catches in natural lakes of Benin, West Africa. Environ Biol Fishes. 43:381–391. doi:10.1007/BF00001173.
- Akongyuure D, Amisah S, Agyemang T, Edziyie R. 2017a. Tono Reservoir fishery contribution to poverty reduction among fishers in northern Ghana. Afr J Aquat Sci. 42:143–154. doi:10.2989/16085914.2017.1344120.
- Akongyuure DN, Amisah S, Agyemang TK. 2017b. Gillnet selectivity estimates for five commercially important fish species in Tono Reservoir, Northern Ghana. Lakes Reserv Res Manage. 22:278–289. doi:10.1111/lre.12188.
- Alhassan EH, Aduri E, Akongyuure DN. 2014. Frame survey and fish catch assessment of the Bontanga Reservoir in Northern Ghana. Journal of Biodiversity and Environmental Sciences. 4:349–356. http://udsspace.uds.edu.gh/bitstream/123456789/218/1/FRAME%20SURVEY%20AND%20FISH%20CATCH%20ASSESSMENT%20OF%20THE%20BONTANGA%20RESERVOIR%20IN%20NORTHERN%20GHANA.pdf
- Amevenku F, Quarcoopome T. 2006. Fish and fisheries of Bontanga and Libga reservoirs in northern Ghana, West Africa. West Afr J Appl Ecol. 10:9–19.
- Arlinghaus R, Klefoth T, Kobler A, Cooke SJ. 2008. Size selectivity, injury, handling time, and determinants of initial hooking mortality in recreational angling for northern pike: the influence of type and size of bait. North Am J Fish Manage. 28:123–134. doi:10.1577/M06-263.1.
- Baijot E, Moreau J. 1997. Biology and demographic status of the main fish species in the reservoirs of Burkina Faso. Hydrobiological aspects of fisheries in small reservoirs in the Sahel region. Technical Center for Agricultural and Rural Cooperation ACP-EU, Wageningen, The Netherlands. p. 79–110.
- Berkeley SA, Hixon MA, Larson RJ, Love MS. 2004. Fisheries sustainability via protection of age structure and spatial distribution of fish populations. Fisheries. 29:23–32. doi:10.1577/1548-8446(2004)29[23:FSVPOA.2.0.CO;2]
- Cope JM, Punt AE. 2009. Length-based reference points for data-limited situations: applications and restrictions. Mar Coastal Fish Dynam Manage Ecosystem Sci. 1:169–186. doi:10.1577/C08-025.1.
- de Castro F, Shephard S, Kraak SB, Reid DG, Farnsworth KD. 2015. Footprints in the sand: a persistent spatial impression of fishing in a mobile groundfish assemblage. Mar Biol. 162:1239–1249. doi:10.1007/s00227-015-2665-1.
- Deines AM, Bunnell DB, Rogers MW, Bennion D, Woelmer W, Sayers MJ, Grimm AG, Shuchman RA, Raymer ZB, Brooks CN. 2017. The contribution of lakes to global inland fisheries harvest. Front Ecol Environ. 15:293–298. doi:10.1002/fee.1503.
- Diekkrüger D, Liebe J. 2002. Estimation of water storage capacity and evaporation losses of small reservoirs in the Upper east region of Ghana [master’s thesis]. [Bonn (North Rhine-Westphalia), Germany]: Rheinische Friedrich Wilhelms Universität Bonn.
- Downing JA. 2010. Emerging global role of small lakes and ponds. Limnetica. 29:0009–0024.
- Duponchelle F, Panfili J. 1998. Variations in age and size at maturity of female Nile tilapia, Oreochromis niloticus, populations from man-made lakes of Côte d'Ivoire. Environ Biol Fishes. 52:453–465.
- Fernando C, Holčík J. 1982. The nature of fish communities: a factor influencing the fishery potential and yields of tropical lakes and reservoirs. Hydrobiologia. 97:127–140. doi:10.1007/BF00011966.
- Fisheries Act. 2002. Act 625. Accra, Ghana: Government Printer, Assembly Press.
- Food and Agriculture Organization of the United Nations. 2016. The State of World Fisheries and Aquaculture 2016. Contributing to food security and nutrition for all. Rome (Italy): FAO.
- Food and Agriculture Organization of the United Nations and Michigan State University. 2016. The Rome declaration: 10 steps to responsible inland fisheries. Rome: Food and Agriculture Organization of the United Nations, and East Lansing: Michigan State University.
- Froese R. 2004. Keep it simple: three indicators to deal with overfishing. Fish Fisheries. 5:86–91. doi:10.1111/j.1467-2979.2004.00144.x.
- Froese R, Binohlan C. 2000. Empirical relationships to estimate asymptotic length, length at first maturity and length at maximum yield per recruit in fishes, with a simple method to evaluate length frequency data. J Fish Biol. 56:758–773. doi:10.1111/j.1095-8649.2000.tb00870.x.
- Gayanilo FC, Sparre P, Pauly D. 2005. FAO-ICLARM stock assessment tools II: User's guide. Rome (Italy): Food & Agriculture Organization.
- Gulland JA. 1971. The fish resources of the ocean. West Byfleet (UK): Fishing News (Books) Ltd.
- Jones R.1984. Assessing the effects of changes in exploitation pattern using length composition data (with notes on VPA and cohort analysis). FAO Fisheries Technical Paper 256.
- Kolding J, Musando B, Songore N. 2003. Inshore fisheries and fish population changes in Lake Kariba. FAO Fisheries Technical Paper 2:67–99.
- Kolding J, Skaalevik A. 2010. Pasgear II version 2.4. BErgne (Norway): University of Bergen. http://www.imr.no/forskning/utviklingssamarbeid/eaf_nansen_programmet/pasgear_2/en.
- Kolding J, van Zwieten PA. 2011. The tragedy of our legacy: how do global management discourses affect small scale fisheries in the south? Forum for Development Studies, Norway: Taylor & Francis. p. 267–297. doi:10.1080/08039410.2011.577798.
- Kolding J, Béné C, Bavinck M. 2014. Small-scale fisheries—importance, vulnerability, and deficient knowledge. In Garcia SM, Rice J, Charles A, editors. Governance of Marine Fisheries and Biodiversity Conservation: Interaction and Coevolution. Ottawa (Canada): John Wiley & Sons, Ltd. p. 317–331.
- Kolding J, Jacobsen NS, Andersen KH, van Zwieten PA. 2015. Maximizing fisheries yields while maintaining community structure. Can J Fish Aquati Sci. 73:644–655. doi:10.1139/cjfas-2015-0098.
- Kwarfo-Apegyah K. 2008. Ecology and stock assessment of major fish species of Bontanga Reservoir for sustainable management [dissertation]. [Legon (Greater Accra, Ghana)]: University of Ghana.
- Kwarfo-Apegyah K, Ofori-Danson PK. 2010. Spawning and recruitment patterns of major fish species in Bontanga Reservoir, Ghana, West Africa. Lakes Reserv Res Manage. 15:3–14. doi:10.1111/j.1440-1770.2010.00418.x.
- Lederoun D, Vandewalle P, Brahim A, Moreau J, Lalèyè P. 2016. Population parameters and exploitation rate of Sarotherodon galilaeus galilaeus (Cichlidae) in Lakes Doukon and Togbadji, Benin. Afr J Aquat Sci. 41:151–160. doi:10.2989/16085914.2016.1169988.
- Lynch AJ, Cooke SJ, Deines AM, Bower SD, Bunnell DB, Cowx IG, Nguyen VM, Nohner J, Phouthavong K, Riley B. 2016. The social, economic, and environmental importance of inland fish and fisheries. Environ Rev. 24:115–121. doi:10.1139/er-2015-0064.
- Mdemu MV. 2008. Water productivity in medium and small reservoirs in the Upper East Region (UER) of Ghana. ZEF. [PhD thesis]. [Bonn, Germany]: Universität Bonn.
- Mensah CA. 2012. Optimisation of profit in the artisanal marine fishing: a case study of Sekondi fishing harbour. [master's thesis]. [Kumasi (Ashanti), Ghana]: Kwame Nkrumah University of Science and Technology.
- Mérona BD. 1983. Modèle d'estimation rapide de la croissance des poissons: application aux poissons d'eau douce d'Afrique. http://www.ifremer.fr/avano/.
- Mildenberger TK, Taylor MH, Wolff M. 2017. TropFishR: an R package for fisheries analysis with length‐frequency data. Methods Ecol Evolut 8:1520–1527.
- Millar RB. 1992. Estimating the size-selectivity of fishing gear by conditioning on the total catch. J Am Stat Assoc. 87:962–968. doi:10.2307/2290632.
- Millar RB, Fryer RJ. 1999. Estimating the size-selection curves of towed gears, traps, nets and hooks. Rev Fish Biol Fish. 9:89–116.
- Millar RB, Holst R. 1997. Estimation of gillnet and hook selectivity using log-linear models. ICES J Mar Sci. 54:471–477. doi:10.1006/jmsc.1996.0196.
- Miranda LE, Dorr BS. 2000. Size selectivity of crappie angling. North Am J Fish Manage. 20:706–710. doi:10.1577/1548-8675(2000)020<0706:SSOCA>2.3.CO;2.
- Misund OA, Kolding J, Fréon P. 2002. Fish capture devices in industrial and artisanal fisheries and their influence on management. In: Handbook of fish biology and fisheries vol. 2. p. 13–36. Australia: Blackwell Publishing
- MoFA (Ministry of Food and Agriculture). 2012. Ghana National Aquaculture Development Plan. p. 123. http://extwprlegs1.fao.org/docs/pdf/gha149443.pdf.
- MoFA (Ministry of Food and Agriculture). 2018. Survey on small scale irrigation and dugout reservoirs. http://mofa.gov.gh/site/?page_id=6664.
- Obodai E, Waltia S. 2003. Preliminary observations on fishing activities in the Tono Dam, Upper-East Region, Ghana. J Ghana Sci Assoc. 5:69–76.
- Ofori-Danson P, Kwarfo-Apegyah K, Nunoo F. 2008. An assessment of cichild fishery of Bontanga Reservoir, Northern Ghana. West Afr J Appl Ecol. 14:1–17.
- Okrah M. 2010. Economic dimensions of inland fisheries of the upper east region of Ghana. Kumasi (Ghana): Department of Planning, Kwame Nkrumah University of Science and Technology.
- Pauly D. 1980. On the interrelationships between natural mortality, growth parameters, and mean environmental temperature in 175 fish stocks. ICES J Mar Sci. 39:175–192. doi:10.1093/icesjms/39.2.175.
- Pauly D. 1990. Length-converted catch curves and the seasonal growth of fishes. Fishbyte. 8:33–38.
- Pauly D, Gaschutz G. 1979. A simple method for fitting oscillating length growth data, with a program for pocket calculators. ICES CM. 6:24.
- Pauly D, Moreau J, Abad N. 1995. Comparison of age-structured and length-converted catch curves of brown trout Salmo trutta in two French rivers. Fish Res. 22:197–204. doi:10.1016/0165-7836(94)00323-O.
- Pauly D, Munro J. 1984. Once more on the comparison of growth in fish and invertebrates. Fishbyte 2(1):4–21.
- Prince J, Hordyk A. 2018. What to do when you have almost nothing: A simple quantitative prescription for managing extremely data‐poor fisheries. Fish Fish. 20:224–238. doi:10.1111/faf.12335.
- Quarcoopome T, Amevenku F, Ansa-Asare O. 2008. Fisheries and limnology of two reservoirs in Northern Ghana. West Afr J Appl Ecol. 12:61–80.
- Schwamborn R, Mildenberger TK, Taylor M. 2019. Assessing sources of uncertainty in length-based estimates of body growth in populations of fishes and macroinvertebrates with bootstrapped ELEFAN. Ecol Model. 393:37–51. doi:10.1016/j.ecolmodel.2018.12.001.
- Somers I. 1988. On a seasonally oscillating growth function. Fishbyte. 6:8–11.
- Sparre P, Venema SC. 1998. Introduction to tropical fish stock assessment. Part 1. Manual. FAO Fish Tech Paper. 306:1–407.
- Taylor CC. 1958. Cod growth and temperature. ICES Journal of Marine Science 23:366–370.
- Taylor M, Mildenberger TK. 2017. Extending electronic length frequency analysis in R. Fish Manage Ecol. 24:330–338. doi:10.1111/fme.12232.
- Then AY, Hoenig JM, Hall NG, Hewitt DA. 2015. Evaluating the predictive performance of empirical estimators of natural mortality rate using information on over 200 fish species. ICES J Mar Sci. 72:82–92. doi:10.1093/icesjms/fsu136.
- Thompson WF, Bell FH. 1934. Biological statistics of the pacific halibut fishery 2. Effect of changes in intensity upon total yield and yield per unit of gear. Rep Int Fish Commun. 8:1–49.
- Uneke BI, Nwani CD. 2014. Stock assessment of Tilapia zilli (Gervais, 1848) (Osteichthyes: Cichlidae) in a Nigerian tropical river basin. Zool Ecol. 24:339–346. doi:10.1080/21658005.2014.959283.
- Villanueva MC, Ouedraogo M, Moreau J. 2006. Trophic relationships in the recently impounded Bagré Reservoir in Burkina Faso. Ecol Model. 191:243–259. doi:10.1016/j.ecolmodel.2005.04.031.
- Zhou S, Yin S, Thorson JT, Smith ADM, Fuller M. 2012. Linking fishing mortality reference points to life history traits: an empirical study. Can J Fish Aquat Sci. 69:1292–1301. doi:10.1139/f2012-060
Appendices
Appendix 1. Parameter estimates (mode of marginal distribution, Mod) of the seasonally oscillating von Bertalanffy growth function based on moving averages (MA) of 3 and 7 of the target fish species from reservoirs assessed with the bootstrapped electronic length frequency analysis with genetic algorithm function of TropFishR. Estimates based on the pooled length-frequency data of Tono, Bontanga, and Golinga reservoirs collected from July 2016 to June 2017. Lower and Upper denote 95% confidence interval of the estimates.
Appendix 2a. Estimated mortality values (Z, M, and F), exploitation rate (E), and biological reference points of fishing mortality (Fmax, F0.1, F0.5) for the target species of Tono, Bontanga, and Golinga reservoirs based on the pooled growth parameters with moving average setting of 3. Mod, mode of the marginal distribution; Low (lower) and Upp (upper) denote 95% confidence interval of the estimates. The M estimate of a species is a common value for all reservoirs.
Appendix 2b. Estimated mortality values (Z, M, and F), exploitation rate (E), and biological reference points of fishing mortality (Fmax, F0.1, F0.5) for the target species of Tono, Bontanga, and Golinga reservoirs based on the pooled growth parameters with moving average setting of 7. Mod, mode of the marginal distribution; Low (lower) and Upp (upper) denote 95% confidence interval of the estimates. The M estimate of a species is a common value for all reservoirs.