
Abstract
Eldridge SLC, Wood TM. 2019. Annual variation in microcystin occurrence in Upper Klamath Lake, Oregon, based on high-throughput DNA sequencing, qPCR, and environmental parameters. Lake Reserv Manage. 36:31–44.
Cyanobacteria-dominated blooms in Upper Klamath Lake, Oregon, create poor water quality and produce microcystins that may be detrimental to local wildlife and human health. Genetic tools, including high-throughput DNA sequencing and quantitative polymerase chain reaction (qPCR), have been shown to improve the identification and quantification of key groups associated with these blooms over more traditional techniques. We examined the seasonal and interannual variations in nutrient (nitrogen and phosphorus) concentrations between 2013 and 2014 to describe the relations between these factors and the growth dynamics of Aphanizomenon and toxigenic Microcystis as described by DNA sequencing and qPCR. Although total nutrients and chlorophyll a concentrations were similar between years, qPCR results showed the cyanobacterial populations to be 40 times larger in 2014 and indicated a large shift from an Aphanizomenon-dominant, low microcystin-level regime in 2013 to one dominated later in the season by microcystin-producing Microcystis in 2014. In both years, the transition from Aphanizomenon to Microcystis was coincident with a late-season increase in nitrite-plus-nitrate concentrations and in dissolved inorganic nitrogen to dissolved inorganic phosphorus (DIN:DIP) ratios. However, these increases did not explain the large interannual differences in total cyanobacteria abundance. Rather, we hypothesized that year-to-year differences in bioavailable phosphorus, which also manifested as lower total nitrogen to total phosphorus (TN:TP) ratios, were responsible.
The global proliferation and frequent occurrence of cyanobacterial blooms in eutrophic freshwater present challenges to lake management because they impair water quality and produce harmful cyanotoxins. Major drivers for the increased intensification of toxic blooms include nutrient overenrichment and climate change scenarios that favor toxin-producing cyanobacterial populations (Wells et al. Citation2015). The most frequent toxins are the hepatotoxic microcystins, which are produced primarily by Microcystis spp., Planktothrix spp., Dolichospermum spp., and other cyanobacteria (Rastogi et al. Citation2014).
The proliferation of toxin-producing blooms in eutrophic and hypereutrophic freshwater is dependent on a complex interplay of biological and environmental factors. Studies focused on cyanotoxin occurrence and the abundance of Microcystis in natural assemblages aim further to describe how the interactions of environmental variables affect changes in the composition of microcystin-producing and nonproducing populations of Microcystis. Such studies also try to understand how the proportion of toxigenic genotypes varies with the microcystin concentrations observed (Singh et al. Citation2015). Many studies have focused on the role of macronutrients, particularly nitrogen (Gobler et al. Citation2016) and phosphorus (Ghaffar et al. Citation2017), in the proliferation of toxin-producing Microcystis blooms. Changes in the dominance of specific cyanobacterial taxa significantly affect the timing of toxin production; it is, therefore, important to understand what drives the transition between species and strains most relevant to toxin production.
In Upper Klamath Lake, Oregon, dense cyanobacteria blooms occur annually from late spring to early summer and, in most years, are followed by periods of elevated, but highly variable, microcystin concentrations. Previous microscopy-based studies showed that Aphanizomenon flos-aquae composes more than 90% of the phytoplankton biovolume and that Microcystis represents less than 1% of the total biovolume in most years (Kann and Smith Citation1999). However, Microcystis is the only genus to be directly linked to microcystin production in the lake (Saker et al. Citation2007), and a recent study showed that late-season Microcystis growth may be enhanced by early-season nitrogen fixation from Aphanizomenon, which, in turn, is regulated by changes in bioavailable nitrogen and phosphorus (Eldridge et al. Citation2012b). In a later study, genetic tools were used to improve the resolution of microscopy-based methods for identifying and quantifying key groups affecting water quality in Upper Klamath Lake from June to September of 2013 and 2014 (Eldridge et al. Citation2012b).
As an extension of that previous work, the current study examines further the nutrient controls on microcystin occurrence and changes in the relative abundances of and succession between Aphanizomenon and Microcystis. The results presented here, along with previous work in Upper Klamath Lake, allow the development and refinement of a testable hypothesis. That hypothesis comprises four propositions: (1) Environmental or ecological controls on Aphanizomenon and Microcystis occurrences in Upper Klamath Lake are independent of the interannual size and diversity differences in the cyanobacteria community, in general, and of the absolute abundances of Aphanizomenon and Microcystis, in particular, (2) proliferation of Microcystis in Upper Klamath Lake is dependent on early-season bloom and senescence of Aphanizomenon to increase nitrogen in the system, (3) the within-season timing of the transition from Aphanizomenon to Microcystis is supported by increasing, late-season DIN:DIP ratios as a result of increasing nitrate concentrations, and (4) large interannual differences in Aphanizomenon and Microcystis abundances are attributable to interannual differences in bioavailable phosphorus concentrations.
Materials and methods
Study site
Upper Klamath Lake is located at the base of the Cascade Mountains (eastern slope) in south-central Oregon. It is a naturally occurring, large and shallow lake with a surface area of 305 km2 and an average depth of 2.6 m. More than 90% of the lake was less than 4 m deep, but in a trench running along the western shoreline, the depth was about 15 m following spring runoff. The Upper Klamath Lake system has been eutrophic since at least the mid 1800s, but major changes in land use and hydrology of the drainage basin and lake over the past century have intensified eutrophication (Bradbury et al. Citation2004). The lake has been the primary water source since 1921 for the Klamath Project to supply water to agricultural areas within the Upper Klamath Basin (Stene Citation1994).
Sample collection
Water-column samples were collected at a single site, MDT (42°23'05.1''N, 121°55'38.2''W), located within the deepest part of Upper Klamath Lake along the western shoreline following the protocols outlined for water quality data collection in Eldridge et al. (Citation2012b). Samples were collected by integrating the top 10 m of the water column (total depth was approximately 14 m at the start of the season) because this study was part of an ongoing long-term water-quality monitoring program by the US Geological Survey (USGS) to relate water-quality conditions to endangered, benthic-feeding fish species (Lindenberg et al. Citation2009). Integrating samples could have had a diluting effect on cell and microcystin concentrations, but it was important to leverage existing resources for this study and to understand conditions relevant to endangered fish residing primarily near the bottom of the lake. Sampling for nutrients, chlorophyll a, and microcystins was performed weekly from 11 June to 10 September in 2013 and from 11 June to 22 September in 2014. In 2013, DNA samples were collected weekly from 9 July to 10 September. Sampling for DNA analysis was also conducted weekly in 2014, but the sample dates varied () to accommodate the sampling schedule of the monitoring program. Samples for all analyses, DNA, nutrients, and chlorophyll a, were collected from the same composite water sample in each sampling event. Subsamples (500 mL) split from these composite water-column samples were also collected and preserved with glutaraldehyde to produce a final concentration of 0.25–0.50%. Microscopy samples were collected approximately every week between 23 July and 10 September 2013 and analyzed for identification and enumeration to species level as described in Eldridge et al. (Citation2012b).
Table 1. Sample collection schedule and analyses performed 2013 and 2014.
DNA extraction, sequencing, and qPCR
DNA extraction and amplification, sequencing, and analysis of the V3/V4 region of the 16S rRNA gene to target total Bacteria were performed as described in Eldridge et al. (Citation2012b). Quantitative polymerase chain reaction (qPCR) targeting the Microcystis-specific mcyE gene, the 16S rRNA gene regions specific to total cyanobacteria and Microcystis spp., and the cpcA and cpcB gene sequences specific to Aphanizomenon and Microcystis, respectively, was performed using the primers, probes, and conditions described in Rinta-Kanto et al. (Citation2005), Sipari et al. (Citation2010), and Eldridge et al. (Citation2012b). The cpc genes code for phycocyanin production, which are photosynthetic accessory pigments unique to cyanobacteria that serve as major light-harvesting pigments for photosynthesis. Using cpc gene targets in qPCR allows for greater resolution in distinguishing among cyanobacteria. Ten genes (mcyA-J) are involved in microcystin production in Microcystis, Anabaena, and Planktothrix (Tillett et al. Citation2000). The mcyE gene is responsible for the activation and condensation of D-glutamate with Adda moiety, so it is a good target for microcystin-producing cyanobacteria. Gene copy numbers obtained by all qPCR assays were expressed as cell equivalents (Rinta-Kanto et al. Citation2005) by dividing the qPCR-determined copies per milliliter by the number of corresponding gene copies per genome, based on the assumptions that Microcystis has 2 copies of the 16S rRNA gene and single copies of mcyE and cpcB (Kaneko et al. Citation2007), Aphanizomenon has 4 copies of the 16S rRNA gene per genome and a single copy of cpcA (Dreher TW and Driscoll C, Oregon State University, Feb 2016, pers. comm.), Synechococcus has 4 copies of the 16S rRNA gene (Sugita et al. Citation2007), and Dolichospermum has 4 copies of the 16S rRNA gene (Kaneko et al. Citation2001). Gene copy numbers were expressed as cell equivalents similarly for total cyanobacteria, but these values were calculated from the relative abundances of the most abundant cyanobacteria identified in the DNA-sequencing dataset on each sample date, Microcystis, Synechococcus, Aphanizomenon, and Dolichospermum. These values ranged from 2.57 to 3.60 copies of the 16S rRNA gene per genome in 2013 and from 2.00 to 3.71 copies per genome in 2014. All DNA samples were obtained from 500 mL filtered lake water.
Collection and analyses of physicochemical parameters and nutrients
Microcystins in aggregate water-column particulates (intracellular; >63 μm) and dissolved in lake water (extracellular) were determined separately in accordance with the ongoing water-quality monitoring program using the congener-independent enzyme-linked immunosorbent assay (ELISA; kit 520011, Abraxis, LLC, Warminster, PA) following the manufacturer’s protocol and as described in Eldridge et al. (Citation2012b). Processing of depth-integrated water-column samples to determine concentrations of chlorophyll a, total nutrient (total nitrogen, TN, and total phosphorus, TP), dissolved inorganic nitrogen (DIN, as the sum of ammonia and nitrite-plus-nitrate concentrations), and dissolved inorganic phosphorus (DIP, as orthophosphate) is described in Eldridge et al. (Citation2012a). Two water quality monitors (YSI, Inc., Yellow Springs, OH) recorded water temperature, dissolved oxygen concentration, and pH values hourly according to Eldridge et al. (Citation2012a). All water quality data collected for this study can be found at the US Geological Survey National Water Information System available online (USGS Water Data for the Nation) at http://waterdata.usgs.gov/nwis. Monitors were positioned vertically at 3.5 m and 10.5 m, and the values recorded by each nearest to the time of sample collection were averaged for analysis. Vertical profile data were also collected, but it was determined that the hourly data recorded by monitors deployed for the on-going long-term water-quality monitoring program were more representative of conditions relevant to endangered fish species. To link changes in nutrient ratios with changes in the mechanisms of nutrient retention, loss, or immobilization, such as N2 fixation or sedimentation, relative concentration differences were compared in addition to the absolute concentrations.
Tests for difference between years
Paired-sample t-tests, Wilcoxon or similar, were performed for each analyte in R version 3.2.0 (R Development Core Team, 2009) and using the censored data routines in R to handle detection limits. The degree of deviation from the t-test assumptions was also assessed after normalizing data by log transformation, and results indicated that data met these assumptions. Tests were performed 2 ways to reflect the early- and late-season bloom and environmental characteristics previously observed: June and July combined (denoted as early season and characterized primarily by a dense Aphanizomenon bloom and low microcystin levels) and August and September combined (denoted as late season and characterized primarily by high microcystin levels).
Results
Interannual and seasonal variations in total cyanobacteria, total Microcystis, and Aphanizomenon abundances
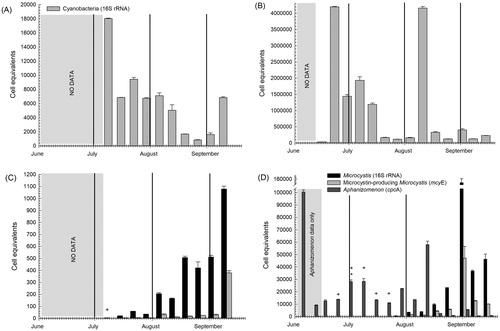
All genetic data collected in this study are presented in Eldridge et al. (Citation2017a). Overall, cyanobacterial and Microcystis 16S rRNA gene copy numbers or cell equivalents were highly variable between 2013 and 2014 (). The difference in total cyanobacteria abundance was supported by DNA sequencing results (Eldridge et al. Citation2012b) showing cyanobacteria and Microcystis to be less abundant in 2013 than in 2014. Results of paired-sample t-tests showed that the median total cyanobacteria 16S rRNA copy number was significantly lower in 2013 than in 2014 across both sample seasons. However, concentrations of total Microcystis and toxigenic Microcystis (mcyE+ cells) were significantly different (lower in 2013) in August and September only ().
Table 2a. Median, ranges, and interannual comparisons (based on Wilcoxon or similar tests) of microcystin concentrations and qPCR-estimated abundances (as cell equivalents/mL) and ratios of total cyanobacteria, total Microcystis, and mcyE+ Microcystis measured in Upper Klamath Lake in 2013 and 2014. Aphanizomenon cpcA and Microcystis cpcB were quantified in 2014 only. Significant differences (p > 0.05) are in boldface. The “greater than” years without significant p values indicate that values were higher, but the difference between years was not statistically significant.
qPCR-estimated abundances showed an increase in Microcystis in 2014 at about the same time as in 2013, but by mid August, Microcystis abundances were greater in 2014 by more than 1 or 2 orders of magnitude (). Ratios between qPCR-estimated Microcystis cpcB cell equivalents to Aphanizomenon cpcA cell equivalents in 2014 showed that Aphanizomenon was more abundant (ratios less than 1.0) prior to 18 August (Eldridge et al. Citation2012b). After that date, Microcystis abundance increased rapidly and Aphanizomenon diminished until Microcystis exceeded Aphanizomenon by more than 54 times in early September. Aphanizomenon was not quantified by qPCR in 2013 because funds to develop the method were not available until 2014, but Figure 6 in Eldridge et al. (Citation2012b) showed more overlap between Aphanizomenon and Microcystis populations over the entire season in the 2013 DNA sequencing data set, which indicated that this late-summer Microcystis bloom in a near absence of Aphanizomenon was unique to 2014.
Figure 1. Changes in copy number (as cell equivalents per mL of water sample) of (A) cyanobacteria 16S rRNA in 2013; (B) cyanobacteria 16S rRNA in 2014; (C) Microcystis 16S rRNA and Microcystis-specific mcyE in 2013; and (D) Microcystis 16S rRNA, Microcystis-specific mcyE, and Aphanizomenon cpcA in 2014. Error bars represent standard deviation. The first day of each month is shown by a vertical line. Asterisk indicates no detection of Microcystis (16S rRNA); + indicates no detection of mcyE.
Interannual and seasonal variations in microcystin concentrations and relative abundance ratios of microcystin-producing Microcystis
As with total cyanobacteria and total Microcystis, the potentially microcystin-producing subpopulation of Microcystis (mcyE+ cells) was more abundant in 2014 than in 2013 (). qPCR results in both years showed peak abundances of mcyE+ cells in early or mid September (), so a greater number of the Microcystis cells had the mcyE gene as the population increased. However, except for the last sample collected in 2013, the greater abundances of total Microcystis measured from late August to early September 2013 () occurred while ratios of mcyE+ Microcystis to total Microcystis were lower (Eldridge et al. Citation2012b). From late August to mid September 2014, when total Microcystis densities were highest (), the percentages of Microcystis cells containing the mcyE gene were above 20% in all samples but were lower than the peaks of more than 40% observed earlier that season. Therefore, it appeared that a greater percentage of cells within the Microcystis population possessed the microcystin-encoding gene cluster at higher cell densities, overall, but only after reaching some threshold abundance in the collected samples.
Interannual and seasonal variations in nutrient concentrations and physiochemical parameters
None of the physiochemical data were significantly different between 2013 and 2014 (), and variations within these data were within the range of values measured previously (Eldridge et al. Citation2012a, Citation2014, Lindenberg et al. Citation2009). Among the nutrient concentrations measured, only nitrite-plus-nitrate (NOx) concentrations were significantly different between years; early-season values were greater in 2014 and late-season values were greater in 2013.
Table 2b. Median, ranges, and interannual comparisons (based on Wilcoxon or similar tests) of environmental parameters measured in Upper Klamath Lake in 2013 and 2014. Significant differences (p > 0.05) are in boldface.
Overall, the seasonal variations in dissolved oxygen concentrations, pH, and water temperature were similar between years (), were within the range of values that have been measured in years prior, and showed previously described patterns that fit with the cycle of bloom growth and decline typical of Upper Klamath Lake and as described in Walker et al. (Citation2012) and in Eldridge et al. (Citation2012a) and references therein. In 2013, one extended growth period was observed based on changes in TN:TP and increasing chlorophyll a concentrations throughout July, and in 2014, 2 distinct growth periods occurred in June and August, which were separated by a well-defined period of decline. Total nutrient concentrations, especially total nitrogen (TN), mirrored the chlorophyll a time series (), indicating that total nutrients were dominated by the particulate organic form. Peaks in TN also aligned with qPCR-estimated total cyanobacteria or Microcystis peaks in both years (). On the sample dates prior to these peaks in 2013, changes in TN concentration divided by changes in total phosphorus (TP) concentration were greater than the Redfield reference mass ratio of 7.2 (molar ratio of 16) and were consistent with nitrogen fixation (). In 2014, the changes in TN divided by the changes in TP suggested less nitrogen fixation. Ammonia concentrations comprised a larger portion of DIN early in both years (). As each season progressed, concentrations of NOx increased and comprised more of the total DIN. The decrease in NOx between late August and early September 2014 coincided with the maximum in total Microcystis concentration that year and a TN increase of 790 µg/L (). Although not significantly different between years, early-season DIP concentrations were 34 to 48% higher in 2014, despite TP concentrations reaching a higher maximum in 2013 ().
Figure 2. Variations in (A) chlorophyll a concentration, (B) pH, (C) water temperature, and (D) dissolved oxygen concentration in 2013 and 2014. The first day of each month is shown by a vertical line. Water temperature, dissolved oxygen, and pH are average values from the sensors positioned at 3.5 m and 10.5 m in the water column.
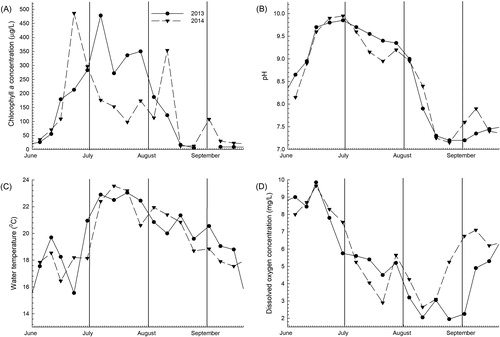
Figure 3. Variations in (A) TN concentration, (B) TP concentration, (C) ammonia concentration, (D) nitrite-plus-nitrate concentration, (E) DIN concentration, and (F) DIP concentration in 2013 and 2014. The first day of each month is shown by a vertical line.
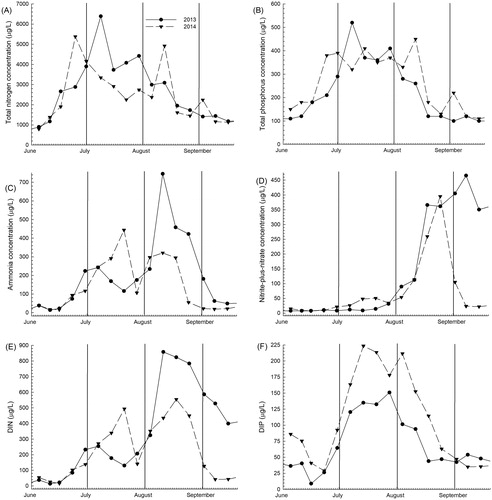
Table 3. Change in total and dissolved nutrient concentrations for time periods leading up to and leading away from maxima TN concentrations in 2013 and 2014.
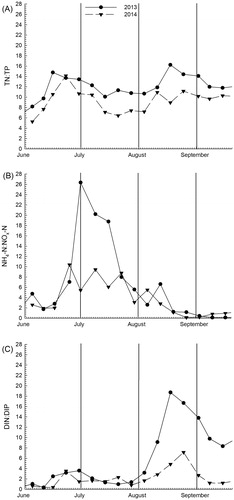
TN:TP ratios were higher throughout 2013 than throughout 2014 (; ). NH4:NOx ratios were also higher early in 2013; in both years; however, this ratio decreased and was similarly low in September of both years (). Late-season DIN:DIP ratios were significantly less in 2014 than in 2013; 2014 values were below 7.2, but DIN:DIP ratios exceeded 18 in 2013 (). DIN:DIP ratios remained <3.5 early in both years; then DIN:DIP increased in August, when DIP decreased more quickly than DIN.
Figure 4. Variations in (A) TN:TP ratio, (B) NH4-N:NOx-N ratio, and (D) DIN:DIP ratio in 2013 and 2014. The first day of each month is shown by a vertical line.
Discussion
DNA-based monitoring of the cyanobacteria community in this study revealed a dynamic shift not previously reported for Upper Klamath Lake from Aphanizomenon dominance throughout most of the 2013 season to Microcystis dominance by late summer 2014, despite similar overall physiochemical and biomass surrogate characteristics between years. This increase in qPCR-estimated Microcystis cell density was accompanied by a microcystin concentration that was the highest measured value to that date (53.7 µg/L) in water samples from Upper Klamath Lake. Several factors have been shown to influence microcystin production and the specific growth rates of associated species at the community level (Neilan et al. Citation2013). However, it is clear that eutrophication by nitrogen and phosphorus contributes to toxic bloom development (Gobler et al. Citation2016, Ghaffar et al. Citation2017). Concentrations and ratios of bioavailable nitrogen and phosphorus, therefore, are the primary focus of this discussion.
Nutrient controls on microcystin occurrence
qPCR-estimated abundances of total Microcystis and toxigenic Microcystis (mcyE+) increased in both 2013 and 2014, and, in 2014, abundances correlated significantly (Eldridge et al. Citation2017b) with a late-season increase in microcystin concentrations. This increase in microcystins did not track the variability in the proportion of mcyE+ cells, suggesting that microcystin occurrence was associated more with cell growth than with an increase in the relative proportion of mcyE+ Microcystis. This relationship was consistent within each year and between investigated years. This agreed with the finding of Orr and Jones (Citation1998) that the processes of cell division and microcystin production are tightly coupled and that microcystin production is controlled by environmental factors through their effects on population growth rather than on the metabolic pathways of toxin production. Long et al. (Citation2001) found a positive relation between the specific growth rate of Microcystis and the cell quota (per-cell measure) of microcystins; more rapidly growing cells had a higher cell quota than more slowly growing cells, indicating that a rapidly expanding bloom would be particularly toxic. In contrast, Neilan et al. (Citation2013) described a more complex relation between toxin regulation and environmental parameters, such as light intensity and iron availability, that may influence the proportions of different genotypes that differ in their relative fitness.
Increasing eutrophication by nitrogen and phosphorus stimulates cyanobacteria bloom development, but the evidence for increased eutrophication discriminating between toxic and nontoxic genotypes is equivocal. Laboratory studies have shown a strong positive correlation between nitrogen concentration (or N:P ratio) and microcystin quota in Microcystis (Long et al. Citation2001, Orr and Jones Citation1998), regardless of growth rate (Downing et al. Citation2005). Monchamp et al. (Citation2014) concluded that the availability of nitrogen was a controlling factor for Microcystis growth, which was, in turn, the best predictor of total microcystin concentration. In a laboratory study, Sevilla et al. (Citation2010) found that an excess of nitrate promoted Microcystis cell growth but not mcy transcription or toxin production, and therefore the effect of nitrate on the development of toxin-producing blooms was in the effect on growth rate and population size. Cyanobacteria biomass was not significantly enhanced on urea relative to inorganic N forms (Erratt et al. Citation2018), but Chaffin et al. (Citation2018) showed that Microcystis and Planktothrix can use many forms of N and that high light intensities enhance microcystin production during elevated N concentrations. These findings are relevant to this study because the increase in Microcystis growth and microcystin concentrations in 2014 occurred late in the season when bioavailable nutrients were ample. Nutrients are generally not limiting when microcystin levels are high in Upper Klamath Lake, however, and elevated microcystin and total Microcystis concentrations do not result from macronutrient limitations on growth.
Nutrient controls on the seasonal succession between Aphanizomenon and Microcystis
Time series of Aphanizomenon and Microcystis relative abundances showed minimal overlap between May and September in both study years and indicated a negative correspondence in their occurrences. This agrees with Eldridge et al. (Citation2012b), in which we hypothesized growth of non-nitrogen-fixing Microcystis in Upper Klamath Lake was facilitated by nitrogen addition (released during bloom senescence) through biological N2 fixation (primarily by Aphanizomenon) early in the season, when cyanobacterial biomass was highest and microcystin concentrations were lowest. This successional pattern has been previously observed in conjunction with increases in DIN, nitrate, and DIN:DIP or TN:TP ratios and has been shown to benefit Microcystis populations ecologically (Beversdorf et al. Citation2013, Miller et al. Citation2013). McDonald and Lehman (Citation2013) evaluated the nutrient limitation status of Aphanizomenon versus Microcystis through growth responses and heterocyst production and found that Microcystis succeeded Aphanizomenon as nitrate increased in late summer. Wu et al. (Citation2015) hypothesized that increased TN and/or TN:TP ratios were responsible for changes in the spring to summer succession of Aphanizomenon to Microcystis, leading to the decline and near-disappearance of Aphanizomenon blooms at the same time that Microcystis blooms became larger. DIN:DIP ratios measured in the current study were low (<4) early in both years, so it is reasonable to speculate that reduced DIN:DIP ratios contributed to the early Aphanizomenon blooms and that Microcystis growth increased along with increasing DIN:DIP ratios as the summers progressed. Because increasing DIN:DIP was due to increasing nitrite-plus-nitrate concentrations, the challenge remains of distinguishing between the effects of nutrient ratios and nitrate concentrations on the succession of these key cyanobacteria.
Temperature is also a factor often cited as the most influential factor governing the succession between Aphanizomenon and Microcystis. Paerl and Otten (Citation2016) analyzed a long-term water quality and phycological dataset from reservoirs along the Klamath River, California, which demonstrated oscillating dominance between Aphanizomenon and Microcystis, and observed that warmer water temperatures favored growth of Microcystis. In Upper Klamath Lake, Microcystis blooms have occurred more often below 20 C and as temperatures decline (Eldridge et al. Citation2012b, Citation2013), which does not agree with Microcystis favoring higher temperatures seasonally. Furthermore, Peng et al. (Citation2018) found that Microcystis growth rates at lower temperatures were slower but resulted in increased cellular microcystin content, We therefore cannot attribute the observed shift from Aphanizomenon to Microcystis in Upper Klamath Lake to seasonal changes in temperature. However, it is possible that the effects of temperature in Upper Klamath Lake on the successional patterns we observed were confounded by differences among regional ecotypes.
Nutrient controls on year-to-year differences in the cyanobacterial community
Understanding the role of nutrient ratios in promoting late-season Microcystis growth in Upper Klamath Lake is important because low TN:TP mass ratios favor growth of N2-fixing over non-N2-fixing cyanobacteria. We define “low” here as less than the Redfield ratio of 7.2 by weight; Smith (Citation1983) concluded that TN:TP ratios less than 29 favor a community dominated by N2-fixing and non-N2-fixing cyanobacteria. At TN:TP ratios of 7.2 or less, N2-fixing cyanobacteria, such as Aphanizomenon, may have a competitive advantage. Teubner et al. (Citation1999) observed dense Microcystis blooms in two lakes in Germany, Großer Müggelsee and Langer See, when the TN:TP ratio was less than 7.2, but notably, these blooms followed in rapid succession after an Aphanizomenon bloom that was triggered by a shift in TN:TP ratios higher than to less than the Redfield ratio. TN:TP ratios in Upper Klamath Lake were significantly lower in 2014, when Microcystis was more abundant, than in 2013, and, prior to the second Aphanizomenon bloom in 2014, the TN:TP ratio was >7.2. In addition, DIN:DIP ratios were not significantly different early in 2013 and 2014, but were significantly lower later in 2014, when Microcystis was more abundant, than in 2013. Therefore, N:P ratios appear not to be directly associated with the observed difference in the size of the Microcystis populations between 2013 and 2014.
Increased biomass of Microcystis may be attributed to the availability of different nitrogen forms. A low NO3-N environment with sufficient NH4-N can favor growth of non-N2-fixing cyanobacteria, like Microcystis (Jacoby et al. Citation2000), but Lehman et al. (Citation2009) found positive correlations between Microcystis biovolume, NO3− levels, and microcystin concentration, suggesting that, under sufficient NOx-N, Microcystis may have a competitive advantage over Aphanizomenon. Liu et al. (Citation2011) associated Microcystis dominance in Lake Taihu with a NH4:NOx ratio less than 1. However, in the current study, DIN concentrations at the start of the Microcystis increase in 2014 comprised similar NO3− -N concentrations and lower NH4+-N concentrations relative to the corresponding dates in 2013. Therefore, we cannot attribute the exceptionally dense Microcystis bloom in 2014 to either lower or higher NO3− -N concentrations.
Along with qPCR-estimated Microcystis cell density, concentrations of bioavailable phosphorus in Upper Klamath Lake were higher in 2014 than in 2013. Aphanizomenon-specific cpcA was not quantified in 2014, so we cannot directly compare qPCR results between Aphanizomenon and Microcystis. However, high-throughput DNA sequencing reported in Eldridge et al. (Citation2017b) showed Aphanizomenon to comprise up to 80% of the cyanobacteria community, so the Aphanizomenon bloom was also larger in 2014. The DIP concentration on 5 June 2014, was higher than on the closest corresponding date in 2013, and by 23 July 2014, the difference in DIP concentrations between years increased. While TN concentrations steadily declined from the seasonal maximum on 23 June over the next 4 weeks, TP was relatively steady and bioavailable phosphorus increased, forcing the TN:TP ratio down. Bioavailable nitrogen increased at the same time, but the increase in DIP relative to DIN was greater than would be expected if the increase was a result of cell senescence alone, implicating a combination of cell senescence, benthic nitrogen or phosphorus fluxes, and denitrification. Excess available phosphorus can promote growth of N2-fixers, and this was observed as a second peak in Aphanizomenon on 11 August. During the prior weeks, the nitrogen balance was dominated by N2 fixation, and TN concentrations increased from 2.37 to 4.92 mg/L. On 18 August, the Aphanizomenon concentration was lower by a factor of 22 from the week before. Microcystis growth began to increase during this time and continued to a peak 2 weeks later (2 Sep).
Overall, results of this study provided further insight into the environmental conditions affecting microcystin occurrence in Upper Klamath Lake and highlighted the need for understanding the environmental influence on the succession of bloom-forming and toxin-producing species. Phytoplankton abundance and succession in aquatic ecosystems result from a complex interplay of factors. Several of these factors were not included in this study, including salinity, alkalinity, precipitation, light, iron, and the presence of predators and parasites. However, the results presented here allowed the development and refinement of a testable hypothesis concerning the environmental or ecological controls on Aphanizomenon and Microcystis occurrence in Upper Klamath Lake that may be further explored with continued monitoring and research.
Acknowledgments
We thank the reviewers who provided comments on this article. R. Blake, D.Blake Eldridge, C. Goebel, A.A. Lee, C. Melosh, K. Sauter, and B.P. Smith performed the fieldwork. This work was funded by the US Geological Survey Office of Water Quality and by the US Geological Survey National Water-Quality Assessment Program (NAWQA).
References
- Beversdorf LJ, Miller TR, McMahon KD. 2013. The role of nitrogen fixation in cyanobacterial bloom toxicity in a temperate, eutrophic lake. PloS One. 8(2):e56103. doi: 10.1371/journal.pone.0056103.
- Bradbury JP, Colman SM, Reynolds RL. 2004. The history of recent limnological changes and human impact on Upper Klamath Lake, Oregon. J Paleolimnol. 31(2):151–165. doi: 10.1023/B:JOPL.0000019233.12287.18.
- Chaffin JD, Davis TW, Smith DJ, Baer MM, Dick GJ. 2018. Interactions between nitrogen form, loading rate, and light intensity on Microcystis and Planktothrix growth and microcystin production. Harmful Algae. 73:84–97. doi: 10.1016/j.hal.2018.02.001.
- Downing TG, Meyer C, Gehringer MM, van de Venter M. 2005. Microcystin content of Microcystis aeruginosa is modulated by nitrogen uptake rate relative to specific growth rate or carbon fixation rate. Environ Toxicol. 20(3):257–262. doi: 10.1002/tox.20106.
- Eldridge SLC, Wood TM, Echols KR, Topping BR. 2013. Microcystins, nutrient dynamics, and other environmental factors during blooms of non-microcystin-producing Aphanizomenon flos-aquae in Upper Klamath Lake, Oregon, 2009. Lake and Reserv Manage. 29(1):68–81. doi: 10.1080/10402381.2013.775199.
- Eldridge DB, Caldwell Eldridge SL, Schenk SL, Tanner LN, Wood TM. 2012a. Water-quality data from Upper Klamath and Agency Lakes, Oregon, 2009–10. 32 pp.
- Eldridge SLC, Driscoll C, Dreher TW. 2017a. Using high-throughput DNA sequencing, genetic fingerprinting, and quantitative PCR as tools for monitoring bloom-forming and toxigenic cyanobacteria in Upper Klamath Lake, Oregon, 2013 and 2014. Reston, VA.
- Eldridge SLC, Driscoll C, Dreher TW. 2017b. Datasets for high-throughput DNA sequencing, genetic fingerprinting, and quantitative PCR, Upper Klamath Lake, Oregon, 2013–14.
- Eldridge SLC, Wherry SA, Wood TM. 2014. Statistical analysis of the water-quality monitoring program, Upper Klamath Lake, Oregon, and optimization of the program for 2013 and beyond. pp. 1–82. U.S. Geological Survey Open-File Report.
- Eldridge SLC, Wood TM, Echols KR. 2012b. Spatial and temporal dynamics of cyanotoxins and their relation to other water quality variables in Upper Klamath Lake, Oregon, 2007–09. 34 pp.
- Erratt KJ, Creed IF, Trick CG. 2018. Comparative effects of ammonium, nitrate and urea on growth and photosynthetic efficiency of three bloom-forming cyanobacteria. Freshw Biol. 63(7):626–638. doi: 10.1111/fwb.13099.
- Ghaffar S, Stevenson RJ, Khan Z. 2017. Effect of phosphorus stress on Microcystis aeruginosa growth and phosphorus uptake. PloS One. 12(3):e0174349. doi: 10.1371/journal.pone.0174349.
- Gobler CJ, Burkholder JM, Davis TW, Harke MJ, Johengen T, Stow CA, Van de Waal DB. 2016. The dual role of nitrogen supply in controlling the growth and toxicity of cyanobacterial blooms. Harmful Algae. 54:87–97. doi: 10.1016/j.hal.2016.01.010.
- Jacoby JM, Collier DC, Welch EB, Hardy FJ, Crayton M. 2000. Environmental factors associated with a toxic bloom of Microcystis aeruginosa. Can J Fish Aquat Sci. 57(1):231–240. doi: 10.1139/f99-234.
- Kaneko T, Nakajima N, Okamoto S, Suzuki I, Tanabe Y, Tamaoki M, Nakamura Y, Kasai F, Watanabe A, Kawashima K, et al. 2007. Complete genomic structure of the bloom-forming toxic cyanobacterium Microcystis aeruginosa NIES-843. DNA Res. 14(6):247–256. doi: 10.1093/dnares/dsm026.
- Kaneko T, Nakamura Y, Wolk CP, Kuritz T, Sasamoto S, Watanabe A, Iriguchi M, Ishikawa A, Kawashima K, Kimura T, et al. 2001. Complete genomic sequence of the filamentous nitrogen-fixing cyanobacterium Anabaena sp. strain PCC 7120. DNA Res. 8(5):205–213; 227-53.
- Kann J, Smith VH. 1999. Chlorophyll as a predictor of elevated pH in a hypereutrophic lake—estimating the probability of exceeding critical values for fish success using parametric and nonparametric models. Can J Fish Aquat Sci. 56:2262–2270. doi: 10.1139/f99-158.
- Lehman EM, McDonald KE, Lehman JT. 2009. Whole lake selective withdrawal experiment to control harmful cyanobacteria in an urban impoundment. Water Res. 43(5):1187–1198. doi: 10.1016/j.watres.2008.12.007.
- Lindenberg MK, Hoilman GR, Wood TM. 2009. Water quality conditions in Upper Klamath and Agency Lakes, Oregon, 2006. 54 pp.
- Liu X, Lu X, Chen Y. 2011. The effects of temperature and nutrient ratios on Microcystis blooms in Lake Taihu, China: an 11-year investigation. Harmful Algae. 10(3):337–343. doi: 10.1016/j.hal.2010.12.002.
- Long BM, Jones GJ, Orr PT. 2001. Cellular microcystin content in N-limited Microcystis aeruginosa can be predicted from growth rate. Appl Environ Microbiol. 67(1):278–283. doi: 10.1128/AEM.67.1.278-283.2001.
- McDonald KE, Lehman JT. 2013. Dynamics of Aphanizomenon and Microcystis (cyanobacteria) during experimental manipulation of an urban impoundment. Lake Res Manage. 29(2):103–115. doi: 10.1080/10402381.2013.800172.
- Miller TR, Beversdorf L, Chaston SD, McMahon KD. 2013. Spatiotemporal molecular analysis of cyanobacteria blooms reveals Microcystis–Aphanizomenon interactions. PloS One. 8(9):e74933. doi: 10.1371/journal.pone.0074933.
- Monchamp M-E, Pick FR, Beisner BE, Maranger R. 2014. Nitrogen forms influence microcystin concentration and composition via changes in cyanobacterial community structure. PloS One. 9(1):e85573. doi: 10.1371/journal.pone.0085573.
- Neilan BA, Pearson LA, Muenchhoff J, Moffitt MC, Dittmann E. 2013. Environmental conditions that influence toxin biosynthesis in cyanobacteria. Environ Microbiol. 15(5):1239–1253. doi: 10.1111/j.1462-2920.2012.02729.x.
- Orr PT, Jones GJ. 1998. Relationship between microcystin production and cell division rates in nitrogen-limited Microcystis aeruginosa cultures. Limnol Oceanogr. 43(7):1604–1614. doi: 10.4319/lo.1998.43.7.1604.
- Paerl HW, Otten TG. 2016. Duelling 'CyanoHABs': unravelling the environmental drivers controlling dominance and succession among diazotrophic and non-N2-fixing harmful cyanobacteria. Environ Microbiol. 18(2):316–324. doi: 10.1111/1462-2920.13035.
- Peng G, Martin RM, Dearth SP, Sun X, Boyer GL, Campagna SR, Lin S, Wilhelm SW. 2018. Seasonally relevant cool temperatures interact with N chemistry to increase microcystins produced in lab cultures of Microcystis aeruginosa NIES-843. Environ Sci Technol. 52(7):4127–4136. doi: 10.1021/acs.est.7b06532.
- Rastogi RP, Sinha RP, Incharoensakdi A. 2014. The cyanotoxin-microcystins: current overview. Rev Environ Sci Biotechnol. 13(2):215–249. doi: 10.1007/s11157-014-9334-6.
- Rinta-Kanto JM, Ouellette AJA, Boyer GL, Twiss MR, Bridgeman TB, Wilhelm SW. 2005. Quantification of toxic Microcystis spp. during the 2003 and 2004 blooms in western Lake Erie using quantitative real-time PCR. Environ Sci Technol. 39(11):4198–4205. doi: 10.1021/es048249u.
- Saker ML, Welker M, Vasconcelos VM. 2007. Multiplex PCR for the detection of toxigenic cyanobacteria in dietary supplements produced for human consumption. Appl Microbiol Biotechnol. 73(5):1136–1142. doi: 10.1007/s00253-006-0565-5.
- Sevilla E, Martin-Luna B, Vela L, Bes MT, Peleato ML, Fillat MF. 2010. Microcystin-LR synthesis as response to nitrogen: transcriptional analysis of the mcyD gene in Microcystis aeruginosa PCC7806. Ecotoxicology. 19(7):1167–1173. doi: 10.1007/s10646-010-0500-5.
- Singh S, Rai PK, Chau R, Ravi AK, Neilan BA, Asthana RK. 2015. Temporal variations in microcystin-producing cells and microcystin concentrations in two fresh water ponds. Water Res. 69:131–142. doi: 10.1016/j.watres.2014.11.015.
- Sipari H, Rantala-Ylinen A, Jokela J, Oksanen I, Sivonen K. 2010. Development of a chip assay and quantitative PCR for detecting microcystin synthetase E gene expression. Appl Environ Microbiol. 76(12):3797–3805. doi: 10.1128/AEM.00452-10.
- Smith VH. 1983. Low nitrogen to phosphorus ratios favor dominance by blue-green algae in lake phytoplankton. Science. 221(4611):669–671. doi: 10.1126/science.221.4611.669.
- Stene EA. 1994. Klamath project. 42 pp.
- Sugita C, Ogata K, Shikata M, Jikuya H, Takano J, Furumichi M, Kanehisa M, Omata T, Sugiura M, Sugita M. 2007. Complete nucleotide sequence of the freshwater unicellular cyanobacterium Synechococcus elongatus PCC 6301 chromosome: gene content and organization. Photosynth Res. 93(1–3):55–67. doi: 10.1007/s11120-006-9122-4.
- Teubner K, Feyerabend R, Henning M, Nicklisch A, Woitkeand P, Kohl J-G. 1999. Alternative blooming of Aphanizomenon flos-aquae or Planktothrix agardhii inducedby the timing of the critical nitrogen: phosphorus ratio in hypertrophic riverine lakes. Arch Hydrobiol Spec Issues Advanc Limnol. 54:325–344.
- Tillett D, Dittmann E, Erhard M, von Dohren H, Borner T, Neilan BA. 2000. Structural organization of microcystin biosynthesis in Microcystis aeruginosa PCC7806: an integrated peptide-polyketide synthetase system. Chem Biol. 7(10):753–764.
- Walker WW, Walker JD, Kann J. 2012. Evaluation of water and nutrient balances for the Upper Klamath Lake basin in water years 1992–2010. pp. 50, Klamath Tribes Natural Resources Department, Aquatic Ecosystem Sciences LLC.
- Wells ML, Trainer VL, Smayda TJ, Karlson BSO, Trick CG, Kudela RM, Ishikawa A, Bernard S, Wulff A, Anderson DM, et al. 2015. Harmful algal blooms and climate change: learning from the past and present to forecast the future. Harmful Algae. 49:68–93. doi: 10.1016/j.hal.2015.07.009.
- Wu Y, Li L, Zheng L, Dai G, Ma H, Shan K, Wu H, Zhou Q, Song L. 2015. Patterns of succession between bloom-forming cyanobacteria Aphanizomenon flos-aquae and Microcystis and related environmental factors in large, shallow Dianchi Lake, China. Hydrobiologia. 765(1):1–13. doi: 10.1007/s10750-015-2392-0.
