
Abstract
Horne AJ, Beutel M. 2019. Hypolimnetic oxygenation 3: an engineered switch from eutrophic to a meso-/oligotrophic state in a California reservoir. Lake Reserv Manage. 35:338–353.
A long-term improvement in water quality due to a hypolimnetic oxygenation system (HOS) used without other management actions was shown for Camanche Reservoir in California (volume = 514 million m3). Prior to oxygenation, the reservoir was eutrophic with low water clarity, high chlorophyll a (Chl-a), and blooms of cyanobacteria primarily caused by internal nutrient loading from anoxic sediments. All 4 trophic state indicators showed major improvement, most pointing to a new oligotrophic state. Days after HOS startup in July 1993, hypolimnion soluble phosphate and ammonium concentrations declined and, unexpectedly, nitrate remained low. This report covers pre-HOS (1988 to mid-1993) and 12 yr of post-HOS measurements (mid-1993 to mid-2005). For surface waters during the growth season (Apr–Oct) after HOS, average Chl-a decreased 79% (14.6–3.1 μg/L) and peak Chl-a decreased sixfold (from 49 to 8 μg/L). Average Secchi depth increased 10-fold (0.47 to 4.9 m) and peak Secchi depth doubled (4.2–8 m). Cyanobacteria (Aphanizomenon and Dolichospermum, formerly Anabaena) decreased >95% while the previously absent Merismopedia, an indicator of clean water, appeared. The large colonial diatom Fragilaria also decreased by >90%. Zooplankton (rotifers and crustaceans) appeared unchanged. After HOS, late winter surface nutrients prior to the next spring bloom were much reduced (total phosphorus, TP, by 58%, total inorganic nitrogen, TIN, by 88%). The TIN:TP ratio dropped from 6 to 1.6. In 2004, the last full year of measurements, further declines were found for nitrate nitrogen (42–3 μg/L) and Chl-a (3.1–2.8 μg/L) while TP was unchanged (14 μg/L).
Low levels of dissolved oxygen (DO) have been used in the trophic classification of lakes for almost a century. Thienemann (Citation1922) and later Linderman (Citation1942) considered hypolimnetic anoxia important in the definition of trophic state. Anoxia remains a main component of cultural eutrophication today (Lampert and Sommer Citation1997, Kalff Citation2002, Cooke et al. Citation2005, Chislock et al. Citation2013). Anoxia in the sediments promotes internal nutrient loading and is indirectly due to increases in external nutrient inputs. In theory, anoxia and internal nutrient loading might be overcome eventually by decreasing external nutrient loading and thus decreasing algal biological oxygen demand in the sediments. This indirect approach will take “years to decades” (IJC Citation2019), is “mostly inadequate” (Osgood Citation2017), and may be impossible due to legacy nutrients accumulated in the sediments, at least in shallow lakes (Scheffer Citation1998). A more direct alternative described here is to add oxygen to counteract oxygen depletion and thus decrease internal nutrient loading from the sediments (Gemza Citation1997, Beutel and Horne Citation1999). Oxygen additions would be continued until the external sources were sufficiently reduced to make oxygenation redundant.
The prime purpose of a hypolimnetic oxygenation system (HOS) in Camanche Reservoir was the prevention of downstream fish kills by suppressing H2S generation in the sediments (Horne Citation2019a). Nonetheless, an improvement in the trophic state was anticipated since the sediments were the prime target of this HOS. This article presents short- and long-term effects of HOS on chlorophyll a (Chl-a), water clarity, nutrients, phytoplankton, and zooplankton, over 17 yr (1988–2005) from before oxygenation to the establishment of a new equilibrium.
Reservoir description
Camanche Reservoir was created in 1964 on the Mokelumne River 10 km below the deeper Pardee Reservoir. It is a multiuse reservoir with water supply, recreation, and flood control functions, owned and operated by the East Bay Municipal Water Utility District (EBMUD) in Oakland, CA. A description of the physical limnology of Camanche Reservoir is given in an accompanying article (Horne Citation2019a). Using the trophic classification of Cooke and Welch (Citation2008) where eutrophic is classified as >9 μg/L Chl-a, >29 μg/L TP, and <2 m Secchi disk depth, Camanche Reservoir was firmly eutrophic (Chl-a, Secchi) or borderline mesotrophic–eutrophic (TP) by 1987. The 1990–1992 average growth season Chl-a level was 14.6 μg/L (22.1 μg/L in Jul–Sep) with peaks of 45–49 μg/L in the summer-fall blooms. Mean Secchi depth was 0.47 m, and TP averaged 29 μg/L (). Using a similar nitrogen indicator of eutrophication (TIN >200 μg/L), the reservoir (TIN = 198 μg/L) was on the eutrophic–mesotrophic border in 1987.
Table 1. Chemical and biological limnology of eutrophic Camanche Reservoir and trophic state indicators in 1990–1992 prior to HOS
Hypolimnetic oxygenation system (HOS)
The hypolimnetic oxygenation system (HOS) is the key to this series of articles, and full details of the form of HOS used in Camanche Reservoir, the Speece cone, are described by Horne (Citation2019a) and Horne et al. (Citation2019). The first reservoir Speece cone was installed in Newman Lake, Washington, in 1991, 2 yr before the one in Camanche Reservoir. The goal at Newman Lake was to reduce eutrophication (Moore and Christensen Citation2009), while the primary purpose in Camanche Reservoir was suppression of sediment anoxia. This was needed after 1987–1989 when 300,000 young steelhead trout and chinook salmon died in a hatchery located just downstream of the dam. The hatchery receives bottom hypolimnion water. Poor water quality, especially hydrogen sulfide (H2S) in the reservoir outflow, was a likely cause of fish deaths (Horne Citation2019a).
A Speece cone is a downflow submerged contact oxygenation device and consists of a metal cone of various sizes. For Camanche Reservoir the cone was 7 m high and 3.7 m wide at the base (. Ancillary structures were a water pump and inlet and outlet structures (. The cone was set on the bottom in the deepest part of the reservoir about 180 m from dam (. A 0.9 m3/s Flygt submersible electric water pump pulls cool, low-oxygen water from near the bed and raises it to the top of the cone, from which it passes down the cone to the outlet. Pure gaseous oxygen evaporated from a shoreline liquid oxygen tank is piped to the cone. The oxygen bubbles try to rise and the 2 counterflowing streams of water (down) and oxygen gas (up) mix. The flow rates and cone angle are designed to keep bubbles within the cone until they are all dissolved (Little and McGinnis Citation2001, Ashley et al. Citation2008). The now highly oxygenated but bubble-free water flows out of the bottom of the cone and is dispersed back into bottom water to approximately saturation levels via ports in a diffuser pipe (.
Figure 1. The Camanche Reservoir Speece cone. (a) Diagram of the cone, side view (from Brown and Caldwell, Citation1995). (b) Cone assembly by the dam (Pan Marine Construction). Cone is the large, 7 m high, white structure on right; large inlet and pump pipes to top of cone are dark. Outlet manifold (not shown) attaches to bottom left of cone. (c) Final location of the submerged Speece cone is marked by a buoy (inside triangle) 180 m from dam for which the rock face is at bottom. A 3.5 m long fishing boat (circle) just outside line of small marker buoys shows scale. Photo shows the first 5 km of the reservoir, which holds most of the reservoir volume.
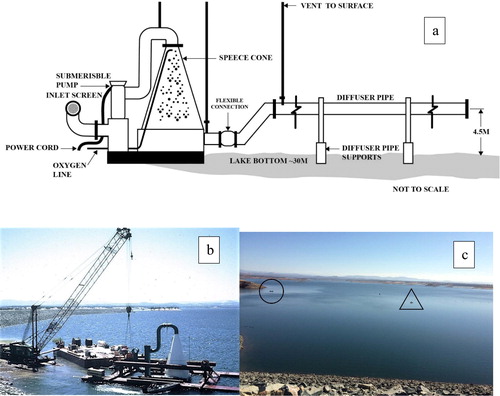
The Speece cone differs from most other oxygenation or aeration devices in that the oxygenated water plume “hugs” the reservoir bed, rather than being dispersed throughout the hypolimnion or entire water column. The temperature increase inside the cone is very small so the diffuser’s plume remains as cool and dense as the bottom water from which it was drawn. The diffuser’s jets of well-oxygenated water entrain surrounding low-oxygen water and expand vertically to 9 m and horizontally to the width of the reservoir at that depth (Horne Citation2019a). Importantly for discussions of eutrophication, there is no rising bubble plume to transport bottom water to the surface. In Camanche Reservoir the upper half of the 20 m thick hypolimnion was little affected by the oxygenated plume (Horne et al. Citation2019). Oxygen needs (8 tons/d) were based on measured hypolimnion DO decline and an estimated sediment oxygen demand.
The reasons for eutrophication in Camanche Reservoir were not clear. The water supply, the Upper Mokelumne River, comes from a little-developed catchment rising to 2616 m (8584 ft) in the Sierra Nevada Mountains. Possible undetected and episodic nutrient sources were excess logging upstream (EBMUD Citation1996) and wildfires. The few small settlements in the drainage had wastewater diverted away from the reservoir by 1968 but may have had a prior cumulative effect on the sediments. The huge Central Valley agricultural industry lies to the west, and fertilizer-rich dust particles (Baker et al. Citation2005) and volatile ammonia are easily transported on windy days (Plautz Citation2018), as are nutrients elsewhere (Zhang et al. Citation2019). The reservoir’s drainage basin area is moderately large compared with its surface water area (48:1), and ratios >40:1 are often associated with eutrophic status (Horne and Goldman Citation1994).
Methods
Most limnological measurements reported here were made between 1990 and 2005, except for Secchi depth and plankton counts, which were begun in 1988. After 6 yr of oxygenation some changes in frequency and locations of sampling were made and sampling was discontinued in summer 2005. The HOS has continued to the present. The most consistent dataset from the index station in the deepest water close to the dam is emphasized here, since this is the usual location for sampling in reservoirs. Provisional analysis of the rest of the reservoir sites (not shown here) supports the conclusions made from the index station. Results are reported only for the surface and the deepest “bottom” water sample taken about 0.5 m from the reservoir bed using Van Dorn samplers. There was very little difference in the upper water (0–10 m) depth profiles for nutrients, so surface sample values represent the entire epilimnion. There was a vertical structure to the nutrients in the hypolimnion, with the bottom water showing higher concentrations of nutrients. Changes in collection after 1999 eliminated the hypolimnion sampling at most depths. From 2000 the fixed probe near the Speece cone was used. This probe is located near the reservoir bed, so the “bottom” value is used hereafter, unless specified otherwise. The bottom water is the most likely to show sediment nutrient releases and is within the 9 m thick HOS plume when operating (Horne et al. Citation2019). Most importantly, the main outflow from Camanche Reservoir is close to the bottom since there is no multiple outlet tower.
Water samples were analyzed for nutrients: soluble nitrate plus nitrite, ammonium, phosphate, and total phosphorus, all reported as N or P. Also measured were Chl-a, phytoplankton, zooplankton, and water clarity as Secchi depth. Total inorganic nitrogen (TIN: NO3 + NH4), represents total readily biologically available N and is more useful than total nitrogen (TN) in these warmer waters where more refractory organic N concentrations, and thus TN, greatly outweigh nitrate and ammonium concentrations. Soluble phosphate is the only chemical form of P that is released from sediments under anoxic conditions and the only form available directly to algae. However, phosphate can be released from many chemical compounds, measured as TP by alkaline phosphatase, an enzyme produced by algae. Data analysis used Microsoft Excel.
Zooplankton were counted from the same water-bottle samples as phytoplankton, which was the standard practice at the water agency, rather than the more usual epilimnion vertical or slanting hauls using nets of various sizes. Only the surface water samples are discussed here. The bottle method reduces the precision for less common large crustacean zooplankton but may provide reliable data for smaller forms like rotifers that may pass through the normal 135 to 200 µm mesh nets. However, the large number of individuals collected and counted (6873 rotifers and 2863 crustaceans in more than 200 sampling events) somewhat compensates for the smaller water volume sampled. EBMUD’s state-certified laboratory analyzed Chl-a using a conventional methanol extraction (APHA Citation1985, 10200H) and nutrients using EPA methods (nitrate 300, ammonium 350.1, TP 365.2, ortho-phosphate 365.2). Phytoplankton were counted from surface grab (discrete) samples (APHA Citation1985, 10200 and 10900C).
The potential for N2 fixation was measured as the ratio of heterocytes to vegetative cells (h/c) using a microscope at 200 or 400 power with fresh living samples collected within 24 hours. Heterocytes are the site of N2 fixation most in planktonic cyanobacteria (Horne and Goldman Citation1972). Counts were made only for the most common cyanobacterium Aphanizomenon. The method used was to find a heterocyte and then count the vegetative cells along the filament chain until the next heterocyte, continuing as long as possible along the often-winding filaments. At least 10 heterocytes were counted for each of the triplicate samples. It would have been desirable to have the h/c ratios from before HOS, but due to lack of staff these counts were made only after HOS installation. Metals, turbidity, dissolved oxygen, temperature, pH, conductivity, and other variables were also measured and are reported in other papers in this series (Horne Citation2019a, Horne Citation2019b, Horne and Faisst Citation2019, Horne and Jung Citation2019, Horne et al. Citation2019).
Results
Chlorophyll, water clarity, and trophic status
Phytoplankton, measured as Chl-a in surface waters, declined substantially following HOS operation, and that decline is directly attributable to the large reduction in internal nutrient loading. In the pre-HOS period (1990–1992), annual average growth season for Chl-a (Apr–Oct) was 14.6 μg/L and dropped 73% after 5 yr of HOS operation (Aug 1993–1999, , ). Further improvement occurred with continued HOS operation. For the 11 yr following HOS (1993–2004), Chl-a declined to an average of 3.1 μg/L. For 2004 alone, the last year with a full data set, Chl-a dropped to 2.8 μg/L, a decline of almost 80% compared with pre-HOS values. Peak Chl-a values fell 65% from 49 µg/L (1990–1992) to 17 μg/L (1994–97) and 84% to 8 μg/L by 2004. For the recreational season of July through September, Chl-a fell from an annual average of 22.1 μg/L before HOS to 3.7 μg/L soon after HOS began and was only 2.7 μg/L in 2004, a decline of 88% ().
Figure 2. (a) Chlorophyll a and (b) water transparency in Camanche Reservoir during the growth season before and after HOS, which began July 1993. Secchi depth correlation coefficient is based on a third-order polynomial but the R2 for linear regression was similar.
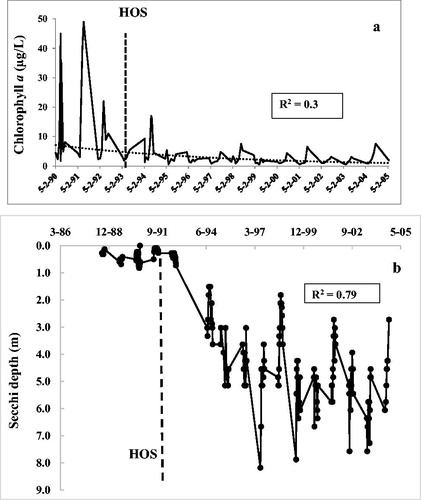
Table 2. Summary of declines in chlorophyll a after HOS for the entire growth season and the key recreational months of July–September.
Table 3. Declines in soluble phosphate (as µg P/L) in the bottom hypolimnion water (2 m above sediment near the dam) before and immediately following HOS in late July 1993
As expected from the large Chl-a decline, water clarity also improved ( and , . Mean growth season (Apr–Oct) Secchi depth increased from 0.47 m before HOS to 4.1 m (1993–1997) and to 4.9 for the entire post-HOS period (1994–2004). For the final full year of measurement, 2004, Secchi disk transparency had risen to an average of 5.6 m (). A linear regression of Secchi depth over time shows a coefficient of R2 = 0.75 (n = 239, . Just over half of the improvement in water clarity can be explained by the drop in Chl-a, since the power regression between the two was R2 = 0.59. Minimum Secchi depth increased from 0.09 (1990–1992) to 1.5 m (1993–1997) and 1.8 m by 2004. Maximum Secchi depth increased from 4.2 m before HOS to 8.2 m over the next 5 yr (1994–1998). In June 2004, a single peak Secchi depth value of 10 m was achieved (.
Table 4. Summary of long-term changes in major nutrients (μg/L) in the deep hypolimnion and surface waters of Camanche Reservoir before and after HOS
Nutrients
Concentrations of various nutrients important in eutrophication before and after HOS were compared among periods before and after HOS ( and ). The HOS began in late July 1993 and the immediate pre- and post-HOS values reported here () show that year split into 2 parts. More detailed comparisons () were made comparing 1990–1992 (preoxygenation; anoxic hypolimnion), with those for the first 5 yr after HOS (1994–1998), as the new ecological equilibrium became established, and then 11 yr later in 2004 as HOS was run at lower oxygen delivery rates. Longer term changes for hypolimnion and surface water-soluble phosphate, TP, ammonium N, and surface water nitrate N (, respectively) are evident. The initial oxygen supply was 8 tons/d, but because algae had decreased the EBMUD operators gradually reduced the supply, monitoring the bottom DO to keep it above 2 mg/L. By 2004, they had been able to reduce the oxygen feed to 2 tons/d.
Figure 3. Phosphorus species in Camanche Reservoir before and after HOS, which began July 1993. (a) Bottom water-soluble phosphate. (b) Surface TP. Aberrant peaks after HOS were due to minimal, late-season only use of HOS (1995) and an electrical problem (1997) when brief anoxia occurred.
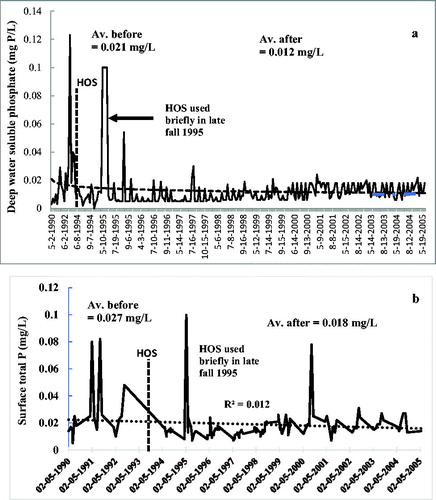
Figure 4. Ammonium in Camanche Reservoir before and after HOS, which began July 1993: (a) bottom water and (b) surface water.
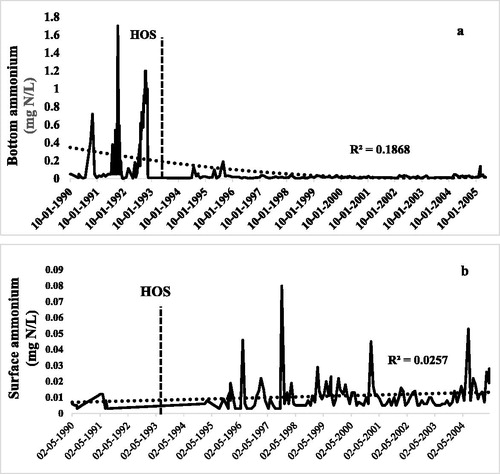
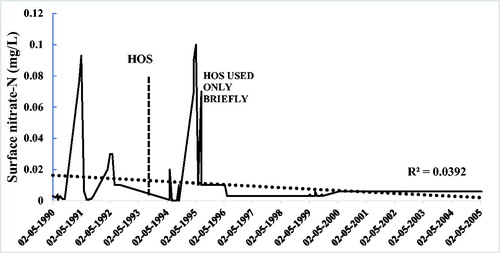
Figure 5. Nitrate in surface water for Camanche Reservoir before and after HOS, which began July 1993.
Soluble phosphate is the P form most directly changed by oxygen (Brett et al. Citation2016) and is released by anoxic sediments to the bottom waters. Prior to HOS, anoxia in the hypolimnion normally began in August so values from mid-August through October were compared. Oxygenation began July 1993 when DO had fallen to 4 mg/L (Horne Citation2019a, Horne et al. Citation2019). Hypolimnion phosphate concentrations in August through October during the first year of HOS were half those in the previous year over the same period (32 versus 66 μg P/L, ). For the longer term results, October was chosen because it was usually the time of maximum hypolimnion nutrient concentrations in this reservoir where turnover normally occurred in early November. The pre-HOS phosphate level in water near the bottom in October 1990–1992 was 95 μg P/L. In the first 5 yr with HOS (1994–1998), phosphate dropped 84% (95 to15 μg P/L). After 11 yr of HOS, hypolimnion bottom water phosphate concentrations changed little. The average for 2004 was 18 μg P/L (, . As with many large new systems, there was some on-and-off operation of the HOS in first year of operation in summer 1993. This may have affected the nutrient fluxes, so the 1993 data were excluded in the following analysis. The difference between the 1990–1992 and 1994–2004 growing seasons averages for phosphate was statistically significant (p < 0.01, t-test, two-sample assuming equal variances, n = 239).
For TP, the annual range in the hypolimnion prior to HOS was large (up to 540 μg/L), but the seasonal pattern was like that of phosphate. Comparing values in October 1992, the year before HOS startup, with the October average for the 4 yr after HOS, there was an 85–90% drop in TP (201 μg/L to 25 μg/L, ). Concentrations of TP remained at this level for 11 yr, and the final full year of measurements in 2004 had a mean value of 28 μg/L. Comparing longer term averages for the entire growth season, the differences between the 1990–1992 and 1994–2004 hypolimnion TP means was statistically significant (p < 0.01, t-test, two-sample assuming equal variances, n = 239).
Surface water TP is commonly used as an indirect indicator of lake trophic status and followed the pattern of TP and phosphate in the hypolimnion. Concentrations during the algae growth season prior to HOS averaged 29 µg/L (), placing the reservoir on the eutrophic–mesotrophic border. After HOS, surface TP declined to 15 µg/L (1996–1999) before stabilizing at about two-thirds of the preoxygenation levels (18 µg/L, 2002–2005, . An insightful illustration of the efficacy of HOS occurred when normal operation was not maintained. Brief spikes in surface TP and lesser perturbations in hypolimnion phosphate occurred in 1995 when HOS was used for only 1 week in late October and in 2001 due to electrical failure lasting about a week (. Both forms of P returned to low levels once HOS operation resumed.
Ammonium in the hypolimnion was virtually eliminated by HOS (. During the anoxic period (Aug–Nov 1992) just prior to HOS, bottom water ammonium values were very high, reaching 1700 μg/L in late autumn (), and averaged 706 μg/L in October 1990–1992. In 1993, the first year of HOS operation, ammonium in the bottom water of the hypolimnion fell considerably and never exceeded 50 μg N/L even in late autumn (. The longer term view supports the initial findings with continuing low concentrations in the bottom water. For October only during the next 4 yr of HOS operation, bottom water ammonium averaged 28 μg N/L (), then decreased to 14 μg/L in 2004—the last full year of nutrient measurements. The difference between the mean values for 1990–1992 and 1994–2004 for bottom water ammonium in the growing seasons was statistically significant (p < 0.01, t-test, two-sample assuming equal variances, n = 142). As with bottom water phosphate, ammonium increased to ∼200 μg P/L in 1995 due to the minimal use (1 week in late October) of HOS in that year (.
Ammonium in the surface waters, and thus directly available for growth, is usually low in open waters since it is readily taken up by phytoplankton for growth and bacteria can gain energy by its oxidation to nitrate. Prior to HOS, surface water ammonium was very low at 7 µg/L (1990–1992, ), presumably due to high demand from the dense algae blooms. After HOS, surface ammonium increased slightly to 11 µg/L (1994–2005), and after 11 yr reached 17 µg/L (2004–2005). These are still very low concentrations for freshwaters, but it is interesting that the surface concentrations did not decline while benthic ammonium concentrations decreased substantially. It is unlikely that there was direct vertical transport of bottom water ammonium upward through the hypolimnion since this HOS system has no bubble plume, unlike an aeration-mixing system (see earlier HOS mechanism summary). One possibility is that the decrease in cyanobacteria due to HOS was responsible for the small increase in surface ammonium. Cyanobacteria in productive freshwaters preferentially take up ammonium, while other algae are better adapted for nitrate uptake (Cunha et al. Citation2017).
No increase in Chl-a occurred for this small increase in surface ammonium, but this might be due to growth limitation by moderately low TP (14 µg/L, ). This seems less likely in Camanche Reservoir since the available surface water TIN fell by more than 50% (55 to 23 µg/L, ) between 1993–1997 and 2004. In contrast, surface TP remained constant at 14 µg/L between these 2 periods. Since the downward trend in TIN followed a 30% decline in Chl-a (), it is likely that inorganic N, not phosphorus of any kind, was the algal growth-limiting factor in this reservoir. The small increase in surface ammonium was more than offset by a larger decline in nitrate.
Oxidation of the hypolimnion using HOS was expected to reduce ammonium in the bottom waters (700 µg N/L) by converting it to a similar concentration of nitrate. Prior to HOS, hypolimnion nitrate was low (40 µg N/L), so a sharp increase in nitrate in the hypolimnion water was anticipated following HOS startup. It was a surprise that even after ammonium had decreased substantially, the nitrate increase was minimal (). Using October as the most stressful period in terms of oxygen demand, nitrate in bottom hypolimnion water increased from 40 μg N/L prior to HOS to only 65 μg N/L in the 4 yr following HOS and fell to 50 μg N/L 11 yr later in 2004. These changes were not due to improvements in methodology over the 14 yr of sampling. Even though laboratory methods did improve (MDL in 1990 = 10 µg/L, in 2004 = 6 µg/L) these are small numbers compared with the changes observed in nitrate.
The HOS in Camanche Reservoir was designed to place a layer of high-DO water directly over the sediments and thus more efficiently oxidize the surface sediment layers. Overall, oxygenating the sediments reduced and/or oxidized forms of inorganic N by about 92% (1992 peak ∼1800 μg N/L, almost all ammonium N; 1993 peak = 93 μg N/L, more nitrate than ammonium). Thus, the 1993 peak nitrate value is not representative of the final decline to be expected with HOS used regularly over years. Importantly for reservoir management, inorganic N reductions apparently need more time than soluble phosphate reductions when using HOS.
Prior to HOS, surface nitrate N followed the typical pattern of nonagricultural regions with relatively low winter maxima (up to 1000 µg/L) and summer minima (∼10 µg/L) after summer algae blooms (). Following HOS, surface nitrate remained very low for almost all the next 11 yr. Averages were 17 µg N/L (1990–1992), 9 µg N/L (1994–2004), and 6 µg N/L (2004 alone). Not using HOS in 1995 except for a brief time at the end of the thermally stratified period increased surface nitrate N to pre-HOS winter levels at turnover (). Thus, both surface nitrate N and phosphorus responded rapidly to anoxia when HOS was not used.
Reduction in bioavailable N and P in the bottom waters of the hypolimnion should affect nutrient levels in the surface waters following winter overturn. If so then there should be an effect on algae growing the following spring. Concentrations of TIN and TP in late winter (Feb–Mar) when the reservoir was still in its winter mixing period give a robust measure of potential trophic state. For example, the log–log plot of spring concentrations of TP versus summer Chl-a is one of the most frequently used regressions in applied limnology (Dillon and Rigler Citation1974). Mean TIN in surface waters in the pre-HOS late winters of 1990–1992 was 198 μg/L, compared with 55 μg/L in following years (). For TP the late winter values were 33 μg/L before HOS compared with 14 μg/L after HOS.
The N:P ratio indicates a balanced nutrient ratio for algal growth at ∼10:1 by weight, P-limitation if >10 and N-limitation at <10. For this analysis TIN:TP was used since it best represents biologically available nutrients rather than TN:TP. Because TIN is used, the ratio of TIN:TP will bias the ratio toward N-limitation, but use of TN:TP even more strongly biases toward a very high P-limitation since organic N is so high and nitrate so low in the warm waters of Camanche Reservoir relative to lakes in cooler climates. For example, in a survey of 729 lakes in Michigan (Fuller and Taricska Citation2011), the average surface water ratio of TN:TP was 44 (nitrate N = 260 µg/L, TN = 790 µg/L, TP = 18 µg/L), which shows strong P limitation, but so does the TIN:TP ratio of 17.7 (ammonium N = 60 µg/L). In Camanche Reservoir surface water TIN is always low (mean = 25 µg/L) and organic N always high (∼1500 µg/L) and TP moderate (29 µg/L) so shows very different ratios with TN:TP (51.7) compared to TIN:TP (0.86, ). The main sources of nitrate in most surface waters are agricultural runoff, atmospheric deposition, and sometimes wastewater inflows and urban runoff. The main losses of nitrate are sediment deposition and denitrification. The latter is strongly temperature-limited and may explain part of the differences in cold climates for nitrate accumulation, which is ubiquitous, even in the very large, oligotrophic Lake Superior (Sterner Citation2011).
The TIN:TP ratio in Camanche Reservoir indicated moderate N-limitation in the epilimnion in late winter, prior to the spring algae bloom (TIN:TP = 6) prior to HOS (). Increasing N-limitation occurred over the next 11 yr with ratios of 3.7 (1995–97) and 2.9 (2004 alone). Considering only the most critical month of October, the ratio in the bottom hypolimnion water eventually fell to 2.9 ().
Changes in phytoplankton and zooplankton
Cyanobacteria have long been a concern in eutrophic conditions. Because some produce toxins such as the liver-damaging microcystin or the neurotoxin anatoxin, these algae are undesirable at high concentrations. The HOS in Camanche Reservoir rapidly reduced the biomass of Aphanizomenon, the most common potentially toxin-producing genus present. In California and almost everywhere else this alga is most common in the warmer months when thermal stratification is strong (Horne Citation1979, Kanoshina et al. Citation2003). Before HOS, Aphanizomenon was found in Camanche Reservoir from June to October.
Prior to HOS, Aphanizomenon counts for individual samples often exceeded 300 million cells/L, but a month later the same site would only record a few hundred cells per liter. Counts of buoyant colonial cyanobacteria are often erratic from week to week or month to month, reflecting natural fluctuations and spatial heterogeneity (Sandusky and Horne Citation1978, Horne and Commins Citation1987, McDonald and Lehman Citation2013). Algae sampling began before nutrient measurements and, measured as the average cell count per collection in the growth season (Apr–Oct), Aphanizomenon prior to HOS (1988–1992) averaged 3.7 million cells/L but fell more than 95% to 363 cells/L after HOS (Aug 1993–May 1994, ). This alga continued at low concentrations until sampling was discontinued in mid-2005, although occasional smaller blooms occurred (). Unlike the pre-HOS populations, Aphanizomenon was found in low numbers (<1500 cells/L) in the cool November–March period. Dolichospermum, the other common toxin-producing cyanobacterial genus, showed a similar decline (), though not quite as dramatic as that for Aphanizomenon. Prior to HOS, Dolichospermum was found at more than 148,000 cells/L but declined to between 50 and 7999 cells/L over the period 1994 to 2005 (). Changes in other algal genera were observed but are more complex to interpret and are beyond the scope of this article. Aphanizomenon and Dolichospermum were much more common than other cyanobacteria in Camanche Reservoir prior to HOS, but this changed after HOS. One clear example was the appearance of the small colonial cyanobacterial genus Merismopedia, which was absent prior to HOS but showed a brief bloom (2100 cells/L) in June–July 2004. The species is sometimes considered an indicator of clean water (Palmer et al. Citation1977).
Table 5. Changes in dominant phytoplankton and zooplankton including colonial cyanobacteria before and after HOS which began in late July 1993.
The ratio of heterocytes to vegetative cells (h/c) can be used to determine the N stress placed on some cyanobacteria (Horne and Fogg Citation1970) because heterocytes are the site of effective N2 fixation (Horne and Galat Citation1985). No heterocyte counts were made prior to HOS, but between 2000 and 2004 the h/c ratio was estimated on the 8 occasions when Aphanizomenon was present. There was a remarkably constant h/c ratio, averaging 1:18. When there is ample TIN (>150 µg/L), Aphanizomenon has few heterocytes and an h/c ratio of ∼1:400 (Horne Citation1979). However, when TIN concentrations fall to lower levels the h/c ratio can rise to as high as 1:10, indicating high N2 fixation. The high h/c ratio in Camanche Reservoir after HOS indicates that N stress was severe. It is also possible that iron may be limiting now in Camanche Reservoir as it is in other California lakes and reservoirs (Elder and Horne Citation1977, Wurtsbaugh and Horne Citation1983).
The large decrease in Chl-a suggested a reduction in biomass for all types of phytoplankton, despite their different buoyancy strategies. The large colonial pennate diatom Fragilaria, which is common in mildly eutrophic waters (Lund Citation1949), was also common in Camanche Reservoir prior to HOS (). Fragilaria showed declines similar to those found for Aphanizomenon. Like most planktonic diatoms, which are heavy due to their silica cell walls, Fragilaria blooms during well-mixed periods like spring and early winter. Fragilaria’s main bloom in Camanche Reservoir was in April–June, with lesser blooms in October–December. This seasonal cycle contrasted with the opposite strategy of the buoyant cyanobacteria, which bloom in the strongly stratified warm conditions of summer and early fall. After HOS, Fragilaria numbers declined by 66% from an average of 400,000 cells/L (Aug 1988–May 1989) to 138,000 cells/L (Aug 1993–May 1994, ). The reduction continued (179,000 cells/L, Aug 1998–May 1999), with further declines after 11 yr to 26,000 cells/L or about 7% of the pre-HOS Fragilaria population.
Rotifers are the most important soft-bodied invertebrates in the freshwater plankton (Hutchinson Citation1967), although they are not often included in reservoir management studies. In Camanche Reservoir the most abundant rotifer was Keratella, a common genus that grazes on small ciliates and phytoplankton in the 4–17 μm size range (Walz Citation1995; Weissel and Frahm Citation2001). Annual mean concentrations for rotifers varied from 3.1 to 100/L, similar to the range for some other, similar eutrophic freshwaters (Nauwerk Citation1963). Rotifers appeared to have increased following HOS. Prior to HOS, annual means averaged 29.3/L (1988–1992), while after HOS (1994–2005), means averaged 50.4/L. However, the increase was not statistically significant (p = 0.2 for all data, n = 168, two-tailed test, equal variances) and was confined to the early years after HOS (1995–1999, ). Rotifer counts varied a great deal each year, so finding significant changes would require a large difference. The few years of increase are shown also in the comparisons of the pre-HOS years (29/L, 1988–1992) and the second post-HOS year, for which there is a full dataset (1995, 100/L, , ). After 11 yr of HOS, the annual average for rotifers was 30/L, similar to pre-HOS findings. Some rotifers cannot thrive when using Dolichospermum as a primary food source (Qiuqi et al. Citation2014) but might also be affected by a decline in diatoms.
Figure 6. Zooplankton in near-surface water of Camanche Reservoir before (1988–1992) and after (1994–2004) HOS, which began in July 1993. Grand annual means were rotifers 29/L (before) and 50/L (after); crustaceans 9/L (before) and 12/L (after) HOS. Incomplete or no data are available for 1994 and 1996–1998.
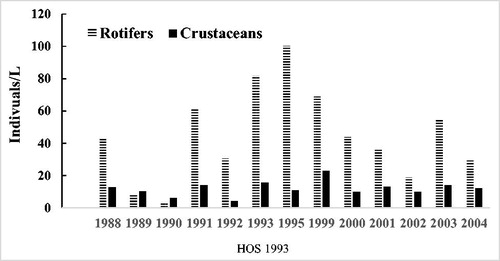
For the larger crustacean zooplankton, the annual mean concentrations varied from 4.1 to 23 individuals/L with peak numbers averaging 51.9/L (range 28 to 94/L). The annual average number of crustaceans prior to HOS was 9.4/L (1988–1992), while for comparable periods after HOS the average was higher at 12/L (). The differences were not statistically different (p = 0.022, n = 174, two-tailed test, equal variances), Nevertheless, the small increase could be real since the high variation in numbers for each sampling reduces statistical power. Eleven years after, HOS zooplankton concentrations were unchanged at 12/L (). Annual average peak numbers were 57.8/L before HOS and slightly lower at 48.7/L after HOS. Average crustacean densities in the surface water of Camanche Reservoir are lower than in some other eutrophic waters; in particular, the pre-HOS May–August averages of 15–22/L compares with about 20/L (Madison Lake) and 100/L (South Center Lake) for 2 Minnesota lakes with peak Chl-a similar to pre-HOS Camache Reservoir (Heiskary et al. Citation2016). The lower numbers are possibly due to the surface sampling during daylight hours rather than epilimnion vertical hauls, since large zooplankton tend to avoid illuminated water to escape fish predation. Nonetheless, zooplankton sometimes peak in lake surface water (Halvorsen et al. Citation2004).
Discussion
This article reports the first successful long-term use of a large HOS when used alone. Some smaller HOS systems have successfully reversed eutrophication, but few results are available in the archival literature. Examples in the gray literature (nonarchival publications like consultants’ reports that may or may not be peer reviewed) include small Speece cones in Indian Creek Reservoir, California (California Waterboards Citation2014), and Marston Reservoir, Colorado (WaterWorld Citation2012), and pure oxygen bubbles in Arvada Reservoir, Colorado (Dominick and DiNatale Citation2009). An exception is the Speece cone in Newman Lake, Washington (Moore and Christensen Citation2009, Moore et al. Citation2009, Moore Citation2012), where eutrophication was reversed. However, the Newman Lake story is complicated by three other management techniques: direct whole lake alum treatment, later continuous alum additions through the Speece cone along with the oxygen, and substantial watershed improvements. Another successful HOS application was in Upper San Leandro Reservoir, Oakland, CA (volume = 40 million m3) using an uncontained bubble plume (Mobley et al. Citation2003). But again, the results were complicated by artificial extended spring destratification using air lift pumps. In that case the idea was to prolong the spring diatom bloom and restrict the June geosmin-producing bloom of Dolichospermum (Horne et al. Citation2003). In Camanche Reservoir the HOS was used alone and 11 yr of post-HOS data enable a longer term assessment of its performance.
The change in trophic state at Camanche Reservoir was rapid. Large reductions in TP, phosphate, and ammonium in the hypolimnion occurred within 4 weeks with no increase in the low levels of nitrate. For comparison, about 5 yr was required to achieve comparable results during the successful reversal of eutrophication in Lake Washington, Seattle, WA, after sewage inputs were diverted (Edmondson Citation1972, Horne and Goldman Citation1994, 503). Lake Washington is about 6 times larger than Camanche Reservoir, and it never had an anoxic hypolimnion, though the hydraulic residence times of both are short. Importantly, improvements at Camanche Reservoir were achieved without moving the nutrient load to another downstream site. Wherever they came from, the legacy pollution of nutrients in Camanche Reservoir is now locked in the bottom sediments as phosphorus compounds or released as N2 gas to the atmosphere.
The oligotrophication of Camanche Reservoir required regular use of HOS in summer–fall. The 2 occasions when HOS was not used showed an increase in bioavailable phosphorus and possibly ammonium soon after sediment anoxia resumed. Maintaining a minimum bottom water DO of >5 mg/L, rather than the 2 mg/L used currently at Camanche Reservoir, would give a greater margin of safety. Depending on the kinetics of sediment oxygen demand induced by HOS, the additional 3 mg/L DO safety factor would provide 2 to 6 weeks of sediment nutrient releases suppression without HOS.
Change in trophic state
The trophic state changes found in Camanche Reservoir attributable to HOS can be determined using 4 commonly measured variables: 2 direct and 2 indirect (). Two out of the four indicators showed a change from eutrophic to oligotrophic, one showed a change from mid-mesotrophic to oligotrophic, and one showed a change from borderline eutrophic to mid-mesotrophic. Based on direct measures of Chl-a and Secchi depth, HOS changed the trophic status of Camanche Reservoir from eutrophic to oligotrophic. Chl-a decreased from 14.7 to 2.8 µg/L and Secchi depth increased from ∼0.5 to 5.6 m. In addition, peak Secchi depth rose in 2004 to 10 m, which is an indication of a hyper-oligotrophic state (). The two indirect measures, TP and TIN, gave slightly different results. The TP in late winter surface water prior to the spring phytoplankton bloom moved from borderline eutrophic (29 μg/L) before HOS to mid-mesotrophic (14 μg/L) afterward. Much less attention has been paid to the effects of TN in a trophic state and even less for TIN. Using TIN as a trophic state indictor in Camanche Reservoir following HOS (), the trophic state changed from the meso–eutrophic boundary (TIN 198 μg/L) to strongly oligotrophic (23 μg/L).
Table 6. Delineation of trophic state based on 4 commonly measured variables, 2 direct (algae and water clarity) and 2 indirect (nutrients). The table is based on literature surveys summarized in Horne (Citation1996) and Cooke and Welch (Citation2008)
We could find no other studies on the effect of HOS on zooplankton, which appeared unaffected by HOS at Camanche Reservoir, although there was a limited dataset. The Speece cone HOS technique is possibly the least physically disturbing of the common oxygenation or aeration management methods, and as such would only affect zooplankton indirectly. Based on the large decline in Chl-a, it might be expected that zooplankton would have less food and show declines. Yet crustaceans such as Daphnia and Bosmina, common in California waters, do not feed on large colonial cyanobacteria. In experiments zooplankton reject them and they may even be toxic to most zooplankton (Lampert and Sommer Citation1997, Qiuqi et al. Citation2014). although there is debate about this (Haney Citation1987). However, large Daphnia do feed on diatoms like Fragilaria, for which the populations fell 66% soon after HOS and 93% after 11 yr.
Since crustaceans showed only a small and statistically nonsignificant increase due to HOS and rotifers only a short-term increase, it is possible that zooplankton abundance in Camanche Reservoir was not food limited between 1988 and 2004. Aphanizomenon and Dolichospermum probably did not play a major role in the planktonic food web, and large diatoms like Fragilaria were probably present in excess of zooplankton needs. The large stocked sport-fish populations and the absence of an oxygenated hypolimnion refuge from predation for large zooplankton prior to HOS may have depressed crustacean zooplankton abundance.
The most unexpected finding was that the high ammonium concentrations present in the anoxic hypolimnion in July 1993 were not nitrified to a stoichiometric equivalent amount of nitrate following oxygenation (Beutel Citation2006). Nitrification presumably occurred, but only a few weeks after HOS was switched on, ammonium and nitrate were both very low. The loss of nitrate is likely due to coupled nitrification–denitrification (CND) and has since been observed in both lake aeration studies (Horne Citation2013) and laboratory experiments using isolated sediment cores from a very shallow, eutrophic Machado Lake Reservoir in Los Angeles, CA (Horne Citation2009). The CND hypothesis is that HOS or aeration do not fully oxygenate the sediments of most reservoirs all the time (Horne et al. Citation2019). Unlike the rather stable deep ocean anoxic layer or well-mixed wastewater treatment plants, the beds of reservoirs have spatial variation over time (day–night, seasons) and geographic variation (old stream trenches, zones of high biological oxygen demand [BOD] deposition). This variability could give opportunities for alternation between lower and higher DO, as has been shown in summer over several years during artificial aeration in eutrophic Lake Elsinore in southern California (Horne Citation2013). Another possibility is anammox, which also converts NH4 to N2 but via a different pathway (NH4+ + NO2− → N2 + 2 H2O). Anammox needs less oxygen than denitrification so is favored in permanently anoxic sites like the deep ocean or wastewater treatment plants where nitrate is low. However, anammox bacteria grow slowly and thrive best at higher temperatures than the 13 C found on the sediments of Camanche Reservoir (Shen et al. Citation2017).
Oligotrophication by decreasing nitrogen
Reduction of overall TIN in the surface waters prior to the spring algae blooms (decrease of 83% from 198 to 23 µg/L) seems more important in Camanche Reservoir than reducing TP (decrease of 58%, 33 to 14 µg/L). This finding is partially supported by recent work (Bergstrom Citation2010, Paerl et al. Citation2016) that considers both N and P to be important. An important question is whether N2 fixation by cyanobacteria would compensate for reductions in bioavailable N, making N reduction not a suitable lake management strategy as was suggested by Welch (Citation2009). In Camanche Reservoir heterocyte to vegetative cell counts on the small amounts of Aphanizomenon still present after HOS indicate that N2 fixation was approaching the maximum rate (Horne Citation1979). Nonetheless, this rate was insufficient in this case to allow the large blooms that occurred in the pre-HOS period. The approximately 50% decrease in TP may have interacted with a low nitrate and lower soluble iron concentrations (Horne and Jung Citation2019) to give the observed decline in cyanobacteria following HOS.
Application of HOS to reservoir management elsewhere
From the reservoir manager’s viewpoint, the large reduction in peak algal biomass may be more important than changing trophic state. Nuisances and impairment of public use of reservoirs are often associated not with the mean or median but with peaks and unsightly surface scum-forming blooms. Peak Chl-a values in Camanche Reservoir fell by 65% from 49 µg/L (1990–1992) to 17 μg/L (1994–1997) and by 84% to 8 μg/L by 2004, 11 yr after HOS. Scum-forming Aphanizomenon fell by more than 90%. Ammonium peak value prior to HOS was 1700 μg N/L (Oct 1990), a level high enough to deter fish, so its reduction to low levels by HOS would assist in maintaining a healthy cool-water fishery in the hypolimnion. In our opinion, lake and reservoir managers can use HOS with confidence that it will reduce eutrophication in moderately eutrophic, thermally stratified lakes and reservoirs with anoxic hypolimnia whether algal growth is limited by N or P or both. This statement assumes that internal loading of nutrients is the source driving summer–fall eutrophication. Removal of soluble phosphate during HOS was rapid, probably weeks at most. Because there are several stages in the removal of inorganic N, its removal may take a few months, based on the Camanche experience.
The nutrient budget for Camanche Reservoir, as for many eutrophic lakes, is dominated by internal nutrient loading (Filbrun et al. Citation2013) from releases from anoxic sediments. The Speece cone variant of HOS should be most effective at reducing algae in such waters because it places a stable dense layer of high DO water directly over the sediments. What is less certain is the effect of HOS if the summer–fall nutrient budget is dominated by surface water inflows. For example, wastewater inflows from cities or agriculture and summer rains flush nutrients directly to the reservoir, and hypolimnetic oxygenation or aeration may have less effect on algae. However, in temperate climates, the inflowing, cooler and denser water from summer storms generally flows just below the thermocline (DiNatale Water Consultants Citation2018). This mid-level water is susceptible to treatment with oxygen. In such cases, general hypolimnion oxygenation might be best (Mobley et al. Citation2003). In any situation, correctly designed HOS will reliably eliminate one of the worst scourges of eutrophication, a fishless, anoxic deep-water zone (Welch et al. Citation2011).
Summary
The hypolimnetic oxidation system (HOS) using a Speece cone installed in Camanche Reservoir in 1993 produced the following changes in trophic state:
Chlorophyll a: mid-eutrophic transformed to oligotrophic based on changes in seasonal mean and maximum.
Water clarity (Secchi depth): middle eutrophic transitioned to middle mesotrophic based on seasonal means and maximum water clarity.
Total phosphorus: borderline eutrophic altered to mid-mesotrophic.
Total inorganic nitrogen: mid mesotrophic transformed to strongly oligotrophic.
Cyanobacteria: blooms stopped; cell concentrations fell >95%.
Diatoms: dominant Fragilaria cell counts declined ∼75%.
Zooplankton: crustaceans rose slightly after HOS and rotifers showed a short-term (few years) increase but samples were from surface water only and differences were not statistically significant; no decline in zooplankton observed.
Nutrients: TP, soluble phosphate, nitrate, and ammonium all declined substantially (>50%)
Unexpected effect on the N cycle: nitrification of ammonium in the hypolimnion did not result in high nitrate, which remained low; bacterial denitrification at the moderately warm (13–15 C) sediment–water interface could account for the lack of nitrate.
References
- [APHA] American Public Health Association. 1985b. Standard methods for water and wastewater analysis, 16th ed. Washington (DC).
- Ashley KI, Mavinic DS, Hall KJ. 2008. Oxygenation performance of a laboratory-scale Speece cone hypolimnetic aerator: preliminary assessment. Can J Civ Eng. 35(7):663–75. doi:10.1139/L08-011.
- Baker JB, Southard RJ, Mitchell JP. 2005. Agricultural dust production in standard and conservation tillage systems in the San Joaquin Valley. J Environ Qual. 34(4):1260–9. doi:10.2134/jeq2003.0348.
- Bergstrom AK. 2010. The use of TN:TP and DIN:TP ratios as indicators for phytoplankton nutrient limitation in oligotrophic lakes affected by N deposition. Aquat Sci. 72:277–81.
- Beutel MW. 2006. Inhibition of ammonia release from profundal sediments in lakes using hypolimnetic oxygenation. Ecol. Engin. 28(3):271–9. doi:10.1016/j.ecoleng.2006.05.009.
- Beutel MW, Horne AJ. 1999. A review of the effects of hypolimnetic oxygenation on lake and reservoir water quality. Lake Reserve Manage. 15(4):285–97. doi:10.1080/07438149909354124.
- Brett MT, Ahopelto SK, Brown HK, Brynestad BE, Butcher TW, Coba EE, Curtis CA, Dara JT, Doeden KB, Evans KR, et al. 2016. The modelled and observed responses of Lake Spokane hypolimnion dissolved oxygen concentrations to phosphorus inputs. Lake Reserve Manage. 32(3):246–58. doi:10.1080/10402381.2016.1170079.
- Brown & Caldwell Inc. 1995. Camanche Reservoir oxygenation demonstration system: report on operation 1993/94. Oakland (CA): Brown & Caldwell, Alex Horne Assoc. & Biosystems Analysis Inc. for EBMUD.
- California Waterboards. 2014. Indian Creek reservoir TMDL. Phosphorus. [accessed 2003 July 1]. http://www.waterboards.ca.gov/…/tmdl/indian_creek/docs/ocr_implstsrpt.pdf.
- Chislock MF, Doster E, Zitomer RA, Wilson AE. 2013. Eutrophication: causes, consequences, and controls in aquatic ecosystems. Nat Educ Knowl. 46:10.
- Cooke GD, Welch EB, Peterson SA, Newroth PR. 2005. Restoration and management of lakes and reservoirs. 3rd ed. Boca Raton (FL): Lewis.
- Cooke JD, Welch EB. 2008. Eutrophication of Tenkiller Reservoir, Oklahoma, and effects on water quality and fisheries. Oklahoma City (OK): Expert Report for State of Oklahoma. Case No. 05-CU-329-GKF-SAJ.
- Cunha DGF, Lima VF, Néri AM, Marafão GA, Miwa ACP, Calijuri MD, Bendassoli JA, Tromboni F, Maranger R. 2017. Uptake rates of ammonium and nitrate by phytoplankton communities in two eutrophic tropical reservoirs. Internat Rev Hydrobiol. 102:125–34. doi:10.1002/iroh.201701900.
- Dillon TM, Rigler FH. 1974. The phosphorus-chlorophyll relationship in lakes. Limnol Oceanogr. 19(5):767–73. doi:10.4319/lo.1974.19.5.0767.
- DiNatale Water Consultants. 2018. Phase 1 Reservoir water quality and management assessment. Charlottesville (VA): Report to Rivanna Sewer and Water Authority.
- Dominick S, DiNatale K. 2009. Mile-high decisions, Denver. Lakeline. Aeration Issue, Oct.:19–23.
- Edmondson WT. 1972. Nutrients and phytoplankton in Lake Washington. Limnol Oceanogr Sp Symp. 1:172–93.
- EBMUD. 1996. Lawsuit against Georgia Pacific Co. Court of Appeals, 1st District. CA No. Ao64890. 28 Feb. 1996.
- Elder JF, Horne AJ. 1977. Biostimulatory capacity of dissolved iron for cyanophycean blooms in a nitrogen-rich reservoir. Chemosphere. 9:525–30. doi:10.1016/0045-6535(77)90105-9.
- Filbrun JE, Conroy JD, Culver DA. 2013. Understanding seasonal phosphorus dynamics to guide effective management of shallow, hypereutrophic Grand Lake St. Mary’s, OH. Lake Reserve. Manage. 29:165–78. doi:10.1080/10402381.2013.823469.
- Fuller LM, Taricska CK. 2011. Water characteristics of Michigan’s inland lakes, 2001–2010. US Dept Interior Sci Report 2011-5233.
- Gemza AF. 1997. Water quality improvements during hypolimnetic oxygenation in two Ontario lakes. Water Qual Res J Can. 32(2):365–90. doi:10.2166/wqrj.1997.024.
- Halvorsen G, Dervo BK, Papinska K. 2004. Zooplankton in Lake Atnsjøen 1985–1997. Hydrobiologia. 521(1–3):149–75. doi:10.1023/B:HYDR.0000026357.80231.d2.
- Haney JF. 1987. Field studies on zooplankton-cyanobacteria inter-actions. New Zealand J Mar Freshwat Res. 21(3):467–75. doi:10.1080/00288330.1987.9516242.
- Heiskary S, Hirsch J, Rantala H. 2016. Patterns in phytoplankton and zooplankton in Minnesota lakes. Minnesota St. Paul (MN): Department of Natural Resources Special Publication.
- Horne AJ. 1979. Nitrogen fixation in Clear Lake, California. IV. Diel studies on Aphanizomenon and Anabaena blooms. Limnol Oceanogr. 24(2):329–41. doi:10.4319/lo.1979.24.2.0329.
- Horne AJ. 1996. Defining the eutrophic and mesotrophic states for Standley Lake. Report to City of Westminster, CO.
- Horne AJ. 2009. Machado Lake, Los Angeles: Nutrient flux measurements to assist in the detailed design of restoration techniques. Cucamonga (CA): LA Dept. Parks & Rec. and CDM Consultants.
- Horne AJ. 2013. Nitrogen offsets produced by artificial water column mixing by aeration bubble plumes in Lake Elsinore, California. Report to Elsinore Valley MUD.
- Horne AJ. 2019a. Hypolimnetic oxygenation 1: win-win solution for massive salmon mortalities in a reservoir tail-water hatchery on the Mokelumne River, California. Lake Reserve Manage. 35(3):308–322. doi:10.1080/10402381.2019.1649770.
- Horne AJ. 2019b. Hypolimnetic oxygenation 4: effects on turbidity in the reservoir and fish hatchery water supply, California. Lake Reserve Manage. Forthcoming.
- Horne AJ, Commins ML. 1987. Spatial heterogeneity of the dominant cyanobacteria in the surface waters of Lake Rotongaio. New Zealand. J Mar Freshwat Biol. 21(3):527. doi:10.1080/00288330.1987.9516251.
- Horne AJ, Faisst, W. 2019. Hypolimnetic oxygenation 6: costs of installation and operation; improvement in fisheries, hydropower, and drought management. Lake Reserve Manage. Forthcoming.
- Horne AJ, Fogg GE. 1970. Nitrogen fixation in some English lakes. Proc Roy Soc Lond B. 175:351–66.
- Horne AJ, Galat DL. 1985. Nitrogen fixation in an oligotrophic, saline desert lake: Pyramid Lake, Nevada. Limnol Oceanogr. 30(6):1229–1239. doi:10.4319/lo.1985.30.6.1229.
- Horne AJ, Goldman CR. 1972. Nitrogen fixation in Clear Lake, California. I. Seasonal variation and the role of heterocysts. Limnol Oceanogr. 17(5):678–92. doi:10.4319/lo.1972.17.5.0678.
- Horne AJ, Goldman CR. 1994. Limnology. 2nd ed. New York (NY): McGraw-Hill.
- Horne AJ, Jung R. 2019. Hypolimnetic oxygenation 5: reductions in heavy metals in the reservoir downstream of an abandoned copper mine following HOS. Lake Reserve Manage. Forthcoming.
- Horne AJ, Jung R, Lai H, Faisst, B. Beutel M. 2019. Hypolimnetic oxygenation 2: oxygen dynamics in a large reservoir with submerged downflow contact oxygenation. Lake Reserve Manage. 35(3):323–337. doi:10.1080/10402381.2019.1648612.
- Horne AJ, Roderick-Jones R, Toms C. 2003. The 2002 oxygen bubble plume hypolimnetic oxygenation system in Upper San Leandro Reservoir: effectiveness for internal nutrient load reduction, effect on benthic blue-green algae and potential to reduce taste and odor causing blue green algae. Oakland (CA): Report to EBMUD.
- Hutchinson GE. 1967. A treatise on limnology. Vol. II. London (UK): Wiley.
- IJC. 2019. Fertilizer application patterns and trends their implications for water quality in the Western Lake Erie Basin. Windsor, ON (Canada): International Joint Committee.
- Kalff J. 2002. Limnology. 2nd ed. New York (NY): Prentice-Hall.
- Kanoshina I, Lips U, Leppanen J-K. 2003. The influence of weather conditions (temperature and wind) on cyanobacterial bloom development in the Gulf of Finland (Baltic Sea). Harmful Algae. 2(1):29–41. doi:10.1016/S1568-9883(02)00085-9.
- Lampert W, Sommer U. 1997. Limnoecology. Haney JF, translator. Oxford (UK): Oxford University Press. p. 198–99.
- Linderman RL. 1942. The trophic-dynamic aspect of ecology. Ecology. 23: 399–418.
- Little JC, McGinnis DF. 2001. Hypolimnetic oxygenation: predicting performance using a discrete-bubble model. Water Sci Technol Water Supply. 1(4):185–91. doi:10.2166/ws.2001.0083.
- Lund J. 1949. Studies on Asterionella. I. The origin and nature of the cells producing the spring maximum. J Ecol. 37(2):389–419. doi:10.2307/2256614.
- McDonald K, Lehman J. 2013. Dynamics of Aphanizomenon and Microcystis (cyanobacteria) during experimental manipulation of an urban impoundment. Lake Reserve Manage. 29(2):103–15. doi:10.1080/10402381.2013.800172.
- Mobley M, Jung R, Lai HH. 2003. Upper San Leandro’s hypolimnetic oxygenation system. NALMS Annual Meeting, Mashantucket, CT.
- Moore BC, Christensen D. 2009. Newman Lake restoration: a case study part I: chemical and biological responses to phosphorus control. Lake Reserve Manage. 25(4):337–50. doi:10.1080/07438140903172907.
- Moore BC, Richter AC, Christensen D. 2009. Newman lake restoration: a case study part II: microfloc alum injection. Lake Reserve Manage. 25(4):351–63. doi:10.1080/07438140903172923.
- Moore BC, Cross BK, Beutel M, Dent S, Preece E, Swanson M. 2012. Newman Lake restoration: a case study part III: hypolimnetic oxygenation. Lake Reserve Manage. 28(4):311–37. doi:10.1080/07438141.2012.738463.
- Nauwerk A. 1963. Die beziehungen zwischen zooplankton und phytoplankton im see erken. Symp Bot Ups. 17:1–163.
- Osgood RA. 2017. Inadequacy of best management practices for restoring eutrophic lakes in the United States: guidance for policy and practice. Inland Waters. 7(4):401–7. doi:10.1080/20442041.2017.1368881.
- Paerl HW, Scott JY, McCarthy MJ, Newell SE, Gardner WS, Havens KE, Hoffman DK, Wilhelm SW, Wurtsbaugh WA. 2016. It takes two to tango: when and where dual nutrient (N & P) reductions are needed to protect lakes and downstream ecosystems. Environ Sci Technol. 50:10805–13. doi:10.1021/acs.est.6b02575.
- Palmer CM, Walter HJ, Adams S, Lewis RL. 1977. Algae and water pollution. USEPA 600/9-77-036.
- Plautz J. 2018. Piercing the haze. Science. 361(6407):1060–63. doi:10.1126/science.361.6407.1060.
- Qiuqi L, Sarma SS, Nandini S, Han BP. 2014. Effect of cyanobacterium on competition between rotifers: a population growth study. Inland Waters. 4:319–26. doi:10.5268/IW-4.3.547.
- Sandusky JC, Horne AJ. 1978. A pattern analysis of Clear Lake phytoplankton. Limnol Oceanogr. 23(4):636–48. doi:10.4319/lo.1978.23.4.0636.
- Scheffer M. 1998. Ecology of shallow lakes. London (UK): Chapman and Hall.
- Shen L-D, Cheng H-X, Lui X, Lui J, h, Lui Y. 2017. Potential role of anammox in nitrogen removal in a freshwater reservoir. Environ Sci Pollut Res. 24:3890–9. doi:10.1007/s11356-016-8126-7.
- Sterner RW. 2011. C: N:P stoichiometry in Lake Superior: freshwater sea as end member. Inland Waters. 1(1):29–46. doi:10.5268/IW-1.1.365.
- Thienemann A. 1922. Die bieden chironomus arten tiefenfauna der norddeutschen seen. Ein Hydrobiologisches Problem Arch Hydrobiol. 13:609–46.
- Walz N. 1995. Rotifer populations in plankton communities: energetics and life history strategies. Experientia 51(5):437–53. doi:10.1007/BF02143197.
- WaterWorld. 2012. Aeration system tackles reservoir’s oxygen depletion. May 2012.
- Weissel T, Frahm A. 2001. Species-specific interactions between small planktonic ciliates (Urotricha spp.) and rotifers (Keratella spp.). J Plankton Res. 23(12):1329–38. doi:10.1093/plankt/23.12.1329.
- Welch EB. 2009. Should nitrogen be reduced to manage eutrophication if it is growth-limiting? Evidence from Moses Lake. Lake Reserve Manage. 25(4):401–9. doi:10.1080/07438140903323757.
- Welch EB, Cooke GD, Jones JR. 2011. DO-temperature habitat loss due to eutrophication in Tenkiller Reservoir. Lake Reserve Manage. 27(3):271–285.
- Wurtsbaugh WA, Horne AJ. 1983. Iron in eutrophic Clear Lake, California: its importance for algal nitrogen fixation and growth. Can J Fish Aquat Sci. 40(9):1419–29. doi:10.1139/f83-164.
- Zhang X, Lin C, Zhou X, Lei K, Guo B, Cao Y, Lu S, Liu X, He M. 2019. Concentrations, fluxes, and potential sources of nitrogen and phosphorus species in atmospheric wet deposition of the Lake Quinghai watershed. China Sci Total Environ. 682:523–30. doi:10.1016/j.scitotenv.2019.05.224.
