
Abstract
Gantzer PA, Preece EP, Nine B, Morris J. 2019. Decreased oxygenation demand following hypolimnetic oxygenation. Lake Reserv Manage. 35:292–307.
We analyzed long-term oxygenation dynamics in 3 waterbodies: Spring Hollow Reservoir (SHR) and Carvins Cove Reservoir (CCR), which are water supply reservoirs, and North Twin Lake (NTL), a natural lake. Bubble plume line diffuser hypolimnetic oxygenation system (HOS) operation was for 13, 10, and 7 yr for SHR, CCR, and NTL, respectively. Water column profiles were measured in all 3 waterbodies. Additionally, remotely deployed sensors were used to monitor dissolved oxygen (DO) in NTL year-round, specifically to capture winter conditions during ice cover. Hypolimnetic oxygen demand (HOD) was observed to decrease after several years of HOS operation in all 3 waterbodies. Annual HOD decreased more for HOS operated year-round compared to recovery-based operation where HOS was started after DO decreased below 5.0 mg/L. Additionally, HOD throughout the summer stratified period was lower following maintenance of higher DO during spring prior to onset of stratification. An analogous result was observed during winter ice cover relative to DO conditions following fall turnover. Prior work showed increased HOD during HOS operation compared to pre-HOS. The increased HOD during HOS operation was termed diffuser-induced oxygen demand and implied the HOS was inducing oxygen demand. However, the current work shows HOS operation is not actually inducing oxygen demand; rather, it is addressing the existing oxygen demand already in the sediments. Our data suggest that a HOS is an effective tool to maintain hypolimnion DO in stratified lakes and reservoirs. When operated year-round or before DO decreases, HOS can decrease HOD and reduce overall long-term operational costs.
Eutrophication from urbanization (Jenny et al. Citation2016) has been observed as a growing problem in lakes and reservoirs around the world (O’Neil et al. Citation2012). A major indicator of the growing eutrophication problem is oxygen demand in the hypolimnion in excess of available dissolved oxygen (DO) in bottom waters at the onset of stratification, leading to hypolimnetic hypoxia and in severe cases anoxia (Moore Citation2003, Matthews and Effler Citation2006a, Beutel et al. Citation2007). Anoxic conditions then cause flux of dissolved metals and nutrients from the sediments into bottom waters (Gafsi et al. Citation2009, Gerling et al. Citation2014), thus perpetuating eutrophication.
Oxygen-consuming processes such as sediment oxygen demand (SOD) and water column oxygen demand (WOD) which are driven by bacteria respiration and abiotic oxidation of reduced solutes (Bryant et al. Citation2011), contribute to the overall observed hypolimnetic oxygen demand (HOD; Higashino and Stefan Citation2005, Matthews and Effler Citation2006b, Beutel et al. Citation2007). Hypolimnetic oxygen demand shifts from predominantly SOD at the onset of stratification in spring to WOD by late summer (Davis et al. Citation1987). This shift is a result of the decreased DO available at the sediment-water interface (SWI) as the anoxic zone over the sediment expands upward. As the anoxic zone forms, organic detritus incompletely oxidizes as it settles through the hypolimnion. Incompletely oxidized organic detritus becomes incorporated in the sediment, causing SOD, which is basically the oxygen debt remaining from unsatisfied WOD to be exacerbated.
There are several methods employed to combat hypolimnetic anoxia, including the use of pure oxygen through hypolimnetic oxygenation systems (Beutel and Horne Citation1999, Singleton and Little Citation2006). One form of hypolimnetic oxygenation system (HOS) is a bubble plume line diffuser in which pure oxygen is injected directly into the water column (Mobley et al. Citation2019). Because of induced mixing caused by a HOS, HOD rates have been observed to be higher during operation compared to historical HOD prior to HOS operation (Gantzer et al. Citation2009, Bryant et al. Citation2011, Gerling et al. Citation2014). Stefan et al. (Citation1987), and Soltero et al. (Citation1994) attributed additional HOD to increased SOD from increased turbulence at the SWI. Ashley (Citation1983) attributed additional HOD to increased WOD from an increased effective depth, where the effective depth corresponds to the increased time that particles remain in suspension from induced mixing during HOS operation compared to settling time through the water column prior to HOS installation. Previous work by Gantzer et al. (Citation2009) identified increased HOD during HOS operation as diffuser-induced oxygen demand (DIOD). The term DIOD implies that HOS operation is inducing DO demand, stimulating an increase in DO consumption (Gantzer et al. Citation2009, Bierlein et al. Citation2017). But HOS operation is not actually inducing DO demand; rather, it is exposing the existing DO demand already in the sediments. Hypolimnetic oxygenation systems physically change the amount of DO that can reach these sediments by (1) increasing DO directly over sediments and (2) decreasing the diffusive boundary layer from increased turbulence at the SWI (Bierlein et al. Citation2017, Bryant et al. Citation2011). This increased sediment oxygen uptake translates to increased SOD and thus increased HOD (Gerling et al. Citation2014).
Based on the theory that increased HOD during HOS operation originates from factors increasing SOD, and that SOD is partially a result of the annual deposition of incompletely oxidized detritus, it can be deduced that increased HOD from HOS operation is meeting historical SOD from previous years’ organic (detritus) deposition. Adding oxygen should enable annual WOD and historical SOD to be more completely satisfied over several years of HOS operation, thus decreasing HOD over time. Indeed, decreased HOD over several years of HOS operation has been hypothesized (McQueen and Lean Citation1984, Matinvesi Citation1996, Moore et al. Citation1996, Matthews and Effler Citation2006b). However, no long-term studies of HOD reduction have been published to date, except for results in SHR from 2006 to 2008 presented by Gantzer et al. (Citation2009). In this study, we present long-term data on the effects of HOS using bubble plume line diffusers in 2 water supply reservoirs (Spring Hollow and Carvins Cove) and one natural lake (North Twin Lake) over 6–13 yr.
Study sites
We analyzed long-term DO response to HOS operations in 3 waterbodies: Spring Hollow Reservoir (SHR), Carvins Cove Reservoir (CCR) and North Twin Lake (NTL; ). These 3 waterbodies provide a large gradient of DO depletion rates in that SHR is deep, CCR is much shallower with much less of the bottom directly influenced by HOS operation, and NTL is also shallower but is a naturally formed lake with distinct seiching, producing high turbulence in the hypolimnion.
Table 1. Waterbody and oxygenation system characteristics for Spring Hollow Reservoir, Carvins Cove Reservoir, and North Twin Lake
Spring Hollow Reservoir and CCR are water-supply reservoirs for the city of Roanoke, VA, and surrounding counties located on private, heavily forested watersheds in southwestern Virginia. Spring Hollow Reservoir was built in 1995 at 433 m elevation and is a pump storage, side-stream reservoir that is supplied by withdrawing water from the Roanoke River during flow periods above a state-regulated threshold. Carvins Cove Reservoir, built in 1928 at 370 m elevation, is supplied by 2 natural tributaries that flow through agriculturally dominated lands and by 2 creeks from an adjoining watershed that are routed through diversion tunnels. North Twin Lake is a natural lake at 710 m elevation located in a densely forested watershed in northeastern Washington state, and is supplied by runoff from the surrounding watershed and inflows from groundwater ().
Materials and methods
System design and operation
All 3 water bodies had bubble plume line diffuser HOSs installed using pure oxygen generated by vaporizing stored liquid oxygen. The 3 HOSs were designed to increase and maintain oxic conditions in the hypolimnion during summer stratification. A primary goal of HOS operation in the water supply reservoirs was to improve raw water quality by decreasing the mobilization of soluble metals from the sediment to the hypolimnion (Gantzer et al. Citation2009). For NTL, the primary goal of HOS operation was to restore cold-water fish habitat for brook and rainbow trout (Moore et al. Citation2014). The following section summarizes information related to the HOSs installed for each project and corresponding operation. All 3 HOSs were operated each year during their respective study periods without any unscheduled down times and represent a wide range of oxygen-addition capacity.
Spring Hollow Reservoir
Spring Hollow Reservoir initially had a single 915 m bubble plume line diffuser hypolimnetic aeration system (HAS) installed in 1997. Operation of the original HAS in 1997 began in November with compressed air. Operation at full capacity late in the stratified season coupled with a substantial portion of the HAS extending above the thermocline caused rapid destratification of the water column. During subsequent years of operation, 1998–2000, only the first 460 m of the HAS was operated, using compressed air. This was accomplished by closing a valve positioned in the middle of the HAS to isolate the back half. In 2002, the HAS was upgraded to operate on pure oxygen and shortened to 610 m. The HOS was designed with an oxygen delivery capacity of 1100 kg/d to better meet DO demand. As previously designed, an isolation valve was installed in the middle. Following initial testing of the HOS, the valve positioned in the middle remained closed and only the first 305 m was used.
From 2002 to 2006 the HOS was operated seasonally when volume-weighted hypolimnetic DO was below 5.0 mg/L. Since 2006, the HOS was operated year-round, making seasonal adjustments to the applied oxygen flow rate. The year-round strategy was implemented because less DO was needed on an annual basis if it was applied continuously throughout the year, especially during winter isothermal conditions when DO penetration below the SWI is more easily achieved from the natural mixing throughout the water column. Even though the SHR HOS has a design capacity of 16 normal cubic meter per hour (NCMH), it was predominantly operated at 0.8 NCMH (about 5% of the original oxygen gas flow rate), adding 9000 kg of oxygen to the hypolimnion throughout the year.
Carvins Cove Reservoir
The HOS installed in CCR in 2005 consisted of two 610 m bubble plume line diffusers over the deepest region of the reservoir, in front of the withdrawal structure. Because the HOS was located along a short 600 m section of the basin relative to the overall hypolimnion length of over 7500 m, it only directly influenced approximately 20% of the hypolimnion. Dissolved oxygen addition to the remaining portion of the hypolimnion is dependent on other mixing processes. Each 610 m HOS line is controlled by an Alicat digital mass flow controller (Alicat Scientific, Tucson, AZ). Like SHR, CCR has an isolation valve in the middle of each HOS line that provided a range of operational capacities. However, after initial testing, both valves remained open to allow for the full length of the HOS to be used. The HOS were designed with a total oxygen delivery capacity of 2100 kg/d.
The HOS installed in CCR was operated continuously since it was installed in 2005, except for 2 periods of scheduled shutdown, in 2006 and 2007, to further evaluate water column and sediment interactions to HOS operation (Gantzer et al. Citation2009, Bryant et al. Citation2011). For the first 2 yr of CCR HOS operation, various oxygen flow rates were tested to determine their influence on the water column (Gantzer et al. Citation2009). Following the flow rate testing, the HOS was operated year-round, making seasonal adjustments to flow, the same as described for SHR. Carvins Cove Reservoir has a design capacity of 100 NCMH but is operated at approximately 8 NCMH in winter during isothermal conditions and increasing to 65 NCMH by the end of summer stratification. On average, CCR receives 290,000 kg of oxygen annually.
North Twin Lake
The NTL HOS project was a 7 yr study to minimize eutrophication and improve fish habitat (Moore et al. Citation2014) through a grant provided by the Bonneville Power Administration. A single 760 m bubble plume line diffuser was installed in NTL in 2008. The HOS was designed with an oxygen delivery capacity of 4200 kg/d. The HOS was positioned over the deepest region of the lake and extended across most of the hypolimnion. Compared to SHR and CCR, there were no extra components added to the HOS in NTL. The NTL HOS was only operated during summer stratification, which is more common for HOSs. This strategy allowed more oxygen to be added during stratification to meet budgetary constraints and prevented open-water conditions during winter ice cover.
North Twin Lake has a design capacity of 130 NCMH but was operated at approximately 65 NCMH beginning in late May to early June through September, with higher applied oxygen flow rates during May/June to recover DO from the onset of stratification. Another operational constraint was the total oxygen budget of 300,000 kg/yr because of how funds were allocated for the project. This budget required strategic operation not only to add enough oxygen over the summer to maintain oxic conditions throughout the hypolimnion, but also to extend operation as late in the season as possible. Often, the oxygen budget was spent before the lake destratified in the fall, resulting in depressed hypolimnion DO, leading into fall turnover and subsequently into winter ice cover conditions. On average, the HOS installed in NTL added approximately 290,000 kg of oxygen to the hypolimnion throughout the summer stratified season.
Data collection
Discrete depth profile data were collected on SHR and CCR using a Sea-Bird Electronics SBE 19plus (Sea-Bird Electronics, Bellevue, WA; 4 Hz sampling rate) high-resolution conductivity, temperature, and depth (CTD) profiler with DO. The same data were collected on NTL using an SBE 19PlusV2, which is the next-generation CTD from Sea-Bird Electronics. In addition to using the CTD to collect data on NTL, InSite IG model 31 optical DO sensors (InSite, Slidell, LA) connected to an Instrumentation Northwest (INW, Kirkland, WA) data logger with a submerged power supply were deployed year-round. Sensors were referenced from the bottom at select depths throughout the hypolimnion to record hourly DO and temperature from 2009 to 2017. Although the DO sensors were designed to minimize fouling and deposits on the lens, copper disks were added as an additional passive antifouling mechanism. Remotely deployed sensor data were validated with CTD profiles following each sample campaign and were removed from the water column during spring and fall site visits for cleaning and calibration, as well as for replacing or recharging batteries.
Discrete depth profiles
Discrete depth profile data were collected vertically throughout the water column on each waterbody to evaluate thermal structure and monitor DO. During 2003–2010 and 2004–2010, data were collected weekly during summer stratification and monthly during winter isothermal conditions in SHR and CCR, respectively. Discrete depth profiles were not collected in SHR or CCR between 2011 and 2013; however, monthly depth samples that correspond to intake elevations at 354, 351, 348, 344, 341, and 340 m above mean sea level were collected by CCR water treatment staff. These samples were collected using a Kemmerer bottle and analyzed for DO using a standard Winkler DO test kit. Although the monthly depth samples only provide a snapshot of DO in the hypolimnion compared to the more comprehensive CTD profiles, the monthly depth samples still provide a representation of DO changes over time. Monthly, year-round CTD profiles in SHR and CCR resumed in 2014. Discrete depth profiles were collected monthly in NTL during 2009–2013 summer stratification. During 2014–2017, CTD profiles were only collected 5 times per year but were strategically timed to capture early stratification (twice between April and June), middle of summer (twice between June and August), and at the end of summer (once between September and November).
Remotely deployed, fixed-elevation sensor data
In 2009 one DO sensor was deployed and positioned 1.5 m above the bottom. During 2010–2013, 4 DO sensors were deployed and positioned at 1.5, 3.0, 4.6, and 6.1 m above the bottom. During 2014–2015, 10 DO sensors were positioned at 0.1, 0.5, 1.0, 1.5, 2.0, 3.0, 4.0, 5.0, 6.0, and 8.0 m above the bottom. In 2016 the top sensor, positioned 8.0 m above the bottom, was removed, leaving 9 sensors throughout the hypolimnion. In 2017 the sensors were reduced to 5 sensors positioned at 0.1, 0.5, 1.0, 1.5, and 3.0 m above the bottom. One depth consistent throughout the study period was 1.5 m above the bottom. The additional sensors provided water column data during periods between monthly CTD profiling campaigns and winter data under the ice when CTD profiles could not be collected.
Data analysis
Discrete depth profiles
All discrete depth profiles were analyzed for (1) thermal structure, (2) volume-weighted hypolimnetic DO, and (3) DO rates of change following the same procedure outlined by Gantzer et al. (Citation2009) and Gerling et al. (Citation2014). This method was used because it provided consistency to determine thermocline boundaries and corresponding hypolimnion position, which considered the variability of positioning throughout the year. Additionally, calculations were conducted to include DO additions and losses through the thermocline (Gantzer et al. Citation2009, Gerling et al. Citation2014). When the HOS was not activated, (background) DO depletion rates were calculated by plotting DO versus time and then applying a regression analysis through the linear portion of the data (Lorenzen and Fast Citation1977). The result represents the HOD from all oxygen consuming processes. During HOS operation, observed changes in hypolimnion DO are the sum of all oxygen-consuming processes minus the DO added by the HOS. The amount of DO added by the HOS was determined using a validated plume model (Singleton et al. Citation2007).
Remotely deployed, fixed-elevation sensor data
The hypolimnion DO calculated in NTL, from the remotely deployed sensors, was determined using the sensors positioned in the bottom 6 m of the water column. Although this is not as accurate as the more comprehensive analysis with discrete depth profiles previously mentioned, it was representative of hypolimnion DO and provided results similar to the CTD profile data. The sensor data were aggregated by averaging hourly data over a 24-h period. The daily average DO measured by each sensor was used to track DO over time at each stratum and then used to estimate the volume-weighted hypolimnetic DO. Hypolimnetic oxygen demand rates were determined analogous to the methods described in the preceding.
Annual average calculations
Annual average hypolimnetic DO were determined for each waterbody by multiplying the volume-weighted hypolimnetic DO during stratification and the average water column DO during isothermal periods, for each sample day, by the time between samples, summed, then divided by the total time corresponding to the data collected.
Results
All 3 waterbodies exhibited increased volume-weighted hypolimnetic DO during HOS operations. As DO was maintained higher during initial spring stratification, the volume-weighted hypolimnetic DO and annual average hypolimnetic DO were higher in each waterbody. This increase in DO carried through fall turnover and winter ice cover. Spring Hollow Reservoir was observed to have decreased annual HOD over time following year-round HOS operation, whereas CCR was observed to have indirect annual reduction in HOD. North Twin Lake did not have a distinguishable decrease in annual HOD; however, observations during winter ice cover provided insight related to DO depletion rates for different strata between 0.1 and 6.0 m above the bottom. Additionally, 2 observations related to HOD appeared relevant: (1) decreased DO demand with increasing distance from the sediment during winter ice cover, and (2) increased HOD in CCR and NTL throughout the summer stratified season.
Spring Hollow Reservoir
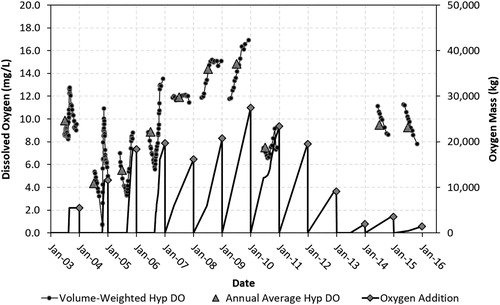
Aside from 1996 and 2001 when no HOD management was applied, SHR has undergone 3 distinct periods of HOD management: (1) hypolimnetic aeration using compressed air from 1997 to 2000, (2) hypolimnetic oxygenation using pure oxygen for short periods of time during summer stratification to recover hypolimnion DO from 2002 to 2006, with a comparison of HAS and HOS in 2003, and (3) year-round HOS operation, adjusting flow to maintain hypolimnion DO from 2006. Following HOS operation in 2009, the applied oxygen flow rate was decreased, and less oxygen was added to the hypolimnion each year through 2015. Since the upgrade to pure oxygen, annual average DO increased from 4.0 mg/L to 15.0 mg/L between 2004 and 2009 (). Data were not collected during 2011–2013; however, 2014 and 2015 operation and water column response compared to 2010 shows annual average DO in excess of 9.0 mg/L with approximately one-third the oxygen addition.
Figure 1. Summary of HOS operation and hypolimnion dissolved oxygen (DO) in Spring Hollow Reservoir (SHR). Solid black round symbols represent volume-weighted hypolimnetic DO. Black lines represent oxygen addition to the hypolimnion each year, and diamonds represent total annual oxygen added to the hypolimnion. Triangles represent volume-weighted, annual average hypolimnetic DO.
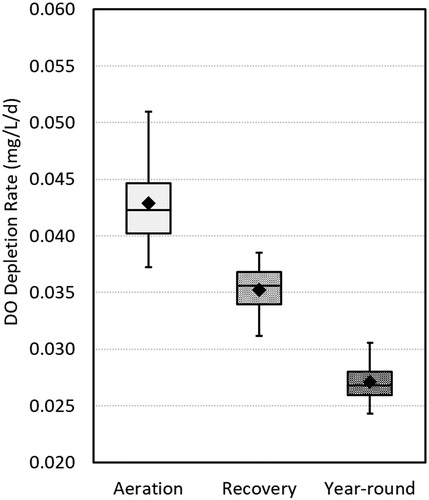
Hypolimnetic oxygen demand increased during the years of HAS operation from 0.039 to 0.045 mg/L/d (R2 = 0.74, n = 4), but more importantly, increased from 0.041 to 0.051 mg/L/d between 1996 and 2001; these are 2 years that provide a baseline comparison from no HAS operation. Hypolimnetic oxygen demand decreased following the upgrade from compressed air to pure oxygen in 2002, from 0.045 to 0.031 mg/L/d, with a spike of 0.047 mg/L/d in 2003. Excluding 2003 because it included 3 weeks of HAS operation, the period of recovery HOS operation had a steady HOD increase from 0.031 to 0.038 mg/L/d (R2 = 0.99, n = 4). Once the operational strategy was modified in 2006 to operate the HOS year-round, HOD decreased steadily over time, from 0.038 mg/L/d in 2006 to 0.024 mg/L/d in 2015 (R2 = 0.88, n = 4; ). Grouping periods of operational strategies together () and performing a comparison of means (an independent samples t-test, Welch test assuming unequal variances) revealed statistical significance between aeration and recovery operations (p = 0.049) and recovery and year-round operations (p = 0.008).
Figure 2. Summary of hypolimnion dissolved oxygen (DO) depletion (HOD) rates in Spring Hollow Reservoir. Black line represents system upgrade from operating with compressed air to pure oxygen. Open triangles represent years when no HOD management was applied. Circled triangle in 2003 indicates aeration and oxygenation operation.
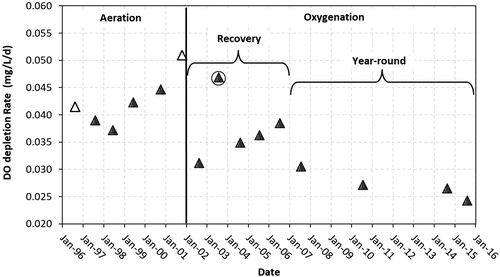
Figure 3. Box plot of HOD data for the 3 different periods of HOS operation in Spring Hollow Reservoir, where aeration corresponds to compressed air use, recovery corresponds to HOS operation to recover DO, and year-round corresponds to continuous HOS operation making seasonal adjustments to applied oxygen flow rate.
Carvins Cove Reservoir
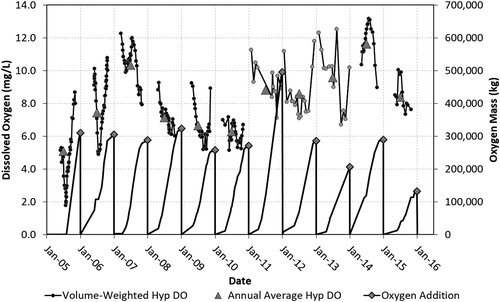
Essentially the same amount of oxygen, approximately 300,000 kg, was added to the hypolimnion each year in CCR from 2005 to 2010. Average oxygen addition from 2011 to 2015 was less, approximately 230,000 kg, but not significantly different (p = 0.06), with the most oxygen addition occurring in 2011, approximately 500,000 kg, and the least in 2015, approximately 131,000 kg (). Except for 2005, volume-weighted hypolimnetic DO was consistently above 5.0 mg/L for the study period (). Although on average less oxygen was added to the hypolimnion from 2011 to 2015 compared to 2005 to 2010, annual average hypolimnetic DO was significantly higher (p = 0.04), and averaged 9.5 and 7.2 mg/L respectively for the 2 time periods ().
Figure 4. Summary of HOS operation and hypolimnion dissolved oxygen (DO) in Carvins Cove Reservoir. Solid black round symbols represent volume-weighted hypolimnetic DO based on depth profiles. Gray round symbols represent discrete samples of withdrawals from the hypolimnion. Black lines represent oxygen addition to the hypolimnion each year, and diamonds represent total oxygen added to the hypolimnion each year. Triangles represent volume-weighted, annual average hypolimnetic DO.
North Twin Lake
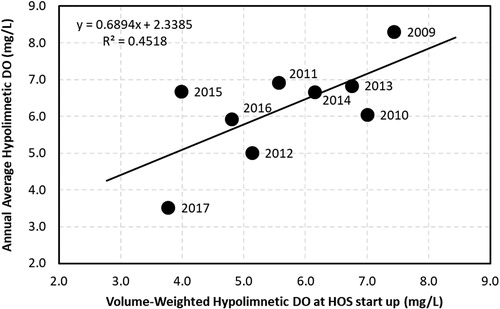
Like CCR, HOS operation at NTL added approximately 300,000 kg of oxygen to the hypolimnion annually, which aligned with the annual budget, except for 2013 when 360,000 kg was added. Review of the volume-weighted hypolimnetic DO showed the HOS was successful at recovering DO and then maintaining it throughout the operational period. Annual average hypolimnetic DO was 5.0–7.0 mg/L with no discernable temporal trend during the study period (). As the HOS was operated to recover DO more quickly in spring and extend operation later into fall in recent years, the annual average hypolimnetic DO increased (). The influence of the operation constraints related to the oxygen budget and spring startup was evident in comparison of annual average hypolimnetic DO and volume-averaged hypolimnion DO at HOS startup. Lower DO at HOS startup resulted in lower annual average hypolimnetic DO (R2 = 0.45; ). Data from the DO sensor positioned 1.5 m above the bottom, during winter ice cover, indicates a subtle decrease in HOD.
Figure 5. Summary of HOS operation and hypolimnion dissolved oxygen (DO) in North Twin Lake. Solid black round symbols represent volume-weighted hypolimnetic DO based on depth profiles. Gray round symbols represent data collected using remotely deployed sensors. Black lines represent oxygen addition to the hypolimnion each year, and diamonds represent total annual oxygen added to the hypolimnion. Triangles represent volume-weighted, annual average hypolimnetic DO.
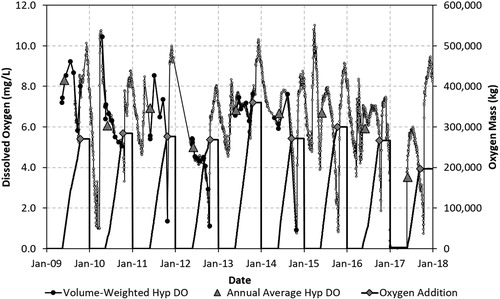
Figure 6. Summary of annual average hypolimnetic dissolved oxygen (DO) versus volume-weighted hypolimnetic DO at HOS startup.
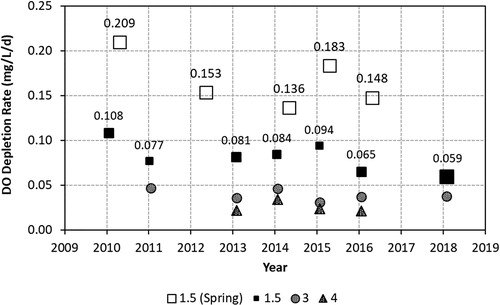
Review of data collected by remotely deployed DO sensors shows a steady decrease (R2 = 0.53, n = 7) in winter DO depletion rates for the DO sensor positioned 1.5 m above the bottom at a rate of 0.005 mg/L/d/yr (). DO depletion rates for the same sensors during initial spring stratification trended up and down with prior year winter rates, but lack of data during the final years of the study prevented confidence in saying the same decreased trend existed. Data collected from sensors positioned 3.0 and 4.0 m above the sediment showed no change over the study period, indicating that (1) the upper water column was not influenced by bottom DO depleted conditions, and (2) organic loading remained unchanged for the study period ().
Figure 7. Summary of dissolved oxygen (DO) depletion rates calculated from individual sensors positioned 1.5, 3.0, and 4.0 m above the sediment during winter and spring periods in North Twin Like from 2010 to 2018. The “1.5 (winter)” symbol sizes represent approximately 60, 80, and 120 days, which corresponds to the time period when the depletion rates were analyzed, which typically started in December. Data show a decreased DO demand for the winter sensor 1.5 m above the bottom, with spring rates showing dependence on winter rates. No discernable change is shown for winter sensors 3.0 and 4.0 m above the bottom.
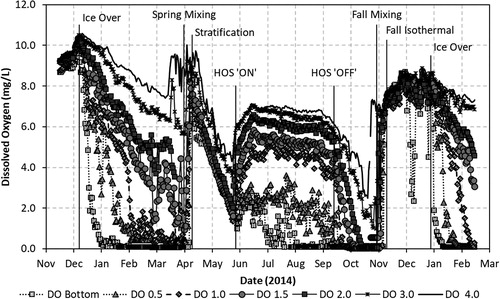
In 2014 additional DO sensors were positioned in NTL, increasing the previous 4 sensors to 10. Although this strategy was initiated to compensate for fewer CTD profiles, it resulted in identification of characteristics throughout the water column (). The DO data provided information to determine ice cover periods, anoxic periods in discrete strata, spring mixing after ice melt, and onset of spring stratification ().
Figure 8. An example of remote dissolved oxygen (DO) data collected in North Twin Lake throughout 2014 for the lower 7 sensors. Seasonal changes are identified, which correspond with the data, showing uniform conditions between fall and ice cover, differing depletion rates during ice cover, water column mixing during spring and fall, uniform depletion during stratification, and DO increase during HOS operation.
Each stratum was analyzed during ice cover to determine DO depletion rates. Analysis of these data revealed increased DO depletion rates for sensors closer to the bottom (). Reviewing data collected during winter ice cover periods between 2013 and 2016, upper strata DO depletion rates increased with depth (). There were differences in rates between years (), which corresponds to DO following fall turnover. This characteristic appeared to be seasonal, being more profound during quiescent conditions under ice cover. During periods of higher turbulence in the water column, such as initial stratification in late spring, rates between strata were more uniform with smaller differences in DO depletion rates between strata ().
Figure 9. Summarized dissolved oxygen (DO) depletion rates calculated for remote DO sensors placed throughout the water column during 2013–2014, 2014–2015, and 2015–2016 winter periods and 2014 and 2015 initial spring stratification. Data show decreased rates with increasing distance from the bottom during winter and more uniform rates during spring.
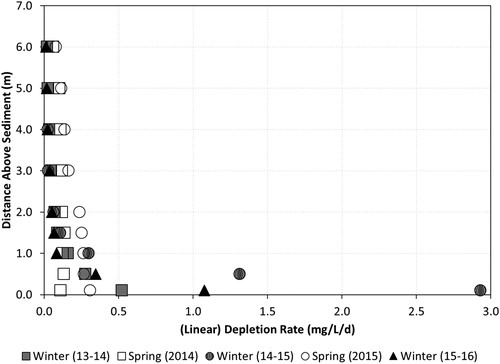
Table 2. Summary table of DO depletion rates for fixed elevation sensors deployed in North Twin Lake
Increased HOD throughout summer stratified period
CTD data collected in CCR and NTL throughout summer stratified periods were analyzed on a monthly basis for HOD during 2006–2014 and 2009–2013, respectively. Both waterbodies showed an increased HOD (; R2 = 0.75 and 0.88 for CCR and NTL, respectively) throughout the stratified season, usually April to October (). Closer evaluation of the data reveals contrasting results over time, with HOD increasing seasonally in NTL but decreasing seasonally in CCR. Because there are several factors affecting HOD (such as applied oxygen flow rates to the HOS, weather, and HOS operational variability), it is difficult to translate these results to the long-term effect on HOD. However, increasing HOD throughout the summer ultimately affects annual HOD results.
Figure 10. Summary of hypolimnion dissolved oxygen depletion rates in NTL (top) and CCR (bottom). Data from both waterbodies show an increase of approximately 0.002 mg/L/d2 throughout the stratified period.
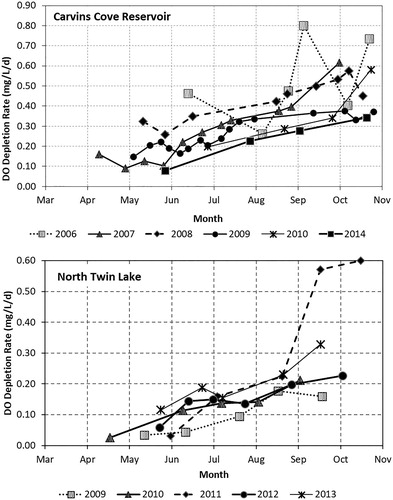
Table 3. Summary table of HOD rates throughout the stratified season in Carvins Cove Reservoir and North Twin Lake
Discussion
Long-term HOD reductions
Hypolimnetic oxygen demand in this study encompasses all oxygen consuming processes that are largely driven by organics from seasonal algal growth that complete their life cycle, die, and settle through the water column in late summer, then enter a hypoxic and in extreme cases an anoxic hypolimnion. With insufficient DO in the hypolimnion for bacteria to further oxidize settling organics, the remaining material is deposited on the sediment bed. Over time, the oxygen debt (in the sediments) continues to build, exacerbating HOD. Hypolimnetic oxygenation system operation caused decreases in HOD over long-term time periods (i.e., 6–13 yr) in SHR, increased volume-weighted and annual average hypolimnetic DO in CCR, and decreased winter and spring DO depletion rates in NTL for DO sensor(s) positioned 1.5 m above the sediments.
Hypolimnetic oxygen demand reductions in SHR were associated with long-term year-round HOS operation after 2006. This operational strategy resulted in lower applied oxygen rates to the HOS, thus lowering HOD rates compared to HOD rates during recovery operation. It is hypothesized that improved DO maintenance in the hypolimnion enabled settling organics to nearly completely oxidize before reaching the bottom, which reduces future SOD. Likewise, maintaining DO at the SWI provides the ability to meet SOD, which is largely contributed to by settled organics that were incompletely oxidized. It is unlikely that decreased HOD in SHR was partially caused by external factors because the watershed is private land and undeveloped. With no changes related to external loading to the reservoir, except for year-to-year variations in weather, rain, and corresponding runoff, we presume that organic loading in the surface waters remained constant. Therefore, elevated DO in the hypolimnion not only allowed any settling organics to nearly completely oxidize before reaching the bottom, but the increased DO at the SWI was more than enough to completely oxidize residual settled organics, while continuing to meet or exceed DO debt built up in the sediments, thus decreasing HOD.
Decreased HOD was not as pronounced in CCR as it was in SHR, despite year-round HOS operation and elevated DO throughout the hypolimnion during the years studied. This may be attributed to CCR having higher SOD rates. Shallow reservoirs such as CCR generally experience higher HOD due to the relatively larger SOD influence (Beutel Citation2003, Gerling et al. Citation2014). Additionally, the formation of the metalimnetic minimum, in CCR, caused localized DO demand in the water column from detrital buildup in the thermocline that eventually settled into the hypolimnion. The applied oxygen flow rate to the HOS was increased to accommodate the organic loading throughout the stratified season. Higher oxygen flow rates essentially exacerbated HOD during late summer by increasing turbulence (Gantzer et al. Citation2009), which in turn effectively increased oxygen diffusion into the sediment (Bryant et al. Citation2011). Despite the seasonal increased HOD, data show volume-weighted hypolimnetic DO greater than 6.0 mg/L, with a few exceptions in 2009 and 2010. As hypolimnion DO was maintained, oxygen addition over recent years has decreased, adding approximately 300,000 kg each year from 2005 to 2010, approximately 210,000 and 130,000 kg in 2013 and 2015, respectively, while achieving volume-weighted hypolimnetic DO above 7.0 mg/L and annual average hypolimnetic DO greater than 8.0 mg/L. Maintaining the same DO in the hypolimnion while adding less oxygen suggests an overall decrease in HOD. Like SHR, CCR’s watershed is largely private, heavily wooded land that has remained unchanged to date and aside from interannual weather variability, such that decreased HOD is from changes in SOD over time and not from external factors.
Like CCR, decreased HOD was not as pronounced in NTL. The availability of data from remotely deployed DO sensors provides additional insight into decreased DO depletion rates during winter ice cover. DO demand observed by the sensors situated at different elevations within the water column represents DO depletion rates for each respective stratum. The sensor deployed 1.5 m above the sediment revealed a linear decrease in winter and spring DO depletion rates, while sensors 3.0 and 4.5 m above the bottom sediments showed no change in DO depletion rates. This may be because organic loading to the water column during winter months remained unchanged or these elevations were less influenced by SOD than by WOD. The assumption that the upper sensors were more representative of WOD is supported by the observation during initial ice cover and initial spring stratification of a decreased DO demand with increasing distance from the bottom sediments. Sensors positioned at 1.0, 0.5, and 0.1 m above the bottom would be more representative of SOD; however, these were not used because the lowest sensors (0.1 and 0.5 m) recorded anoxia quickly following ice cover. Sensors located 3.0 and 4.5 m above the bottom sediments indicate that WOD remained essentially constant. As such, over time HOS operation can result in decreasing HOD as SOD decreases, WOD remains constant, and oxygen consumption decreases.
Hypolimnetic oxygenation system operation and HOD
Numerous studies have shown HOS can substantially improve water quality if operated prior to the onset of stratification or if the system is operated year-round (McGinnis et al. Citation2004, Gantzer et al. Citation2009, Bryant et al. Citation2011, Debroux et al. Citation2012, Preece et al. Citation2019). Year-round HOS operation adds enough oxygen to maintain a target hypolimnion DO, allowing for lower applied oxygen flow rates during isothermal conditions. More importantly, year-round HOS operation requires less oxygen input at the onset of stratification as well as throughout stratification because this method never requires a recovery period to raise the DO from a depressed level. As such, less total oxygen is added throughout the year than is needed for the recovery method.
Since year-round HOS operation in SHR, the overall oxygen addition to the hypolimnion has decreased about 75%, while still maintaining hypolimnion DO in excess of 9.0 mg/L. Similarly, year-round HOS operation in CCR has resulted in a higher annual average hypolimnetic DO for the year. This was exemplified in 2006 when the HOS was shut off for 30 d. There was a much lower annual average hypolimnetic DO in 2006 compared to 2010 when the system was operated year-round, even though environmental conditions between the 2 years were similar.
Due to budget constraints at NTL it was not possible to have year-round HOS operation. Annual variations in HOS operation and subsequent water column observations from 2012 to 2015 provide a valuable lesson of the impact HOS operation has on DO depletion rates. During summer 2012 the HOS was started later than normal, but more importantly, it was operated conservatively to make sure the oxygen budget lasted through fall destratification. Due to this operational strategy, hypolimnetic DO never recovered and the hypolimnion teetered on hypoxia. Despite adding the same amount of oxygen in all years except for 2013, annual average hypolimnetic DO was approximately 2.0 mg/L lower in 2012 compared to most other years. In contrast to 2012, in 2013 the HOS was operated earlier in spring and approximately 100,000 kg more oxygen was added to the hypolimnion. Hypolimnion DO was recovered and subsequently maintained during the summer, allowing for much higher DO throughout the water column at the onset of fall destratification compared to 2012. In fall 2014 when the HOS was shut down more than a month before fall turnover, the elevated DO demand characteristic of late stratification led to hypoxia in the hypolimnion by fall turnover and depressed DO at the onset of ice cover. The impact of HOS operation through fall turnover was evident when comparing the 2013–2014 and 2014–2015 winter datasets. Following initial ice cover, linear DO depletion rates in 2013–2014 were relatively low, whereas in 2014–2015 DO depletion rates were 5 times higher than the previous year. Not only were oxygen demands higher during winter 2014–2015, but they were also substantially higher in early spring 2015. The DO depletion rate 1.5 m above the sediment in the early 2015 stratification period were nearly double for the same period in 2014.
When HOSs are not operated prior to stratification, a higher applied oxygen flow rate is often required to recover hypolimnion DO. This in turn increases HOD, largely from increased turbulence at the SWI (Beutel Citation2003, Gantzer et al. Citation2009, Bryant et al. Citation2011). A previous investigation of SHR and CCR showed HOD increased in response to applied oxygen rates (Gantzer et al. Citation2009). This was again observed in CCR as HOD increased throughout the year due in part to an increase in the applied oxygen rate to match the estimated DO demand. Enhanced turbulence in the hypolimnion is especially pronounced in lakes and reservoirs with bubble plume HOS (Singleton et al. Citation2010). This was exemplified in SHR from 2003 to 2006 when higher applied oxygen flow rates resulted in increased annual average hypolimnetic DO, but also increased HOD. Once the operational strategy was modified to reduce oxygen flows, HOD steadily decreased over time. In contrast, applied oxygen rates in NTL remained constant throughout the stratified season, but HOD still increased. This is attributed to seasonal deposition of organics from algae that die and settle into the hypolimnion from the photic zone.
Although HOS operation can increase HOD by stimulating turbulence during stratification, findings from this study show HOS operational strategies (i.e., year-round operation or prior to onset of stratification and continued through fall turnover) could help lake and reservoir managers minimize HOD and improve other water quality conditions.
Reducing HOS operational cost based on decreased HOD
When operated year-round or prior to the onset of stratification and continued through fall turnover, HOSs can decrease HOD and reduce overall long-term operational costs. This was exemplified in SHR and CCR when oxygen supplies in SHR and CCR were changed in 2017–2018 to reduce costs in part because of decreased HOD. Prior to 2017, SHR and CCR had bulk liquid oxygen (LOx) supplies, which provided a wide range of operation related to applied oxygen flow rates. This range provided the ability to add more oxygen than originally designed (e.g., adding 100 NCMH to CCR during initial testing in 2006). Over the past several years the oxygen input has steadily decreased as a result of decreased HOD. Because of the decreased HOD, both systems were modified to use a smaller, more cost-effective on-site pressure swing adsorption (PSA) technology to supply their HOS. For SHR, the LOx tank was leased for $450/month plus product at approximately $0.75/CCF (approximately $1200/fill) and was filled twice annually, totaling approximately $7800/yr. The total cost to install the PSA system was approximately $28,000. Aside from the electrical cost, which is estimated to be $2/d (2.5 Hp [1.9 kW] compressors operating 50% of the time at 8.56 ¢/kWh), the PSA upgrade has a payback period of approximately 4 yr. After 4 yr, the estimated cost to operate the SHR HOS will be $1,000/yr including maintenance, for an 85% savings.
Conclusions
Our data suggest oxygenation using a bubble plume line diffuser HOS is an effective tool for increasing and maintaining hypolimnion DO and decreasing HOD in lakes and reservoirs. The HOD decrease in 3 study sites was most pronounced when (1) an HOS was operated year-round (adjusting flow to maintain DO) compared to an oxygen recovery method, or (2) HOS operation was started prior to the onset of stratification and continued through fall turnover. Both approaches appear to provide a steady oxygen supply to the hypolimnion to promote complete oxidation of settling organics to satisfy the oxygen debt built up in the sediments. Effective HOS sizing is dependent on understanding SOD, but also needs to include intrinsic HOD increases from seasonal organic loading from the upper water column and corresponding increased turbulence as applied oxygen flow rates are increased to meet the increased seasonal HOD. Liquid oxygen supply provides greater oxygen addition capacity during the first several years of HOS operation, which can be beneficial to meet higher HOD rates than anticipated. Once HOD rates decrease or stabilize, replacing the oxygen supply with an on-site generation system, such as a PSA, may be more cost-effective. Like all systems, monitoring becomes crucial to understand water column response and changes in HOD seasonally and long term. This information can be used to better understand how different oxygen addition and mixing rates will affect the amount of oxygen that can reach the sediments and ultimately improve HOS operation.
Acknowledgments
The authors greatly appreciate the opportunity to work with both the Confederated Tribes of the Colville Reservation Fish and Wildlife Department and the Western Virginia Water Authority. Both organizations were instrumental in being able to perform this work on their lakes and reservoirs by providing watercraft to work on the water and staff to support operation of their respective systems. We also thank David Austin for his perspective comments on the article, as well as the three anonymous reviewers.
Additional information
Funding
References
- Ashley KI. 1983. Hypolimnetic aeration of a naturally eutrophic lake: physical and chemical effects. Can J Fish Aquat Sci. 40(9):1343–1359. doi:10.1139/f83-157.
- Beutel M. 2003. Hypolimnetic anoxia and sediment oxygen demand in California drinking water reservoirs. Lake Reserv Manage. 19(3):208–221. doi:10.1080/07438140309354086.
- Beutel M, Hannoun I, Pasek J, Kavanagh KB. 2007. Evaluation of hypolimnetic oxygen demand in a large eutrophic raw water reservoir, San Vicente Reservoir, Calif. J Environ Eng Ecol. 133(2):130–138. doi:10.1061/(ASCE)0733-9372(2007)133:2(130).
- Beutel MW, Horne AJ. 1999. A review of the effects of hypolimnetic oxygenation on lake and reservoir water quality. Lake Reserv Manage. 15(4):285–297. doi:10.1080/07438149909354124.
- Bierlein K, Rezvani M, Socolofsky A, Bryant L, Wuest A, Little J. 2017. Increased sediment oxygen flux in lakes and reservoirs: the impact of hypolimnetic oxygenation. Water Resour Res. 53(6):4876–4890. doi:10.1002/2016WR019850.
- Bryant L, Gantzer P, Little J. 2011. Increased sediment oxygen uptake caused by oxygenation-induced hypolimnetic mixing. Water Rec. 45(12):3692–3703. doi:10.1016/j.watres.2011.04.018.
- Davis WS, Fay LA, Herdendorf CE. 1987. Overview of USEPA/Clear Lake Erie sediment oxygen demand investigations during 1979. J Great Lakes Res. 13(4):731–737. doi:10.1016/S0380-1330(87)71687-6.
- Debroux JF, Beutel M, Thompson C, Mulligan S, Kendall D. 2012. Design and testing of a novel hypolimnetic oxygenation system to improve water quality in Lake Bard, California. Lake Reserv Manage. 28(3):245–254. doi:10.1080/07438141.2012.716501.
- Dent S, Beutel M, Gantzer P, Moore B. 2014. Response of iron, manganese and mercury in an anoxic water column to short-term hypolimnetic oxygenation. Lake Reserv Manage. 30(2):119–130. doi:10.1080/10402381.2014.898350.
- Gafsi M, Kettab A, Benmamar S, Benziada S. 2009. Comparative studies of the different mechanical oxygenation systems used in the restoration of lakes and reservoirs. J Food Agric Environ. 7(2):815–822.
- Gantzer PA, Bryant LD, Little JC. 2009. Effect of hypolimnetic oxygenation on oxygen depletion rates in two water-supply reservoirs. Water Res. 43(6):1700–1710. doi:10.1016/j.watres.2008.12.053.
- Gerling A, Brown R, Gantzer P, Mobley M, Little J, Carey C. 2014. First report on the successful operation of a side stream supersaturation hypolimnetic oxygenation system in a eutrophic, shallow reservoir. Water Res. 66:129–143. doi:10.1016/j.watres.2014.09.002.
- Higashino M, Stefan HG. 2005. Sedimentary microbial oxygen demand for laminar flow over a sediment bed of finite length. Water Res. 39(14):3153–3166. doi:10.1016/j.watres.2005.05.032.
- Jenny J, Normandeau A, Francus P, Taranu Z, Gregory-Eaves I, Lapointe F, Jautzy J, Ojala A, Dorioz J, Schimmelmann A, Zolitschka B. 2016. Urban point sources of nutrients were the leading cause for the historical spread of hypoxia across European lakes. Proc Natl Acad Sci Usa. 113(45):12655–12660. doi:10.1073/pnas.1605480113.
- Lorenzen MW, Fast AW. 1977. A guide to aeration/circulation techniques for lake management. Ecol Res Ser. EPA-600/3-77-004. US. Environmental Protection Agency.
- Matinvesi J. 1996. The change of sediment composition during recover of two Finnish lakes induced by waste water purification and lake oxygenation. Hydobiologia. 335(3):193–202. doi:10.1007/BF00018986.
- Matthews DA, Effler SW. 2006. Assessment of long-term trends in the oxygen resources of a recovering urban lake, Onondaga Lake, New York. Lake Reserv Manage. 22(1):19–32. doi:10.1080/07438140609353881.
- Matthews DA, Effler SW. 2006. Long-term changes in the areal hypolimnetic oxygen deficit (AHOD) of Onondaga Lake: evidence of sediment feedback. Limnol Oceanogr. 51(1part2):702–714. doi:10.4319/lo.2006.51.1_part_2.0702.
- McGinnis DF, Lorke A, Wüest A, Little JC. 2004. Interaction between a bubble plume and the near field in a stratified lake. Water Resour Res. 40(10). doi: 10.1029/2004WR003038.
- McQueen DJ, Lean DRS. 1984. Hypolimnetic aeration: changes in bacterial populations and oxygen demand. Archiv Fur Hydrobiologie. 9(4):498 c514.
- Mobley M, Gantzer P, Benskin P, Hannoun I, McMahon S, Austin D, Scharf R. 2019. Hypolimnetic oxygenation of water supply reservoirs using bubble plume diffusers. Lake Reserv Manage. 35(3):247–265. doi:10.1080/10402381.2019.1628134.
- Moore B. 2003. Downflow bubble contact aeration technology (Speece cone) for sediment oxygenation, remediation of contaminated sediments – 2003 Proceedings of the Second International Conference on Remediation of Contaminated Sediments, Venice, Italy. September 30.
- Moore BC, Chen PH, Funk WH, Yonge D. 1996. A model for predicting lake sediment oxygen demand following hypolimnetic aeration. J Am Water Resour Assoc. 32(4): 723–731.
- Moore BC, Cross BK, Clegg EM, Lanouette BP, Skinner M, Preece E, Child A, Gantzer PA, Shallenberger E, Christensen D, Nine B. 2014. Hypolimnetic oxygenation in Twin Lakes, WA. Part I: distribution and movement of trout. Lake Reserv Manage. 30(3):226–239. doi:10.1080/10402381.2014.908437.
- O’Neil J, Davis T, Burford M, Gobler C. 2012. The rise of harmful cyanobacteria blooms: the potential roles of eutrophication and climate change. Harmful Algae. 14:313–334. doi:10.1016/j.hal.2011.10.027.
- Preece EP, Moore B, Skinner M, Child A, Dent S. 2019. A review of the biological and chemical effects of hypolimnetic oxygenation. Lake Reserv Manage. 35(3):229–246. doi:10.1080/10402381.2019.1580325.
- Singleton V, Gantzer P, Little J. 2007. Linear bubble plume model for hypolimnetic oxygenation: full-scale validation and sensitivity analysis. Water Resour Res. 43:W02405. doi:10.1029/2005WR004836.
- Singleton V, Little J. 2006. Designing hypolimnetic aeration and oxygenation systems—review. Environ Sci Technol. 40(24):7512–7520. doi:10.1021/es060069s.
- Singleton V, Rueda F, Little J. 2010. A coupled bubble plume–reservoir model for hypolimnetic oxygenation. Water Resour Res. 46(12): 1–15. doi:10.1029/2009WR009012.
- Soltero RA, Sexton LM, Ashley KI, McKee KO. 1994. Partial and full lift hypolimnetic aeration of Medical Lake, WA to improve water quality. Water Res. 28(11):2297–2308. doi:10.1016/0043-1354(94)90045-0.
- Stefan HG, Bender MD, Shapiro J, Wright DI. 1987. Hydrodynamic design of a metalimnetic lake aerator. Journal of Environmental Engineering. 113(6):1249–1264.
