
 ?Mathematical formulae have been encoded as MathML and are displayed in this HTML version using MathJax in order to improve their display. Uncheck the box to turn MathJax off. This feature requires Javascript. Click on a formula to zoom.
Abstract
Evans ML, Kohler AE, Griswold RG, Tardy KA, Eaton KR, Ebel JD. Salmon-mediated nutrient flux in Snake River sockeye salmon nursery lakes: the influence of depressed population size and hatchery supplementation. Lake Reserv Manage. 36:75–86.
Since the 1970s, Snake River sockeye salmon (Oncorhynchus nerka) have returned in low numbers to nursery lakes in central Idaho, consequently diminishing marine-derived nutrient subsidies to freshwater spawning and rearing environments. In healthy Pacific salmon populations, returning adults generally import more nutrients than juveniles export, resulting in net positive salmon-mediated nutrient fluxes to freshwater ecosystems. To mitigate for declining sockeye salmon returns, Snake River nursery lakes have been stocked with embryos, with captive-reared juveniles and adults, and fertilized with inorganic nutrients. Here, we examine sockeye salmon-mediated nutrient flux in 3 nursery lakes, Alturas, Pettit, and Redfish, across 20 yr of study (1998–2017). In Redfish Lake, sockeye salmon-mediated nutrient flux was positive in all years when imports from the captive-rearing program were considered in our estimates. Without captive-rearing program inputs, Redfish Lake nutrient flux was positive in only 40% and 45% of years for phosphorus and nitrogen, respectively. In Alturas and Pettit lakes, nutrient export by juveniles exceeded nutrient import by adults in 67% and 56% of years for phosphorus and nitrogen, respectively. Overall, our findings suggest that a sufficient number of adult recruits relative to juvenile migrants, corresponding to a smolt-to-adult return rate > 0.78%, is needed to achieve positive salmon-mediated nutrient flux within lakes and that this will depend on both adequate population productivity and enhanced marine and freshwater habitat connectivity.
Animals influence aquatic ecosystem dynamics by storing, transporting, and releasing nutrients at times, places, and rates determined by their life history strategy and population size. At intermediate and longer temporal scales, animal populations are classified as either nutrient sources or nutrient sinks (Loreau et al. Citation2013, Vanni et al. Citation2013). In a theoretical closed system, a population is considered a nutrient sink when its uptake and storage of nutrients exceeds release through excretion and death. A population is considered a nutrient source when the reverse is true—release exceeds storage (Loreau et al. Citation2013, Vanni et al. Citation2013). Migratory animals, such as anadromous salmonid fishes, represent a modified source–sink scenario because they transport nutrients between ecosystems. Anadromous salmonids reproduce in freshwater, migrate to the marine environment to feed, and then return to their natal freshwater environment to reproduce. Thus, juveniles export nutrients during emigration from freshwater environments, while adults import nutrients when they return to reproduce (Moore and Schindler Citation2004, Scheuerell et al. Citation2005, Kohler et al. Citation2013). The difference between nutrient imports (I) and exports (E) determines whether an anadromous fish population is a net nutrient source (I > E) or sink (I < E; Loreau et al. Citation2013).
The source–sink status of anadromous fish populations has consequences for the productivity and food web dynamics of oligotrophic spawning and rearing habitats. Marine-derived nutrient (MDN) subsidies can increase ecosystem productivity (Ebel et al. Citation2014), including invertebrate biomass (Kohler et al. Citation2012) and juvenile fish production (Collins et al. Citation2016). Typically, adult Pacific salmon contribute a large influx of MDN to freshwater ecosystems that exceeds nutrient exports by juvenile outmigrants (Moore and Schindler Citation2004). However, like many migratory animals, anadromous fish populations are increasingly in jeopardy, which in some ecosystems, has resulted in a major shift in their roles from net nutrient sources to net sinks (Gende et al. Citation2002, Doughty et al. Citation2016).
Sockeye salmon (Oncorhynchus nerka) once returned in large numbers to five nursery lakes in central Idaho’s Sawtooth Valley, but experienced a precipitous decline in abundance due to commercial overharvest during the 1800s (Evermann Citation1896, Fryer Citation1995, Selbie et al. Citation2007). The following century, multiple hydropower projects and migratory barriers were constructed within the Columbia River Basin, including the former Sunbeam Dam (1911–1932), which blocked upstream migration to nursery lakes. Additionally, lake stocking with non-native fish species and eradication efforts further drove the decline and eventual extirpation of several spawning populations (Selbie et al. Citation2007, Kline and Flagg Citation2014, National Oceanographic and Atmospheric Administration (NOAA) Citation2015). Selbie et al. (Citation2007) documented a decline in nitrogen isotopes in Redfish Lake sediment cores associated with the timing of the Columbia Basin's hydropower system development and commercial harvest impacts, suggesting that MDN imports to nursery lakes declined in concert with sockeye salmon returns. However, the contemporary state of sockeye salmon-mediated nutrient transport within Sawtooth Valley nursery lakes remains unexplored.
Snake River sockeye salmon are currently undergoing intensive management to recover the species (NOAA Citation2015). Overall, these efforts have resulted in long-term datasets on sockeye salmon imports to, and exports from, nursery lakes collected by both the Idaho Department of Fish and Game (at Redfish Lake) and the Shoshone–Bannock Tribes (at Alturas and Pettit lakes). A captive-rearing program was implemented during the 1990s to counteract population declines and which involves the release of live adults for volitional spawning, in-lake egg incubation, parr releases, and smolt releases (Hebdon et al. Citation2005, Kline and Flagg Citation2014).
In this study, we quantified sockeye salmon-mediated phosphorus (P) and nitrogen (N) flux in Alturas, Pettit, and Redfish lakes using 20 yr of population monitoring and captive-rearing program release records. To evaluate the influence of contemporary management strategies on sockeye salmon-mediated nutrient dynamics, we estimated flux with and without organic nutrient additions associated with the captive-rearing program. Given the major declines in abundance in recent decades, we predicted that, in the absence of captive-rearing program releases, Snake River sockeye salmon spawning populations represent net nutrient sinks; that is, smolt outmigrants export more nutrients than adults import. We also used a historical dataset (Bjornn et al. Citation1968) to examine sockeye salmon-mediated nutrient flux in Redfish Lake during the 1950s and 1960s, prior to the intensive management efforts currently influencing population and habitat dynamics. Finally, to provide insight into the interactions between Snake River sockeye salmon population demography, recovery goals, and nutrient dynamics, we modeled relationships among freshwater productivity, smolt-to-adult survival, and sockeye salmon-mediated nutrient flux.
Study area
Alturas, Pettit, and Redfish lakes are located ∼1400 km from the mouth of the Columbia River within the Snake River subbasin, the Columbia River's major tributary (). The lakes vary in size and morphological characteristics: Redfish Lake is the largest, followed by Alturas Lake, and then Pettit Lake (). Snake River sockeye salmon typically spend 1–2 yr rearing in lacustrine environments, although the duration of lake rearing varies among spawning populations (Burgner Citation1991). Juvenile emigration from nursery lakes typically occurs in April‒May and is followed by 1–3 yr rearing in the Pacific Ocean and a return migration to spawn in their natal lake (Waples et al. Citation1991). Kokanee, the lacustrine form of O. nerka (Wood et al. Citation2008), and residual sockeye salmon, recent descendants of anadromous fish that do not exhibit anadromy (Burgner Citation1991), are also present within the lakes. Kokanee and residual sockeye salmon are known to produce anadromous juvenile emigrants, even in the absence of anadromous spawners (Bjornn Citation1968).
Figure 1. Historical Snake River sockeye salmon (Oncorhynchus nerka) nursery lakes (Stanley Lake, Redfish Lake, Yellowbelly Lake, Pettit Lake, Alturas Lake) in central Idaho. The locations of the former Sunbeam Dam in the upper Salmon River and Lower Granite Dam (solid squares), the final barrier to upstream migration on the Snake River, are indicated. The location of Sawtooth Fish Hatchery, where sockeye salmon returns to the Sawtooth Valley are enumerated and managed, is indicated by a solid triangle.
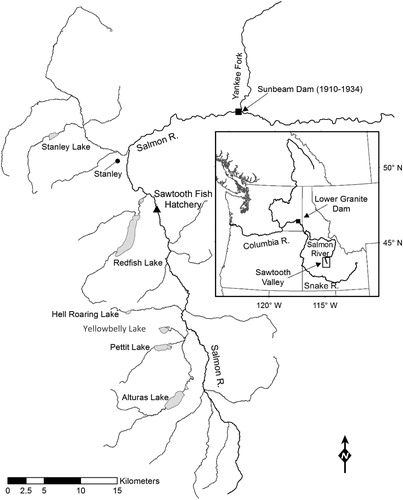
Table 1. Physical properties of Snake River sockeye salmon nursery lakes examined in this study (adapted from Gross et al. Citation1997).
Materials and methods
Contemporary nutrient imports
Sockeye salmon-mediated nutrient imports to the 3 lakes consisted of hatchery-reared parr releases, anadromous adults returning to spawn, and captive-reared adult releases. Releases of sockeye salmon parr from the captive-rearing program began in 1996 at all lakes. Salmon parr have not initiated smoltification and remain in the lake environment for at least 1 winter following their release in the summer or fall. Parr releases ceased after 2012 at Redfish Lake and after 2010 at Alturas and Pettit lakes as recovery efforts shifted toward the production of older juveniles (smolts). Nutrient contributions from hatchery smolt releases were not considered in our analyses because release locations were downstream of lake outlets.
Captive-reared adults were released to Redfish Lake beginning in 1993 and to Pettit and Alturas lakes in 1997; however, adult releases have only occurred sporadically in the latter 2 lakes because the focus of sockeye salmon recovery efforts has been at Redfish Lake (Kline and Flagg Citation2014). It is important to note that Redfish Lake adults retained for the captive-rearing program are not included in nutrient import estimates, as they are trapped and transported to the hatchery from the Sawtooth Fish Hatchery weir (). Anadromous and captive adult release records and mean anadromous and captive adults weights were taken from Johnson et al. (Citation2016) and/or provided through personal communications (D. Baker, Idaho Department of Fish and Game, personal communication).
Contemporary nutrient exports
On the outlets of Alturas, Pettit, and Redfish lakes, juvenile traps were operated annually to quantify wild/natural (hereafter, wild-born) and captive-origin smolt (i.e., that resulted from parr releases) outmigration (Kline and Flagg Citation2014). Juvenile emigrants were sampled with weirs located on Pettit Lake Creek and Redfish Lake Creek and with a rotary screw trap on Alturas Lake Creek. Juvenile emigrant abundance (±95% confidence interval [CI]) from Alturas Lake and Redfish Lake were estimated for each year using mark–recapture methods (Steinhorst et al. Citation2004, Venditti et al. Citation2017). The weir on Pettit Lake Creek was designed to capture 100% of outmigrating smolts; however, the weir can become overwhelmed during high flows and likely underestimates outmigrant abundance a few days per year. All juvenile traps were operated annually from early April through the end of May. At each of the traps, juvenile fork length (to the nearest 1 mm) and weight (to the nearest 0.1 g) was collected. Alturas and Pettit lake smolt outmigrant weight and length data are reported in . Redfish Lake smolt outmigration data were taken from Johnson et al. (Citation2016) or provided by Idaho Department of Fish and Game (E.L. Johnson, personal communication).
Table 2. Summary of sockeye salmon outmigration estimates (exports) and captive-origin adult, anadromous (anad.) adult, and captive-origin parr imports to Alturas, Pettit, and Redfish lakes by migration year.
Salmon-mediated nutrient flux calculation
We calculated salmon-mediated nutrient flux for each lake using two approaches: (1) considering all nutrient imports (anadromous adults and captive-origin adults and parr) and exports (wild-born and captive-origin outmigrants); and (2) considering anadromous adult imports and wild-born smolt exports—that is, excluding the near-term influence of captive-rearing program releases. Note that for the latter calculation, we were unable to exclude the wild-born progeny of captive adults and thus may overestimate nutrient export using this calculation, especially at Redfish Lake, which has received most of the captive-rearing program's adult releases.
We estimated salmon-mediated nutrient flux by migration year for each population as
where A is the number of anadromous adults returning to spawn in each population, M is the average mass of an anadromous adult (subscript A) or smolt outmigrant (subscript S), H is the aggregate mass of hatchery-reared individuals released into a lake, S is the number of smolts emigrating from a lake, and N is the whole-body nutrient concentration of adults or smolts. For calculation (2), all captive-origin adult and parr inputs and smolt exports were removed from the equation. For body nutrient concentration, we used wet weight P and N concentration values of 0.43% and 2.49%, respectively, for parr inputs and smolt outmigrants (Kline and Willette Citation2002, Ramseyer Citation2002) and 0.38% and 3.04% for adult inputs (Larkin and Slaney Citation1997). We also estimated nutrient flux by brood year (Moore and Schindler Citation2004); however, the results from the migration and brood year analyses were similar and thus we present the migration year analyses only. The migration year-based analysis also allowed for salmon-mediated nutrient flux estimation over a longer time series.
Error propagates in equations that include variables with independent uncertainties and is a common problem in ecosystem nutrient budget and flux estimates (Yanai et al. Citation2010). To address uncertainty around our nutrient flux estimates, we used a hybrid of bootstrapping and Monte Carlo procedures to develop 90% confidence intervals that incorporated the uncertainty associated with smolt mass (MS) and emigrant abundance (S). We ran 10,000 iterations of each lake year estimate with the mean of smolt mass values randomly sampled with replacement from all mass measurements within a year (Matthiopoulos Citation2011). To model uncertainty in our emigrant abundance estimates for Alturas and Redfish lakes, a value was drawn from a normal distribution defined by the abundance estimate with a standard deviation equal to the upper 95% confidence interval from the emigrant abundance estimate minus the abundance estimate, divided by 2 (see Campbell et al. Citation2016 for an example of a Monte Carlo approach to estimating nutrient fluxes). Flux estimates were coded in R v3.5.1 (R Core Team Citation2018).
Historical nutrient flux at Redfish Lake
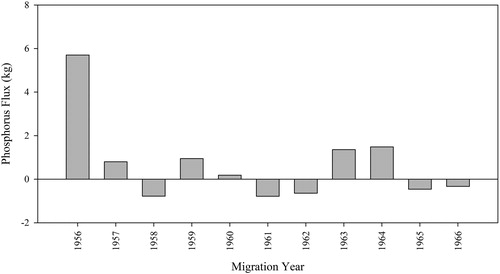
In addition to estimating contemporary nutrient flux, we used historical records of adult returns and juvenile outmigration at Redfish Lake, as published in Bjornn et al. (Citation1968), to estimate salmon-derived nutrient flux during 1956–1966. We used a length–weight regression of log10-transformed body length and body mass data collected on contemporary Redfish Lake juvenile outmigrants (2015–2017) to estimate the relationships between juvenile body length and mass (R2 = 0.74, p < 0.001, log10 weight = −4.07 + 2.48 × log10 length) using JMP v.14 (SAS Institute, Inc., Cary, NC). We applied this length–weight relationship to estimate mean juvenile sockeye salmon body mass from historical length data (see Figure 3 in Bjornn et al. Citation1968). Because adult length–weight relationships were not available, we used the mean body mass observed among anadromous Snake River sockeye salmon (1312 g), taken from Idaho Department of Fish and Game anadromous adult trapping records (Johnson et al. Citation2016, E. Johnson, personal communication), to estimate nutrient import by sockeye salmon adults during 1956–1966. Nutrient flux was then calculated by migration year as described above.
Freshwater productivity, survival, and modeled nutrient flux
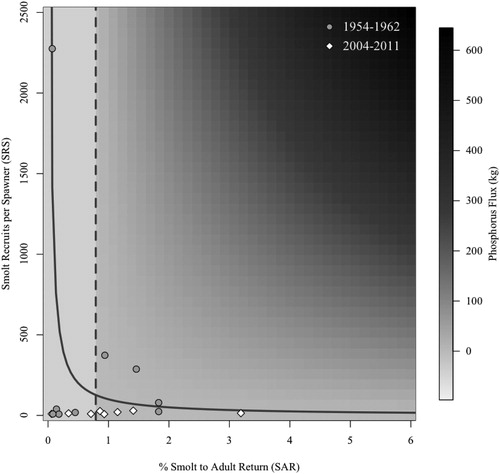
We used historical records from Bjornn et al. (Citation1968) and contemporary data from Johnson et al. (Citation2016) to examine how Snake River sockeye salmon population productivity relates to a simple model of nutrient flux driven by anadromous adult returns and freshwater production within Redfish Lake. We plotted Redfish Lake smolt recruits per spawner (SRS: number of smolts produced per adult spawner) and smolt-to-adult return rate (SAR: percent of smolts that survive to become reproductive adults) for brood years 1954–1962 (Bjornn et al. Citation1968) and brood years 2004–2011 (Johnson et al. Citation2016). We included a population replacement line, indicating where one adult recruit is produced per adult spawner, to provide context to regional recovery goals (Northwest Power and Conservation Council (NPCC) Citation2014). Using the R package “akima” (Akima et al. Citation2016, R Core Team Citation2018), a heat map representing salmon-mediated nutrient flux values for a range of SRS and SARs was included to evaluate how freshwater productivity and survival influence nutrient import and export dynamics relative to population replacement. In the nutrient flux model, we assumed a smolt weight of 9 g (a weight intermediate to that of age-1 and -2 smolts), an adult weight of 1312 g, and juvenile and adult P content as described in the preceding. As such, the P content of one returning adult equals the P content of 129 outmigrating smolts; the smolt:adult P content mass ratio of 0.78 represents a P flux equal to zero and is equivalent to the corresponding SAR.
Results
Sockeye salmon-mediated nutrient imports, exports, and net nutrient flux estimates varied considerably across lakes and years. The abundance of hatchery parr (imports) released annually to each of the lakes ranged from 0 to 26,994 at Alturas Lake, from 0 to 30,700 at Pettit Lake, and from 0 to 106,501 at Redfish Lake (). Captive and anadromous adult releases to each of the lakes (imports) ranged from 0 to 77 at Alturas Lake, from 0 to 100 at Pettit Lake, and from 0 to 2,073 at Redfish Lake (). Annual smolt outmigrant abundance (exports) ranged from 0 to 25,267 at Alturas Lake, from 1 to 46,117 at Pettit Lake, and from 3,151 to 35,871 at Redfish Lake (). Net nutrient flux estimates across lakes and years ranged from −0.54 to 0.86 and −3.12 to 5.22 for P and N, respectively, at Alturas Lake; from −2.69 to 1.28 and −15.59 to 7.44 for P and N, respectively, at Pettit Lake; and from −2.69 to 1.28 and −2.16 to 108.35 for P and N, respectively, at Redfish Lake (Tables S1 and S2).
Anadromous adult returns to the Sawtooth Valley have been limited in recent years, so captive-origin parr and adult releases accounted for the majority of salmon-mediated nutrient imports to each of the lakes (). At Alturas Lake, 97% (range: 0.7–100%) of nutrient imports were, on average, the result of captive-origin parr and adult releases. Similarly, on average, 99% (range: 0.9–100%) of nutrient imports to Pettit Lake were from captive-origin adult and parr releases. At Redfish Lake, 84% (range: 0.2–100%) of salmon-derived nutrients imported to the lake were from captive-origin parr and adult releases.
In both Alturas and Pettit lakes, juvenile outmigrants (wild-born and captive-origin) regularly exported more nutrients than were imported by anadromous adult salmon and adults and parr released from the captive-rearing program (; Tables S1 and S2). In Alturas Lake, juveniles annually exported an average of 94% (range: 4–243%) of imported P and 93% (range: 4–243%) of imported N. In Pettit Lake, an average of 184% (range: 0.01–746%) of P and 183% (range: 0.01–746%) of imported N was annually exported by juvenile outmigrants. Specifically, Pettit and Alturas lake sockeye salmon were net nutrient exporters in 10 of 17 and 12 of 19 yr, respectively (; Tables S1 and S2).
Figure 2. Sockeye salmon-mediated phosphorus (P) and nitrogen (N) flux, estimated by migration year, in 3 nursery lakes (Alturas, Pettit, Redfish) in Idaho. Net nutrient import into a lake is indicated by a positive flux and net export by a negative flux. Estimates are shown with imports and exports that include both natural and captive-origin fish (black bars) and those without captive-origin fish (gray bars) with 90% confidence intervals around the estimate. Note the differing y-axis scales among lakes and between nutrient types and that phosphorus and nitrogen budgets are shown on the left and the right of the figure, respectively.
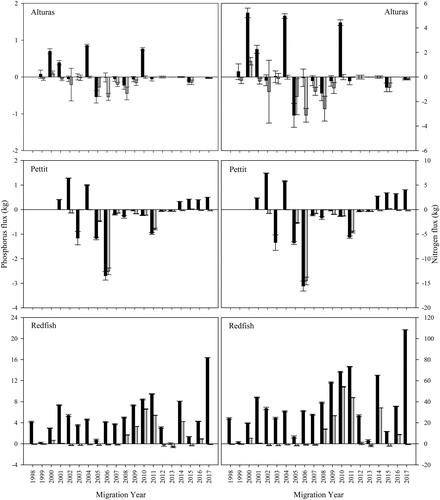
At Redfish Lake during 1998–2017, nutrient exports by sockeye salmon juveniles (wild-born and captive-origin) never exceeded nutrient imports (; Tables S1 and S2) and exports averaged 24% (range: 1 to 98%) of imported P and 20% (range: 1 to 71%) of imported N, annually. By comparison, earlier (1956–1966) salmon-mediated nutrient flux estimates for Redfish Lake using Bjornn et al.'s (Citation1968) data indicated that nutrient flux was negative in 5 of 11 yr examined (). Moreover, we estimated that juveniles exported an average of 310% (range: 11–1530%) of imported P and 224% (range: 8–1107%) of imported N from Redfish Lake, annually.
Figure 3. Net salmon-mediated phosphorus (P) flux in Redfish Lake, Idaho, 1956–1966.
In our contemporary nutrient flux estimates, sockeye salmon would have acted as net exporters of nutrients from all nursery lakes without imports from captive-reared fish (; Tables S1 and S2). When excluding captive-reared adults and parr from our nutrient flux estimates in Alturas Lake, all years except for 2000 (; Tables S1 and S2) exhibited a net salmon-mediated nutrient deficit. Similarly, in Pettit Lake, all years except 2015 experienced a net nutrient deficit without inputs from the captive program (; Tables S1 and S2). In Redfish Lake, smolts exported more P and N than adults imported in 12 of 20 and 11 of 20 yr, respectively (; Tables S1 and S2). As indicated in the methods, we were unable to differentiate between the wild-born progeny of anadromous and captive adults in this analysis, and thus our nutrient export estimates are likely biased high in some years. However, over the years, Pettit Lake has received little to no captive adult influence and has remained a net nutrient sink ().
Freshwater productivity, survival, and modeled salmon-derived nutrient flux
In 1954–1962, Redfish Lake SRS ranged from 7.8 to 2,275.4 (mean = 345.7; Bjornn et al. Citation1968), and in 2004–2011, from 7.9 to 29.4 (mean = 16.4; Johnson et al. Citation2016). The P content of one returning adult is equivalent to the P content of 129 outmigrating smolts; therefore, a smolt:adult P content mass ratio of 0.78 represents a P flux equal to zero and is equivalent to the corresponding SAR. SARs ranged from 0.07 to 1.83% (mean = 0.78%) during 1954–1962 and from 0.06 to 3.19% (mean = 1.08%) during 2004–2011. A P flux (import minus export) heat map derived from a range of SRS (0 to 2500) and SARs (0 to 6%) showed that 47% of the observed years were in net nutrient deficit (SAR < 0.78%) and 76% of the years were below population replacement. In 35% of years the demography of Redfish Lake sockeye salmon was below population replacement yet the lake exhibited a positive salmon-mediated nutrient flux ().
Figure 4. Contemporary (2004–2011) and historical (1954–1962) smolt recruits per spawner, smolt to adult return rates, and phosphorus (P) flux in Redfish Lake, Idaho. The nutrient flux model includes only anadromous adult imports and wild juvenile exports. The vertical dashed line is the demarcation between negative and positive P flux and the solid line indicates where one adult recruit is produced per adult spawner (i.e., population replacement).
Discussion
We used 20 yr of anadromous adult returns, captive adult and juvenile releases, and juvenile outmigrant data to examine contemporary and historical salmon-mediated nutrient flux in 3 Snake River sockeye salmon nursery lakes. At Redfish Lake, which received relatively large releases of captive-reared adults and parr and has been the major recipient of any returning anadromous adult sockeye salmon, nutrient flux estimates were typically positive; that is, salmon-derived nutrient imports exceeded exports. However, nutrient flux estimates for Alturas and Pettit lakes stand in stark contrast to those in Redfish Lake; both lakes have received limited nutrient imports from small releases of captive or anadromous fish, and juvenile outmigrants exported more nutrients than were imported in most years considered in this study. Moreover, our findings suggest that in the absence of captive-rearing program releases, contemporary salmon-mediated nutrient fluxes at Redfish Lake are similar to those estimated from 1955 to 1966.
In productive Alaskan populations, sockeye salmon are consistent, large-scale nutrient importers to freshwater ecosystems (Moore and Schindler Citation2004). Moreover, research on at-risk salmonid populations in Idaho and California has shown that these fishes are largely net nutrient sources (Moore et al. Citation2011, Kohler et al. Citation2013). For instance, in threatened populations of Snake River spring/summer Chinook salmon (O. tshawytscha), juveniles exported an average of 30% of parental P and 22% of parental N (Kohler et al. Citation2013), and in California coho salmon (O. kisutch), Chinook salmon, and steelhead (O. mykiss) populations, adults imported 1.6× to 10.4× more nutrients than were exported by juveniles (Moore et al. Citation2011). However, these studies also suggest that as anadromous adult salmon abundances decline, juveniles export a greater proportion of imported nutrients and that nutrient import–export dynamics are density dependent (Moore and Schindler Citation2004, Scheuerell et al. Citation2005, Moore et al. Citation2011, Kohler et al. Citation2013). Compared to other salmon systems, nutrient flux estimates in Snake River nursery lakes were comparatively small and, in Alturas and Pettit lakes, often negative (i.e., more nutrients were exported by juveniles than imported by adults and parr), reflecting their small (or nonexistent) anadromous spawning populations. Moreover, when considering anadromous imports and wild-born exports only, Redfish Lake nutrient flux was similar to estimates based on historical records (Bjornn et al. Citation1968). This suggests that contemporary salmon-mediated nutrient import/export dynamics are at least close to those of Redfish Lake prior to the population’s listing under the U.S. Endangered Species Act and that the Redfish Lake population may have acted as a nutrient sink for more than 60 yr. Gross et al. (Citation1997) developed a nutrient budget and modeled sockeye salmon-mediated nutrient flux in Redfish Lake. Using a 4% SAR and an adult return of 25,000 fish, sockeye salmon returns were estimated to contribute 17% of the overall P budget in Redfish Lake, highlighting the potential importance of salmon-derived nutrients to nursery lakes in Idaho.
Snake River sockeye salmon nursery lakes are oligotrophic, and inorganic nutrient subsidies (lake fertilization) have been used to mitigate for reduced MDN imports and enhance ecosystem productivity (Budy et al. Citation1998, Griswold et al. Citation2003). Inorganic fertilizer has similarly been used in oligotrophic sockeye salmon nursery lakes in British Columbia and Alaska (Kyle Citation1994, Stockner and MacIsaac Citation1996, Kyle et al. Citation1997, Scott et al. Citation2017) and has been shown to increase sockeye salmon biomass within lakes by up to 250% and increase adult production (Kyle Citation1994, Stockner and MacIsaac Citation1996). In addition, research by Budy et al. (Citation1998) and Griswold et al. (Citation2003) suggests that lake fertilization has the potential to increase the primary productivity and carrying capacity of Redfish Lake. Inorganic nutrients were added to Alturas and Pettit lakes in most years considered in this study and for 3 yr in Redfish Lake. While inorganic fertilizer additions may be an effective approach to mitigate for diminished salmon-derived nutrient imports, a sufficient number of adult recruits is needed to translate increases in lake primary productivity into Snake River sockeye salmon production.
A growing number of studies have shown that the decline of Pacific salmon populations may profoundly shift the role of fishes as net nutrient sources or sinks and alter the nutrient import–export dynamics of freshwater environments (Gende et al. Citation2002, Scheuerell et al. Citation2005). Similar to the findings of Gross et al. (Citation1997), our evaluations suggest that when SARs are less than the smolt to adult P content mass ratio of 0.78 (i.e., SAR < 0.78%), smolt migrants from Redfish Lake export more nutrients than adults return. This occurred in 47% of the years we evaluated. Notably, in 67% of years with a positive salmon-derived nutrient flux, the productivity of the Redfish Lake spawning population was below replacement. Our evaluation of past and current information from Redfish Lake highlights that if regional SAR goals of 4% (NPCC Citation2014) were met, adults would import more nutrients than juveniles export.
Ultimately, recovery efforts in Alturas, Pettit, and Redfish lakes depend upon a combination of sufficient freshwater productivity and SARs for the populations to be consistent net nutrient sources (Moore and Schindler Citation2004) and to remain above replacement (Petrosky et al. Citation2001). Wild salmon management that incorporates place-based policies such as terminal fisheries that support spawner escapement goals and achieve high habitat connectivity and productivity will help to recover normative salmon-derived nutrient flux and achieve meaningful population recovery (Gayeski et al. Citation2018).
Supplemental Material
Download MS Word (33.8 KB)Acknowledgments
We dedicate this article to Doug Taki, Kenneth Ariwite, and Kim Gilliland. We thank Robert Trahant and Joshua Taryole for their assistance with data collection and Paul Kusnierz, Benjamin Cross, and two anonymous reviewers for constructive comments on earlier drafts of the manuscript. We also thank Idaho Fish and Game, in particular Eric Johnson and Dan Baker, for providing adult and juvenile data from Redfish Lake.
Additional information
Funding
Related Research Data
References
- Akima H, Gebhardt A, Petzold T, Maechler M. 2016. Package “Akima” interpolation of irregularly and regularly spaced data. [accessed 2019 Jan 16]. https://cran.r-project.org/web/packages/akima.
- Bjornn T, Craddock D, Corley D. 1968. Migration and survival of Redfish Lake, Idaho, sockeye salmon, Oncorhynchus nerka. Trans Am Fish Soc. 96:360–73.
- Budy P, Luecke C, Wurtsbaugh WA. 1998. Adding nutrients to enhance the growth of endangered sockeye salmon: trophic transfer in an oligotrophic lake. Trans Am Fish Soc. 127(1):19–34. doi:10.1577/1548-8659(1998)127<0019:ANTETG>2.0.CO;2.
- Burgner RL. 1991. Life history of sockeye salmon (Oncorhynchus nerka). In: Groot C, Margolis L, editors. Pacific salmon life histories. Vancouver (BC): UBC Press. p. 1–118.
- Campbell JL, Yanai RD, Green MB, Likens GE, See CR, Bailey AS, Buso DC, Yang D. 2016. Uncertainty in the net hydrologic flux of calcium in a paired-watershed harvesting study. Ecosphere. 7(6):e01299. doi:10.1002/ecs2.1299.
- Collins SF, Baxter CV, Marcarelli AM, Wipfli MS. 2016. Effects of experimentally added salmon subsidies on resident fishes via direct and indirect pathways. Ecosphere. 7(3):e01248. doi:10.1002/ecs2.1248.
- Collins SF, Marcarelli AM, Baxter CV, Wipfli MS. 2015. A critical assessment of the ecological assumptions underpinning compensatory mitigation of salmon-derived nutrients. Environ Manage. 56(3):571–86. doi:10.1007/s00267-015-0538-5.
- Doughty CE, Roman J, Faurby S, Wolf A, Haque A, Bakker ES, Malhi Y, Dunning JB, Svenning J. 2016. Global nutrient transport in a world of giants. Proc Natl Acad Sci USA. 113(4):868–73. doi:10.1073/pnas.1502549112.
- Ebel JD, Marcarelli AM, Kohler AE. 2014. Biofilm nutrient limitation, metabolism, and standing crop responses to experimental application of salmon carcass analog in Idaho streams. Can J Fish Aquat Sci. 71(12):1796–804. doi:10.1139/cjfas-2014-0266.
- Evermann BW. 1896. A report upon salmon investigations in the headwaters of the Columbia River, in the State of Idaho, in 1895. Bulletin of the US Fish Commission. Washington, DC: US Government Printing Office.
- Fryer JK. 1995. Columbia Basin sockeye salmon: causes of their past decline, factor contributing to their present low abundance, and the future outlook [PhD dissertation]. Seattle (WA): University of Washington.
- Gayeski NJ, Stanford JA, Montgomery DR, Lichatowich J, Peterman RM, Williams RN. 2018. The failure of wild salmon management: need for a place-based conceptual foundation. Fisheries. 43(7):303–9. doi:10.1002/fsh.10062.
- Gende S, Edwards R, Willson M, Wipfli M. 2002. Pacific salmon in aquatic and terrestrial ecosystems. Bioscience. 52(10):917–28. doi:10.1641/0006-3568(2002)052[0917:PSIAAT.2.0.CO;2]
- Griswold RG, Taki D, Stockner JG. 2003. Redfish Lake sockeye salmon: nutrient supplementation as a means of restoration. Am Fish Soc Symp. 2003:197–211.
- Gross HP, Wurtsbaugh WA, Luecke C, Budy P. 1997. Fertilization of an oligotrophic lake with a deep chlorophyll maximum: predicting the effect on primary productivity. Can J Fish Aquat Sci. 54:1177–89. doi:10.1139/cjfas-54-5-1177.
- Hebdon JL, Kline P, Taki D, Flagg TA. 2005. Evaluating reintroduction strategies for Redfish Lake sockeye salmon captive broodstock progeny. Am Fish Soc Symp. 2005:401–13.
- Johnson EJ, Peterson M, Plaster K, Kruse K, Kozfkay C. 2016. Snake River sockeye salmon captive broodstock program research element. Boise (ID): Idaho Department of Fish and Game.
- Kline PA, Flagg TA. 2014. Putting the red back in Redfish Lake, 20 years of progress toward saving the Pacific Northwest’s most endangered salmon population. Fisheries. 39(11):488–500. doi:10.1080/03632415.2014.966087.
- Kline TC, Willette TM. 2002. Pacific salmon (Oncorhynchus spp.) early marine feeding patterns based on 15N/14N and 13C/12 C in Prince William Sound, Alaska. Can J Fish Aquat Sci. 59:1626–38. doi:10.1139/f02-126.
- Kohler AE, Kusnierz PC, Copeland T, Venditti DA, Denny L, Gable J, Lewis BA, Kinzer R, Barnett B, Wipfli MS. 2013. Salmon-mediated nutrient flux in selected streams of the Columbia River Basin, USA. Can J Fish Aquat Sci. 70(3):502–12. doi:10.1139/cjfas-2012-0347.
- Kohler AE, Pearsons TN, Zendt JS, Mesa MG, Johnson CL, Connolly PJ. 2012. Nutrient enrichment with salmon carcass analogs in the Columbia River basin, USA: a stream food web analysis. Trans Am Fish Soc. 141(3):802–24. doi:10.1080/00028487.2012.676380.
- Kyle G. 1994. Nutrient treatment of three coastal Alaskan lakes: trophic level responses and sockeye salmon production trends. Alaska Fish Res Bull. 1:153–67.
- Kyle GB, Koenings JP, Edmundson JA. 1997. An overview of Alaska lake-rearing salmon enhancement strategy: nutrient enrichment and juvenile stocking. In: Milner AM, Oswood MW, editors. Freshwaters of Alaska: ecological syntheses. New York (NY): Springer. p. 205–27.
- Larkin GA, Slaney PA. 1997. Implications of trends in marine-derived nutrient influx to south coastal British Columbia salmonid production. Fisheries. 22(11):16–24. doi:10.1577/1548-8446(1997)022<0016:IOTIMN>2.0.CO;2.
- Loreau M, Daufresne T, Gonzalez A, Gravel D, Guichard R, Leroux S, Loeuille N, Massol F, Mouquet N. 2013. Unifying sources and sinks in ecology and the earth sciences. Biol Rev. 88(2):365–79. doi:10.1111/brv.12003.
- Matthiopoulos J. 2011. How to be a quantitative ecologist: the A to R of green mathematics and statistics. West Sussex (UK): John Wiley & Sons, Ltd. p. 354–6.
- Moore JW, Hayes SA, Duffy W, Gallagher S, Michel CJ, Wright D. 2011. Nutrient fluxes and the recent collapse of coastal California salmon populations. Can J Fish Aquat Sci. 68(7):1161–70. doi:10.1139/f2011-054.
- Moore JW, Schindler DE. 2004. Nutrient export from freshwater ecosystems by anadromous sockeye salmon (Oncorhynchus nerka). Can J Fish Aquat Sci. 61(9):1582–9. doi:10.1139/f04-103.
- [NOAA] National Oceanographic and Atmospheric Administration. 2015. ESA recovery plan for Snake River sockeye salmon (Oncorhynchus nerka). Portland (OR): National Oceanographic and Atmospheric Administration.
- [NPCC] Northwest Power and Conservation Council. 2014. Columbia River Basin Fish and Wildlife Program. Portland (OR): Northwest Power and Conservation Council.
- Petrosky CE, Schaller HA, Budy P. 2001. Productivity and survival rate trends in the freshwater spawning and rearing stage of Snake River Chinook salmon (Oncorhynchus tshawytscha). Can J Fish Aquat Sci. 58(6):1196–207. doi:10.1139/cjfas-58-6-1196.
- R Core Team. 2018. R: a language and environment for statistical computing. Vienna (Austria): R Foundation for Statistical Computing. http://www.R-project.org/. Accessed October 2018.
- Ramseyer LJ. 2002. Predicting whole-fish nitrogen content from fish wet weight using regression analysis. N Am J Aquacult. 64(3):195–204. doi:10.1577/1548-8454(2002)064<0195:PWFNCF>2.0.CO;2.
- Scheuerell MD, Levin PS, Zabel RW, Williams JG, Sanderson BL. 2005. A new perspective on the importance of marine-derived nutrients to threatened stocks of Pacific salmon (Oncorhynchus spp.). Can J Fish Aquat Sci. 62(5):961–4. doi:10.1139/f05-113.
- Scott DC, Harris SL, Hebert AS, van Poorten BT. 2017. Nutrient dynamics in a highly managed reservoir system: considering anadromous sockeye salmon (Oncorhynchus nerka) and nutrient restoration. Lake Res Manage. 33(1):14–22. doi:10.1080/10402381.2016.1247391.
- Selbie DT, Lewis BA, Smol JP, Finney BP. 2007. Long-term population dynamics of the endangered Snake River sockeye salmon: evidence of past influences on stock decline and impediments to recovery. Trans Am Fish Soc. 136(3):800–21. doi:10.1577/T06-100.1.
- Steinhorst K, Wu Y, Dennis B, Kline P. 2004. Confidence intervals for fish out-migration estimates using stratified trap efficiency methods. J Agric Biol Environ Stat. 9(3):284–99. doi:10.1198/108571104X3325.
- Stockner JG, MacIsaac EA. 1996. British Columbia lake enrichment programme: two decades of habitat enhancement for sockeye salmon. Regul Rivers Res Manage. 12(4-5):547–561. doi:10.1002/(SICI)1099-1646(199607)12:4/5<547::AID-RRR407>3.3.CO;2-D.
- Vanni MJ, Boros G, McIntyre PB. 2013. When are fishes sources vs. sinks of nutrients in lake ecosystems? Ecology. 94(10):2195–206.
- Venditti DA, Kinzer RN, Apperson KA, Barnett B, Belnap M, Copeland T, Corsi MP, Tardy K. 2017. Effects of hatchery supplementation on abundance and productivity of natural-origin Chinook salmon: two decades of evaluation and implications for conservation programs. Can J Fish Aquat Sci. 75(9):1495–510. doi:10.1139/cjfas-2016-0344.
- Waples RS, Johnson OW, Jones RP. Jr. 1991. Status review for Snake River sockeye salmon. Portland (OR): National Oceanographic and Atmospheric Administration.
- Wood CC, Bickham JW, Nelson RJ, Foote CJ, Patton JC. 2008. Recurrent evolution of life history ecotypes in sockeye salmon: implications for conservation and future evolution. Evol Appl. 1(2):207–21. doi:10.1111/j.1752-4571.2008.00028.x.
- Yanai RD, Battles JJ, Richardson AD, Blodgett CA, Wood DM, Rastetter EB. 2010. Estimating uncertainty in ecosystem budget calculations. Ecosystems. 13(2):239–48. doi:10.1007/s10021-010-9315-8.