
Abstract
Nelligan C, Jeziorski A, Rühland KM, Paterson AM, Meyer-Jacob C, Smol JP. 2019. A multibasin comparison of historical water quality trends in Lake Manitou, Ontario, a provincially significant lake trout lake. Lake Reserv Manage. 36:243–259.
Lake Manitou, on Manitoulin Island (Ontario, Canada), is a two-basin lake that supports a natural lake trout population and currently experiences late-summer hypolimnetic oxygen concentrations below the provincial criterion set to support this sensitive coldwater fish species. However, limited direct monitoring data make it difficult to assess long-term changes in hypolimnetic oxygen concentrations, and to identify what stressors may be responsible for those changes. Dated sediment cores from each basin of Lake Manitou were used to reconstruct end-of-summer volume-weighted hypolimnetic oxygen (VWHO) over the past ∼150 years using assemblages of sedimentary chironomid remains. To assess the influence of nutrients, regional warming, and lake browning, VWHO reconstructions were compared with sedimentary diatom assemblage changes, and spectrally derived trends in both sedimentary chlorophyll a (and its main diagenetic products) and sediment-inferred lakewater total organic carbon. The chironomid-inferred VWHO reconstructions suggest that deepwater oxygen concentrations are currently lower in both basins of Lake Manitou than they were prior to the 20th century (decreasing in the late 1880s coincident with the development of Manitoulin Island by European settlers). In both basins, post-1950 diatom assemblage shifts and whole-lake primary production (sedimentary chlorophyll a) trends suggest that increased nutrient inputs and warming-related changes (i.e., enhanced thermal stability) may be contributing to the current low-oxygen conditions of Lake Manitou. In the west basin, all paleolimnological proxies underwent more pronounced (and often earlier) changes than in the east basin, an observation that suggests more targeted management strategies may be needed to protect Lake Manitou’s coldwater fish population.
Dissolved oxygen (DO) is essential to the respiration of aquatic biota. Adequate DO concentrations are of particular importance for lake trout (Salvelinus namaycush) and other coldwater fish that are largely restricted to the hypolimnia of lakes during summer stratification (Evans et al. Citation1991). Hypolimnetic DO depletion presents an emerging threat to lake ecosystems, with conditions predicted to deteriorate with the combined influence of climate warming (North et al. Citation2014) and excess nutrient inputs (Jenny et al. Citation2016). Identifying the cause of enhanced or prolonged hypolimnetic DO depletion is often complicated by the influence of multiple environmental stressors that can vary within large lake systems and result in basin-specific water chemistry and/or oxygen dynamics (Francis Citation2000, Lepori and Roberts Citation2017). As end-of-summer DO depletion is projected to worsen (Fang and Stefan Citation2009), characterizing within-lake variability and the influence of local stressors on hypolimnetic DO dynamics (particularly in complex aquatic systems) is essential to the development of effective management programs for coldwater fish.
Aquatic ecosystems are influenced by their local and regional environments, which can have direct and indirect impacts on hypolimnetic DO. For example, nutrient inputs can exacerbate DO depletion by enhancing algal production and the resulting biological demand for oxygen in the hypolimnion (Mallin et al. Citation2006). In addition, regional climate warming can enhance thermal stability (Hadley et al. Citation2014), increase the duration of thermal stratification (Stainsby et al. Citation2011), increase primary production (Paerl and Huisman Citation2008), and/or alter mixing regimes (North et al. Citation2014), all of which may result in longer and/or more severe periods of DO depletion during late summer (Stainsby et al. Citation2011, Foley et al. Citation2012). Increases in dissolved organic carbon (DOC) concentrations in lakes across Europe and North America (Monteith et al. Citation2007), commonly measured as total organic carbon (TOC), further complicate our understanding of DO dynamics. In small (<500 ha) boreal lakes, for example, increases in DOC concentrations have been associated with shallower thermocline depths (Fee et al. Citation1996, Keller et al. Citation2008), cooler hypolimnetic temperatures (Pilla et al. Citation2018), and larger hypolimnetic volumes that can facilitate more oxygenated habitat for coldwater fish (Keller et al. Citation2005). Darker colored, higher DOC lakes can exhibit enhanced thermal stability, reduced mixing, and increased oxygen consumption due to decomposition of the additional organic matter (Brothers et al. Citation2014, Couture et al. Citation2015). However, in larger lakes (with a surface area >500 ha), wind-induced mixing may be the primary driver of lake thermal structure (Fee et al. Citation1996). Therefore, effective lake management requires an understanding of the combined influences of nutrients, DOC, regional warming, and wind on hypolimnetic oxygen dynamics.
Characterizing the effects of environmental stressors on DO dynamics is often impaired by limited direct monitoring data. Paleolimnological techniques can partly address this knowledge gap by inferring past environmental conditions from indicators archived in dated lake sediment cores (Smol Citation2008). For example, chitinous remains from nonbiting midges (chironomids, family Chironomidae) can be used to track historical trends in hypolimnetic DO (Walker Citation2001) and quantitatively reconstruct average end-of-summer volume-weighted hypolimnetic oxygen (VWHO) concentrations (Quinlan and Smol Citation2001a, Citation2010). Trends in lake nutrients (e.g., Hall and Smol Citation1996) and warming-induced changes in lake thermal properties (e.g., Rühland et al. Citation2015) can be characterized using diatom assemblage composition, as these siliceous algae have reasonably well-defined optima across a variety of environmental gradients (e.g., total phosphorus (TP), pH, salinity), and respond rapidly to environmental changes (Smol and Stoermer Citation2010). In addition to morphological indicators, spectrophotometry-based models enable the reconstruction of trends in sedimentary chlorophyll a (an indicator of whole-lake primary production; Michelutti et al. Citation2010, Michelutti and Smol Citation2016) and the inference of past lakewater TOC levels from sediments (Meyer-Jacob et al. Citation2017). By using a multiproxy paleolimnological approach, we can characterize long-term trends in hypolimnetic oxygen, and the environmental variables that may influence oxygen conditions, in aquatic systems with limited monitoring data.
Here, we investigate long-term limnological trends in Lake Manitou, a large (10,618 ha) 2-basin lake that supports a natural lake trout population and a provincially significant hatchery. Between 2007 and 2011, both basins of Lake Manitou had measured mean VWHO concentrations below the provincial criterion of 7 mg/L for an Ontario lake trout lake (Evans 2007), with higher concentrations observed in the east basin than in the west basin (Ontario Ministry of Natural Resources and Forestry [OMNRF], unpublished data). As most limnological monitoring of Lake Manitou only dates back to the early 2000s, paleolimnological techniques can provide information on long-term environmental trends in both basins of the lake. We use sedimentary chironomid assemblages to infer historical trends in VWHO and to determine whether low end-of-summer VWHO is a common occurrence or a recent phenomenon. We also use sedimentary diatom assemblages, spectrally inferred chlorophyll a (which includes its main diagenetic products), and sediment-inferred lakewater TOC to characterize the role of nutrient loading, regional warming, enhanced primary production, and lake browning on oxygen dynamics in both basins. The current differences in oxygen conditions between Lake Manitou’s 2 basins (east more oxic than the west) present an opportunity to compare environmental trajectories between basins, and assess whether they have responded in similar ways to the local and regional stressors affecting lake trout habitat quality.
Study site
Manitoulin Island (Ontario, Canada) separates Lake Huron from Georgian Bay and is the largest freshwater island in the world. The island falls within the traditional territory of the Odawa and Anishinaabe (Surtees Citation1986) and is currently home to the M'Chigeeng, Sheguiandah, Sheshegwaning, Zhiibaahaasing Aundeck Omni Kaning, and Wikwemikong First Nations and the Wikwemikong Unceded Territory. The settlement of Manitoulin Island by Europeans occurred in 1862 (Chapman and Putnam Citation1984) and was followed by rapid population growth during the late 1800s, increasing from ∼2200 people in 1871 to ∼11,300 people in 1911 (Hoffman et al. Citation1959). By the late 1950s, 40% of the island had been converted to farmland (Hoffman et al. Citation1959), with most of the agricultural land used to raise cattle (Bonneville Citation1989). In 2016, there were ∼13,200 permanent residents on Manitoulin Island (Statistics Canada Citation2017), although the population is likely higher during summer months due to cottagers and tourism.
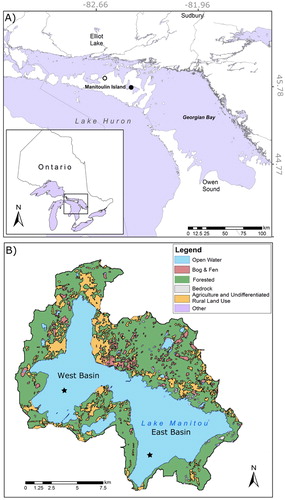
There are 70 lakes on Manitoulin Island that are over 0.5 km in length (Harvey Citation1978). However, Lake Manitou (45°45′51′′N, 81°57′45′′W; ) is the largest and deepest lake (), and the only lake on the island that currently supports a lake trout population (OMNR 2006). The Lake Manitou watershed drains an area of ∼274 km2 and is underlain by limestone bedrock with a variety of surficial deposits including organic soil, loam till, and lacustrine clay and silt (Hoffman et al. Citation1959). The lake is alkaline (pH 8.3), with a surface area of 106.2 km2, and 2 distinct depositional basins (the east basin has a maximum depth of 54 m and the west basin has a maximum depth of 35 m). Excluding the surface area of the lake itself, forests cover 76% of the watershed, with the remaining lands classified as agricultural or undifferentiated rural land use (17%), and a small area classified as wetland (4%; OMNRF Citation2018). Most agricultural land surrounding the lake is concentrated along the shoreline of the west basin (. Water flows in the lake from the west basin to the east basin before entering the Manitou River at its outflow. The east basin is separated from the Manitou River by a small dam that was initially constructed during the late 1800s and rebuilt in 1929, 1950, and 1961 (EGA Consultants Citation2001).
Figure 1. (A) Location of Manitoulin Island, Lake Manitou (denoted by the black circle), and the Gore Bay climate station (denoted by the white circle) in Ontario, Canada. (B) Major land-use types within the Lake Manitou watershed. Stars indicate coring locations within the east and west basins.
In addition to lake trout, Lake Manitou supports a diverse community of 27 fish species, including brook trout, lake whitefish, northern pike, and smallmouth bass (Harvey Citation1978). Fish from Lake Manitou are used to support the Blue Jay Creek Fish Culture Station, a hatchery located ∼3 km from the lake that rears a variety of fish species (including lake trout) for stocking hard-water inland lakes throughout Ontario (Kerr and Lasenby Citation2001). To sustain its own recreational fishery, Lake Manitou has been stocked since the 1950s with lake trout reared at the Blue Jay Creek hatchery (Ontario Ministry of Natural Resources and Forestry [OMNRF] 2016 Aug, unpublished data).
Most water quality data available for Lake Manitou are relatively recent (i.e., the early 2000s), with the exception of Secchi disk transparency measures (herein referred to as Secchi depth) that date back to the 1990s. Temperature–oxygen profiles measured in late summer from 2007 to 2011 documented average VWHO concentrations of 6.5 mg/L in the east basin and 2.6 mg/L in the west basin (OMNRF, unpublished data).
Materials and methods
Climate and water chemistry monitoring data
Mean annual air temperature (MAAT) and seasonal air temperature data from ∼1916–2017 were used to assess the influence of regional climate warming on Lake Manitou. The Gore Bay climate station (45°55′N, 82°28′W), located ∼30 km northwest of the lake, is the closest meteorological station with the longest and most complete temporal record (with one notable gap in its record, 1928–1934). Temperature data were obtained from Environment and Climate Change Canada Adjusted and Homogenized Climate Data (ECCC 2018). Linear regressions of the MAAT and seasonal air temperature data were used to determine the total temperature change from the start to the end of the instrumental temperature record.
Secchi depth and TP concentration data for Lake Manitou were obtained from Ontario’s Lake Partner Program, a network of citizen scientists run by the Ontario Ministry of the Environment, Conservation and Parks (MECP) that collectively monitors ∼550 lakes across Ontario. Monitoring of both basins began in 1995 for Secchi depth and in 2002 for TP. Between May and September, Secchi measurements were taken once or twice a month and composite water samples were collected monthly from the Secchi depth to the lake surface for TP analysis. Water chemistry data were also collected from both basins of the lake during sediment core collection (composite water samples collected from twice the Secchi depth to the lake surface) and are summarized in . The available monitoring data were used to characterize the current limnological conditions of Lake Manitou for comparison with paleolimnological inferences.
Table 1. Water chemistry data collected from Lake Manitou’s east basin in June of 2015 and the west basin in August of 2016. Samples were collected from approximately 2 times the Secchi depth (east basin Secchi = 4.8 m; west basin Secchi = 7.2 m) and were analyzed by the Ontario Ministry of the Environment, Conservation and Parks laboratory at the Dorset Environmental Science Centre.
Paleolimnological methods
In June 2015, a 24-cm-long sediment core was collected from the east basin of Lake Manitou, and in August 2016, a 40-cm-long sediment core was collected from the west basin. We aimed to retrieve both cores as close to the deepest point in each basin as possible, so that the sediments were representative of basin-wide conditions (. The west basin was cored at a lake depth of ∼32 m and the east basin was cored at a depth of ∼40 m (on a flat plateau adjacent to the 50 m bathymetric contour). The sediment cores were collected from each basin using a Glew (Citation1989) gravity corer and sectioned on-site into 0.5-cm contiguous intervals using a Glew (Citation1988) extruder.
The sediment cores were 210Pb dated using gamma spectroscopy following the methods outlined in Schelske et al. (Citation1994). Briefly, for gamma analysis, ∼0.5–1.5 g of freeze-dried sediment from ∼20 selected intervals was placed into plastic tubes that were sealed with 2-ton epoxy. Age determination was based on unsupported 210Pb activity, and a constant rate of supply model (CRS) was applied to determine sediment age (Appleby Citation2001). Ages between CRS dates were interpolated using a linear fit between consecutive intervals, and age estimates beyond background 210Pb concentrations were extrapolated using a second-order polynomial fit.
Sedimentary material was processed for chironomid and chaoborid remains following the procedure described in Walker (Citation2001). In brief, ∼3–10 g of wet sediment per interval was deflocculated using 5% KOH (catalyzed by heating the sediment–KOH solution on a hotplate for ∼20 min) and sieved through a 100-μm mesh. Using a Bogorov tray, chaoborid remains and a minimum of 40 chironomid head capsules were hand picked out of the sieved solution for identification (Quinlan and Smol Citation2001b). Subfossils were transferred onto cover slips and permanently mounted onto slides with Entellan. Taxonomic identification was performed under 200–400× magnification microscopy using Brooks et al. (Citation2007) and Wiederholm (Citation1983) for chironomid identification and Uutala (Citation1990) for chaoborid identification. For intervals with insufficient head capsules present to obtain the minimum count of 40, chironomid assemblage data from the closest adjacent interval in age were combined.
Diatom preparation followed the methods outlined in Rühland and Smol (Citation2002). A 50:50 molar ratio of concentrated sulfuric and nitric acid was used to digest the organic material of ∼0.02 g of freeze-dried sediment for each sediment interval. Samples were heated in an ∼80 C hot water bath for 2 h to catalyze the reaction. Acidic diatom slurries were rinsed with deionized water until neutral pH was achieved (allowing ∼24 h between rinses to allow diatoms to settle). Dilutions of the resulting diatom slurry were plated onto cover slips and permanently mounted to slides using Naphrax. Diatoms were counted using a Leica DMR microscope fitted with differential interference contrast optics, using oil immersion objective and condenser lenses at 1000× magnification. For each interval, at minimum, ∼400 valves were counted over at least 2 transects of the cover slip. Diatoms were identified to the lowest achievable taxonomic resolution using a variety of taxonomic references, including Krammer and Lange-Bertalot (Citation1986, Citation1988, Citation1991a, Citation1991b), Camburn and Charles (Citation2000), and Reavie and Kireta (Citation2015).
Sediment-derived inferences of both sedimentary chlorophyll a and lakewater TOC were generated using spectral analyses following the methods outlined in Michelutti et al. (Citation2010) and Meyer-Jacob et al. (Citation2017), respectively. A FOSS NIR System Model 6500 rapid content analyzer was used to analyze spectral absorbance between 400 and 2500 nm on a small amount of sieved, freeze-dried sediment from each interval. Trends in sedimentary chlorophyll a are an indicator for changes in whole-lake primary production and were inferred by visible range spectroscopy (VRS) using the chlorophyll a absorbance peak between 650 and 700 nm and the algorithm presented in Michelutti et al. (Citation2010). The electromagnetic spectrum range used in this model also encompasses the absorbance regions of the main diagenetic products of chlorophyll a (pheophytin a and pheophorbide a), and thus largely incorporates diagenesis of chlorophyll a within the sediments. A partial least squares regression model between spectral information of surface sediments and corresponding surface-water TOC concentrations from 345 lakes (R2 = 0.57) was applied to the full visible–near-infrared spectrum (400–2500 nm) to infer past trends in lakewater TOC concentrations from the sediment (model prediction error = 4.4 mg/L; Meyer-Jacob et al. Citation2017).
All data analyses were performed using the R software environment (R Core Team Citation2017). Prior to analysis, the diatom and chironomid count data from each sediment interval were converted to percent relative abundance (i.e., for each taxon, the number of diatom valves or chironomid head capsules enumerated was divided by the total number of valves or head capsules counted). Constrained incremental sum of squares (CONISS; Grimm Citation1987) and broken stick models (Bennett Citation1996) were applied to the downcore relative abundance data to identify important zones of change within the downcore assemblages. Chironomid and chaoborid assemblage data were used to reconstruct end-of-summer VWHO using the model developed by Quinlan and Smol (Citation2001a, Citation2010). The VWHO model has a jackknifed R2 of 0.6 and a root mean square error of prediction of 1.98 mg/L. This model uses chironomid and chaoborid relative abundance data from 54 south-central Ontario lakes to quantify VWHO with weighted averaging with tolerance downweighting and inverse deshrinking. The VWHO reconstruction for each sediment interval was validated using analog matching to ensure that the downcore chironomid assemblages were appropriately represented in the calibration set (Simpson Citation2012). Analog matching compares downcore and calibration set assemblages using Bray–Curtis dissimilarity coefficients. Dissimilarity cutoffs were used to determine whether each downcore chironomid assemblage had a “good” analog to chironomid assemblages in the calibration set. Downcore intervals were considered “poor” analogs to the calibration set if they had a minimum dissimilarly coefficient greater than the 10th percentile of the distribution of dissimilarity coefficients between calibration set samples only. Reconstructed values of VWHO for intervals with “poor” analogs to the calibration set should be interpreted with caution. Given that Lake Manitou is 6× larger in surface area than the largest lake in the Quinlan and Smol (Citation2001) calibration set, high dissimilarity between downcore assemblages and calibration set assemblages was anticipated (as the relative abundances of profundal and littoral chironomid taxa would likely differ). To address this, qualitative trends in the chironomid assemblage data were compared against the VWHO reconstruction to assess whether the reconstruction was appropriate.
Results
Climate records and water chemistry trends
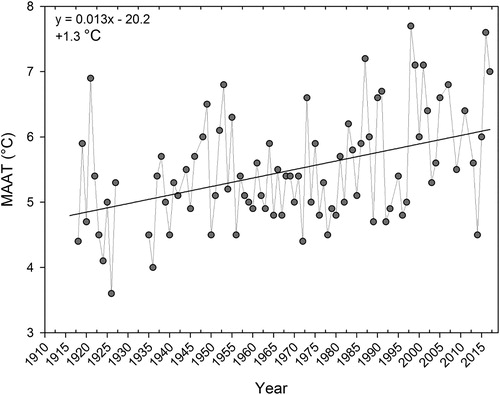
The instrumental records for spring, summer, and fall air temperature extend from 1916 to 2017, and the instrumental records for winter air temperature and MAAT extend from 1918 to 2017. Between 1918 and 2017, MAAT on Manitoulin Island increased by ∼1.3 C (). Air temperature increases were not uniform across seasons, with warming occurring at a slower rate during the summer compared to the winter, spring, and fall. Average air temperatures increased by ∼1.3 C during the summer, compared to ∼1.6 C during the other seasons (Supplementary material, Figure S1).
Figure 2. Mean annual air temperature (MAAT) from the Gore Bay climate station located ∼30 km from Lake Manitou. Linear regression was applied to the temperature data and the equation of the linear fit as well as the total increase over the monitoring record are noted. Air temperature data were acquired from Environment and Climate Change Canada and have been adjusted and homogenized to account for procedural and instrument changes over the monitoring record.
Modern measures of lakewater TP are generally higher in the west basin of Lake Manitou than in the east basin. While both basins are on average oligotrophic (), TP concentrations occasionally increase above the 10 μg/L oligo-mesotrophic threshold (CCME 2004). There was no directional trend in mean annual TP or monthly TP in either basin over the monitoring period (2002–2016; ). However, monthly TP measurements have only been collected consistently from 2009 until 2017. During this period TP concentrations in both basins were generally highest in May and October (Supplementary material, Figure S2).
Figure 3. Secchi depth measurements (left) for the east and west basins of Lake Manitou from 1994–2017. Secchi depth measures were collected once or twice a month and averaged over each year. Total phosphorus (TP) measurements (right) from the east and west basin collected monthly during May to October from 2002 to 2017. These data were collected through the Ontario Lake Partner Program with analysis for TP conducted on composite water samples collected from the Secchi depth.
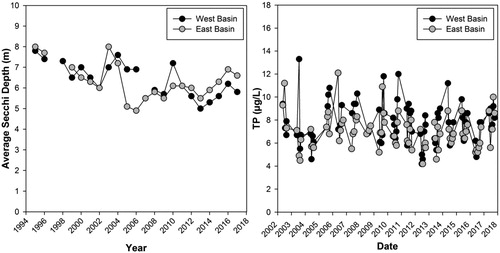
Secchi measures were generally consistent between the east and the west basins. Between 1995 and 2017, the east basin had an average Secchi depth of 6.3 m and the west basin had an average Secchi depth of 6.5 m. Each basin experienced a similar decrease in Secchi depth over the monitoring period, decreasing by ∼2 m ().
Paleolimnological analyses
Radioisotopic dating
In the east and west basins, 210Pb activity decayed exponentially to below 214Pb activity (used as a proxy for “background” 210Pb concentrations) in the top 2.5 cm of the 24-cm-long east basin sediment core (representing a date of 1936) and in the top 32 cm of the 39.5-cm west basin core (representing a date of 1869; Supplementary material, Figure S3). Sedimentation rates differ markedly between basins, as ∼80 years is captured in the upper 2.5 cm of sediment in the east basin core and ∼150 years is captured in the upper 32 cm of sediment in the west basin core (Supplementary material, Figure S3). To estimate dates during the pre-European period, a second-order polynomial was used to extend date estimates to the ∼1850s for both sediment cores. Thus, despite the difference in temporal resolution between the east and west basins, the analyses span roughly the same time period.
Chironomid assemblage data and VWHO reconstruction
The chironomid assemblages from both basins of Lake Manitou () were predominantly composed of profundal taxa such as Chironomus spp., Heterotrissocladius spp., Micropsectra spp., Procladius, Protanypus, and Sergentia species (Brooks et al. Citation2007). Littoral chironomid taxa such as Dicrotendipes nervosus, Paratendipies nudisquama, Endochironomus, and Tanytarsus spp. (Brooks et al. Citation2007) were also present, although they occurred in lower relative abundances in both basins (.
Figure 4. Downcore percent relative abundance data for diatom and chironomid taxa that occurred in >5% in at least 2 intervals in the sediment cores from the east basin (A) and the west basin (B). Diatoms and chironomid data are plotted against core depth (interval midpoint) and 210Pb date generated using a constant rate of supply (CRS) model. For the east basin, dates earlier than ∼1936 have been extrapolated, and for the west basin, dates earlier than ∼1870 have been extrapolated; extrapolated dates should be viewed with caution and are noted with an asterisk (*). Date extrapolations for both cores were performed using a second-order polynomial. To help visualize trends, species were grouped into complexes if they had similar ecological characteristics and experienced similar trends through time. The number of taxa within each complex is noted in the brackets that follow each taxonomic grouping. For both basins, the small cyclotelloid complex included Lindavia comensis, L. gordonensis, L. michiganiana, L. ocellata, L. radiosa, Cyclotella cyclopuncta, C. tripartita, and Discostella stelligera. The benthic fragilarioid complex included Staurosirella pinnata, Staurosira construens, and Pseudostaurosira brevistriata. In the east basin, the Stephanodiscus complex included Stephanodiscus medius, S. niagarae, and S. minutulus. Horizontal gray lines divide important groupings within the downcore assemblage data that were identified by CONISS and broken stick analyses.
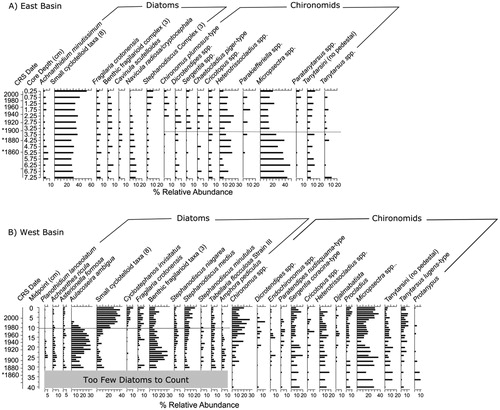
The broken-stick analysis identified 2 important zones within the CONISS dendrogram of the east basin chironomid assemblage data (before and after ∼1900; . The pre-1900 east basin chironomid assemblages were dominated by Micropsectra spp. (M. radialis and M. insignilobus), representing ∼26–48% of the species assemblage during this time (. The ∼1900 chironomid assemblage shift was characterized by a decrease in the relative abundance of Micropsectra spp. during the late 1800s and a corresponding increase in relative abundances of Chironomus plumosus, Dicrotendipes spp., Sergentia spp., Chaetocladius piger-type, Parakiefferiella spp., and Paratanytarsus spp. that started between ∼1900 and ∼1950.
The chironomid assemblages of the west basin () have experienced more pronounced changes than those in the east (), although the broken stick model did not identify any important zonations in the CONISS cluster analysis performed on the downcore assemblage data. Similar to the east basin, the highest relative abundances of Micropsectra spp. occurred before 1880, with Protanypus also present in notable abundances from the mid to late 1800s (∼1850 to ∼1880). Micropsectra spp. decreased in relative abundance during the early 1900s, with Chironomus anthracinus and C. plumosus (grouped as Chironomus spp. in ) first appearing in the west basin sedimentary record in notable abundances during the ∼1880s and increasing until the 1990s. In addition, Dicrotendipes spp., Paratendipies spp., and Endochironomus spp. all underwent an increase in relative abundance from ∼1900 to the 1990s. After the 1990s, Micropsectra spp. returned to pre-1900 abundances and Chironomus spp. decreased in relative abundance.
Analog matching analysis performed on the downcore chironomid assemblage data revealed that chironomid assemblages in the calibration set were, on average, 47% and 40% dissimilar to downcore chironomid assemblages in the east and west basins, respectively (Supplementary material, Figures S4 and S5). Most downcore intervals (except for one interval in the east basin and four intervals in the west basin) had poor analogs to the calibration set. Therefore, we emphasize the general trends in reconstructed VWHO over time, but caution against interpretation of the quantitative values produced by the model. Reconstructed chironomid-inferred (CI) VWHO values were standardized to Z-scores to emphasize overall trends in CI-VWHO, with both basins experiencing similar decreases in hypolimnetic oxygen after 1880 (. The reconstructed VWHO values and the number of chironomids counted for each sediment interval are presented in Table S1 (Supplementary material).
Figure 5. (A) Trends in visible–near-infrared spectroscopy (VNIRS) inferred lakewater total organic carbon (TOC) concentrations, chironomid-inferred volume-weighted hypolimnetic oxygen (CI-VWHO) concentration, visible range spectroscopy (VRS) inferred sedimentary chlorophyll a (and its main diagenetic products) concentrations, percent relative abundance of small cyclotelloid taxa (including Lindavia comensis, L. gordonensis, L. michiganiana, L. ocellata, L. radiosa, Cyclotella cyclopuncta, C. tripartita, and Discostella stelligera), and percent relative abundance of Cyclostephanos and Stephanodiscus taxa (including S. medius, S. niagarae, and S. minutulus in the east basin and S. medius, S. niagarae, S. minutulus, and C. invisitatus in the west basin). The east basin is depicted in gray circles and the west basin is depicted in black circles. Data have been plotted against the 210Pb dates generated by the constant rate of supply (CRS) model. Dates past background 210Pb activity (1936 in the east basin and 1870 in the west basin) have been extrapolated using second-order polynomials for both basins and should be interpreted with caution. (B) Plots depict the same data standardized using Z-scores to better assess directional trends in each variable. To aid in the visualization of trends, a Z-score value of 0 is marked on each plot by a vertical gray line.
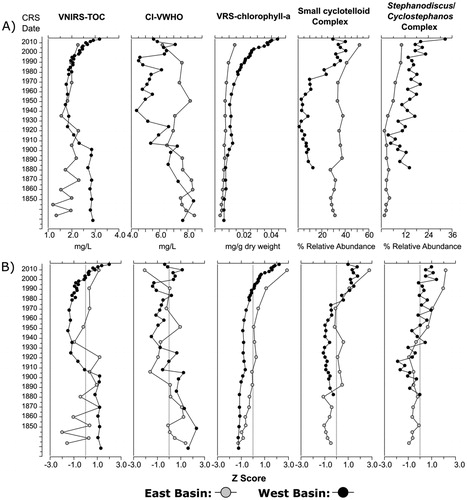
Over the entire east basin sedimentary record CI-VWHO ranged from ∼6.0 to 8.5 mg/L, spanning a greater range than the 1.9-mg/L error of the VWHO model (. CI-VWHO decreased during the 1880s, following the decrease in Micropsectra relative abundance (VWHO optimum = 6.0 mg/L; Quinlan and Smol Citation2001a), but subsequently increased after ∼1950 (associated with decreases in Sergentia spp. and Dicrotendipes spp. that have VWHO optima of 5.2 and 4.1 mg/L, respectively; Quinlan and Smol Citation2001a). A second decrease in CI-VWHO occurred from ∼1950 until the present day, with the top-most sediment interval (1997–2015) having the lowest reconstructed VWHO (.
In the west basin CI-VWHO encompassed a greater range than the root mean square error of the VWHO model and underwent several directional changes (from 4.4 mg/L to 8.7 mg/L) over the sedimentary record (. Similar to the trends observed in the east basin, CI-VWHO decreased in the 1880s following a decline in the relative abundance of Micropsectra spp. and Protanypus (VWHO optima of 6.0 mg/L and 7.7 mg/L, respectively; Quinlan and Smol Citation2001a). However, unlike the chironomid data from the east basin, CI-VWHO in the west basin remained low between ∼1900 and ∼2000 (relative to pre-1900 conditions), as Chironomus spp., Dicrotendipes spp., Paratendipies spp., and Endochironomus spp. (which all have lower VWHO optima than Micropsectra spp.; Quinlan and Smol Citation2001a) were present in higher relative abundances. Interestingly, CI-VWHO increased post-2000 following the increase in Micropsectra spp. and a corresponding decrease in Chironomus species. Although a slight increase in CI-VWHO was observed after 2000, it is important to note that in the west basin, CI-VWHO remained below pre-1900 conditions.
Diatom data
Planktonic diatom taxa were present in high relative abundances in both the east and the west basin sediment cores. In the east basin, diatom assemblages were predominantly comprised of small cyclotelloid taxa, specifically Lindavia comensis (∼20–40% of the species assemblage throughout the entire sediment core). All other diatom taxa in the east basin occurred at less than ∼10% relative abundance (. The west basin’s diatom assemblages () were more diverse and predominantly comprised of small cyclotelloid taxa (specifically Lindavia comensis with smaller contributions of L. michiganiana, L. ocellata, L. radiosa, Cyclotella cyclopuncta, C. tripartita, and Discostella stelligera), taxa indicative of nutrient enrichment (e.g., Cyclostephanos invisitatus, Fragilaria crotonensis, Stephanodiscus medius, and Stephanodiscus niagarae), Aulacoseria ambigua, and benthic fragilarioid taxa (e.g., Staurosirella pinnata, Staurosira construens and Pseudostaurosira brevistriata).
Diatom changes in the east basin were subtle compared to the west basin. In the east basin, the broken stick analyses identified no important zones in the diatom stratigraphy (likely due to the subtle and gradual changes between taxa). For instance, in ∼1950, the diatom assemblage underwent a minor ∼6% decrease in Navicula radiosa and Navicula cryptocephela () with a corresponding ∼6% increase in Stephanodiscus taxa (S. minutulus, S. medius and S. niagarae). The largest change in the east basin diatom assemblages was a 2-step increase in small cyclotelloid taxa over the sedimentary record, increasing by ∼7% in the late 1880s and a further ∼15% in the topmost sediment interval.
Diatom assemblages in the west basin sediment core experienced a shift that was more pronounced and occurred later relative to the east basin. The broken stick analysis identified 2 important CONISS groupings within the stratigraphy marked by a change in the assemblage composition during the mid-1970s, where there was a sharp decrease in the relative abundance of A. ambigua (representing ∼20–40% of the pre-1975 diatom assemblage and decreasing to undetectable levels thereafter). Post 1975, small cyclotelloid taxa increase from <5% relative abundance to 15–30% relative abundance. Taxa with relatively higher nutrient optima, based on the Reavie and Smol (Citation2001) diatom-based TP transfer function, occurred in higher abundances in the west basin core compared to the east basin core, and also increased over the sedimentary record. For instance, the increase in S. medius was relatively gradual and occurred post 1920 (); however, the increase in Cyclostephanos invisitatus was abrupt, first appearing in the sedimentary record in notable abundances post 1975. Interestingly, diatom valves were scarce in the west basin before ∼1880 and a full count of ∼400 diatom valves was not attained in the sedimentary intervals before this period. There was no clear evidence of diatom dissolution in the sediments before ∼1880, although the small numbers of valves that were found were highly fragmented.
Sedimentary spectral analyses
In the east basin, spectrally-inferred sedimentary chlorophyll a (hereafter referred to as VRS-chlorophyll a) was relatively stable and low for most of the sedimentary record, but increased in the topmost sediment interval (representing 1997–2015; ). The west basin VRS-chlorophyll a profile underwent an exponential increase starting in the mid 1900s that has continued to the present day (). The similarity between the trajectories in whole-lake primary production between basins was apparent when VRS-chlorophyll a was standardized to Z scores (.
In the west basin, sediment-inferred lakewater TOC concentrations (hereafter referred to as inferred lakewater TOC) were relatively stable from the early 1800s to ∼1900, decreased until the mid 1900s, and rebounded during the late 1900s, with concentrations increasing to above background (∼1820–1900) levels in the top 2 sediment intervals (2014–2016). Changes in inferred lakewater TOC in the east basin were more subtle than in the west basin, undergoing a muted decrease during the early 1900s. The increase after the mid 1900s, which occurred in the west basin, was not observed in the east basin (.
Discussion
Chironomid-inferred hypolimnetic oxygen
The CI-VWHO trends in Lake Manitou indicate that oxygen concentrations in both basins are currently lower than they were prior to ∼1900. The reductions in CI-VWHO in the late 1800s coincide with European settlement and the subsequent population increase on Manitoulin Island from the late 1800s to the early 1900s (Hoffman et al. Citation1959). The impact of European settlement (i.e., logging and the associated changes in land use) is not always clearly expressed in paleolimnological records and is highly variable (Dubois et al. Citation2018), but has been associated with reduced CI-VWHO in other studies (e.g., Clerk et al. Citation2000, Francis Citation2001). In the Lake Manitou sediment record, there is no clear directional change in any of the paleo-proxies (diatoms, VRS-chlorophyll a, inferred lakewater TOC) during this time period, making it difficult to understand the mechanism driving reduced oxygen conditions after initial settlement. For instance, neither the diatom record nor the VRS-chlorophyll a profiles from either basin suggest an increase in nutrients during the late 1800s (although evaluation of nutrient conditions in the west basin prior to the late 1800s was impaired by low diatom abundances before ∼1880). Thus, the mechanism behind decreasing CI-VWHO during this period remains unclear.
Both basins underwent similar directional trends in CI-VWHO (), with the most notable difference being a slight increase in CI-VWHO in the west basin after ∼2000 (although CI-VWHO concentrations after ∼2000 remain lower than they were prior to 1900). Although oxygen conditions may have improved slightly in the west basin, recent monitoring data suggest that present-day VWHO conditions are hypoxic (VWHO was 2.8 mg/L and 2.5 mg/L in 2009 and 2011, respectively). The east basin did not exhibit the same increase in CI-VWHO after ∼2000; however, evidence of change in CI-VWHO in the east basin may be muted by the slow rate of sedimentation, as the topmost sediment interval represents ∼20 years. In addition, the east basin only has 4 years of end-of-summer VWHO monitoring data, with no pre-2000 sampling (2007 VWHO = 6.7 mg/L, 2009 VWHO = 6.3 mg/L, 2010 VWHO = 6.9 mg/L and 2011 VWHO = 6.1 mg/L), making it difficult to assess directional trends in VWHO from the modern limnological data. Therefore, continued limnological monitoring is required to assess whether the slight increase in VWHO will continue, and whether it is unique to the west basin.
Interestingly, recent increases in measured VWHO have also been observed in other south-central Ontario lakes (Nelligan et al. Citation2019). These trends have been attributed to increases in both hypolimnetic DO concentrations (most strongly associated with reductions in TP and primary production) and hypolimnetic volume (most strongly associated with increasing DOC; Nelligan et al. unpubl. data). However, increasing hypolimnetic DO concentrations associated with reduced trophic status are likely not occurring in Lake Manitou, as the diatom assemblage compositional changes suggest nutrient concentrations have likely increased (unlike south-central Ontario lakes located on the Precambrian Shield; Eimers et al. Citation2009). Increases in CI-VWHO post 2000 may be associated with changes in hypolimnetic volume; however, this is difficult to confirm. Although the slight increase in CI-VWHO observed in the west basin is coincident with increasing trends in inferred lakewater TOC post-1990 (concentrations have recently surpassed pre-1900 levels; ), changes in lake thermal structure associated with the influence of DOC on water transparency may be less important than the influence of wind mixing in such a large lake (Fee et al. Citation1996). Wind data collected at the Gore Bay climate station suggest that average wind speeds have decreased since the 1950s, although trends were not significant across all seasons (Supplementary material, Figure S6). Continued limnological monitoring will be important to determine the ongoing effects of changing lake water transparency and wind speeds on the VWHO concentrations in Lake Manitou.
Understanding the potential influences from nutrient enrichment, regional warming, enhanced primary production and browning
The changes in sedimentary diatom assemblages suggest that Lake Manitou is responding to both nutrient inputs and changes in lake thermal stability. Diatom taxa with mesotrophic to eutrophic nutrient optima (e.g., Cyclostephanos and Stephanodiscus taxa; Reavie and Smol Citation2001) increase in relative abundance in both basins after the mid 20th century (. Although specific causes for increasing nutrient concentrations remain unclear, several factors may have partially contributed to higher nutrient concentrations post-1950. These factors include nutrient loads from septic systems (Robertson Citation2012), increased intensity of agricultural operations (Carpenter Citation2005), and/or internal loading of nutrients under anoxic conditions (Scavia et al. Citation2014). Nutrient inputs from septic systems may be higher in lakes underlain by calcareous bedrock (Robertson Citation2008), as is the case for Lake Manitou. However, the small increase in population on Manitoulin Island since the early 1900s (∼2000 people over ∼100 years; Statistics Canada Citation2017) suggests that increased shoreline development is unlikely to be a dominant source of increased nutrient inputs to the lake during this period. In addition, while agricultural activities are often a source of nutrients to aquatic systems, farming activity (and agriculture production) declined on Manitoulin Island between 1951 and 1986 (Bonneville Citation1989). Thus, although agriculture may still be a source of nutrients to the lake, increasing nutrient loads from agriculture since 1950 seem unlikely.
An increase in nutrient loading from lake sediment is another potential driver of the observed increase in the relative abundance of mesotrophic diatom taxa in the sedimentary records of both basins. The release of bioavailable nutrients from sediments under anoxic conditions generally results in an increase in the fall epilimnetic TP concentrations, as TP can be redistributed from the hypolimnion during fall mixing (Nürnberg Citation2009). The direct limnological monitoring data (from 2002 to present) suggest internal loading of phosphorus may be occurring in both basins because epilimnetic TP concentrations generally increase in the fall (Supplementary material, Figure S2). The available temperature-oxygen profiles from the west and east basins support the potential for internal TP loading. DO concentrations were <1 mg/L in the bottom 3 m and 7 m of the west basin in 2009 and 2011, respectively (Supplementary material, Figure S7). The east basin was often hypoxic (DO <4 mg/L) for the bottom ∼5 m of each profile; however, the DO profiles did not always extend to the lake bottom, making it difficult to assess whether anoxic conditions were also present at the sediment–water interface in the east basin (Supplementary material, Figure S7). It is also important to note that the east basin is connected to the west basin, and thus increased fall nutrients in the west basin may also flow into the east basin. While internal loading of nutrients may have increased in Lake Manitou since the 1950s, it is evident that the west basin of Lake Manitou is simultaneously influenced by other stressors (such as increasing DOC and regional warming).
In addition to nutrient increases in Lake Manitou over recent decades, diatom compositional changes in the west basin also suggest enhanced thermal stability and reduced vertical water column mixing. The abrupt decline in Aulacoseira ambigua and a concurrent sharp increase in small cyclotelloid taxa in the west basin at ∼1975 is similar to shifts observed in many lakes in the Northern Hemisphere (Rühland et al. Citation2008). Increases in the relative abundance of small, lightly silicified diatom taxa and corresponding decreases in heavily silicified taxa comprise a commonly reported indirect response to warming that can be linked to changes in water-column properties and associated changes in light and nutrient availability (Rühland et al. Citation2015). Specifically, an increase in thermal stability and reduction in vertical mixing allow lightly silicified cyclotelloid taxa to remain suspended in the water column (specifically the photic zone) longer than more heavily silicified taxa, such as Aulacoseira spp. (Rühland et al. Citation2008, Winder et al. Citation2009). In Lake Manitou, enhanced thermal stability and reduced mixing may be influenced by regional warming, declines in wind speed, and lake browning. It is likely that changes in the physical properties of Lake Manitou, and the associated changes in resource availability (including light and nutrients), are important factors that can explain these recent diatom shifts. Interestingly, the same diatom assemblage shift was not observed in the east basin (small cyclotelloid taxa did increase over the sedimentary record, but there was no corresponding decrease in more heavily silicified taxa; . It is evident from these data that the influence of warming is more prominent in the sediment record from the west basin than in that of the east basin.
Due to the confounding influences of nutrients and warming, it is possible that the increasing trend in VRS-chlorophyll a in Lake Manitou may be associated with both stressors. As expected, due to the prevalence of agriculture within Manitou’s west basin, trends in sedimentary VRS-chlorophyll a data suggest that whole-lake primary production was higher in the west basin relative to the east (. However, although the onset of the VRS-chlorophyll a increase in the west basin is concurrent with the increase in mesotrophic diatom taxa (and inferred nutrient enrichment), warming and a longer open water season for primary production (approximately 21 d longer since 1971; P. Methner, pers. comm.) may have led to further increases in VRS-chlorophyll a. Increased VRS-chlorophyll a attributed to a longer growing season has been observed in other Ontario lakes (Paterson et al. Citation2017) and future projections of earlier ice-off and shorter durations of ice cover (Futter Citation2003) suggest increases in whole-lake primary production will continue.
Inferred lakewater TOC concentrations decreased at ∼1900 (), likely due to atmospheric acid deposition and its effects on soil organic matter solubility, leading to reduced DOC inputs from the catchment. Similar TOC dynamics have been inferred for other south-central Ontario lakes (Meyer-Jacob et al. Citation2017). Increases in TOC across the Northern Hemisphere in recent decades have been associated with the recovery from acid deposition (Monteith et al. Citation2007) and climate change (Keller et al. Citation2008). The increasing trend in inferred lakewater TOC is in agreement with the direct limnological monitoring data from Lake Manitou, as measured DOC concentrations increased from 2.6 mg/L in the east basin in May 1999 (P. Werner, May 2015, pers. comm.) to 3.4 mg/L in June 2015 (MECP, unpublished data). Increasing TOC and whole-lake primary production inferred by this study correspond with decreasing Secchi depths in both basins observed since the mid 1990s ().
Conclusions
The sedimentary record indicates that oxygen concentrations in Lake Manitou were likely higher in the past (pre-1900) than they are currently, and began decreasing in the late 1800s following European settlement. The east basin of Lake Manitou had a lower rate of sedimentation and all indicators exhibited muted trends in comparison to the west basin. Specifically, the east basin had lower relative abundances of mesotrophic Stephanodiscus diatom taxa, experienced less of an increase in small cyclotelloid taxa, and the increase in inferred whole-lake primary production and decrease in CI-VWHO were less pronounced than in the west basin. Diatom assemblage shifts suggest that both nutrient loading and regional climate warming have likely contributed to increased primary production and changes in thermal properties (i.e., increased stability and reduced mixing) that are particularly well expressed in the west basin. These changes may have contributed to the reduction in oxygen conditions in both basins. The slight increase in VWHO observed in the post-2000 sediments in the west basin warrants future monitoring and may be associated with reduced lake water transparency and wind speeds.
Despite experiencing similar responses to local (e.g., European settlement) and regional (e.g., warming) environmental stressors, it is evident that the scale of change recorded by different paleo-proxies differs between the east and west basins of Lake Manitou (with the west basin often undergoing larger changes across most paleo-proxies). The data presented here suggest that the west basin may have undergone a greater biological response to changing water quality and climate and over the past ∼150 years, although this may also reflect differing sedimentation rates across the basins, with more muted responses recorded in the east basin sediment core. Nevertheless, the varied response observed in the paleolimnological records of Lake Manitou’s 2 basins presents a challenge to lake management efforts applied to the lake as a whole. Specifically, with respect to Lake Manitou, targeted efforts to improve water quality (e.g., by establishing or improving vegetative buffer zones or implementing best management practices) in the west basin may be beneficial. Overall, a precautionary management strategy aimed at protecting areas of the lake with the greatest potential for impact may be required for the continued protection of Lake Manitou’s coldwater fish species, such as lake trout.
Supplemental Material
Download MS Word (1.7 MB)Acknowledgments
We thank R. Ingram, E. Favot, P. Methner, and W. Selinger for their assistance in collecting sediment cores from both basins of Lake Manitou in 2015 and 2016, and for the water chemistry and fish stocking data (supplied from P. Methner and W. Selinger). We also thank the Lake Manitou Lake Partners for collecting the long-term Secchi and total phosphorus monitoring data. Finally, comments from two anonymous reviewers greatly improved this article.
Additional information
Funding
References
- Appleby P. 2001. Chronostratigraphic techniques in recent sediments. In: Last WM, Smol JP, editors. Tracking environmental change using lake sediments: basin analysis, coring and chronological techniques. Dordrecht (Netherlands): Kluwer Academic Publishers, p. 171–203.
- Bennett KD. 1996. Determination of the number of zones in a biostratigraphical sequence. New Phytol. 132:155–170.
- Bonneville MJ. 1989. An integrated approach to the study of agricultural change on Manitoulin Island. [MSc thesis]. [Ottawa (ON)]: Carleton University.
- Brooks SJ, Langdon PG, Heiri O. 2007. The identification and use of Palaearctic Chironomidae larvae in paleoecology. Quat Res (London): Technical Guide no. 10.
- Brothers S, Köhler J, Attermeyer K, Grossart HP, Mehner T, Meyer N, Scharnweber K, Hilt S. 2014. A feedback loop links brownification and anoxia in a temperature, shallow lake. Limnol Oceanogr. 59(4):1388–1398. doi:10.4319/lo.2014.59.4.1388.
- Camburn KE, Charles DF. 2000. Diatoms of low-alkalinity lakes in the northeastern United States. The Academy of Natural Sciences of Philadelphia: Special Publication 18.
- Canadian Council of Ministers of the Environment (CCME). 2004. Canadian water quality guidelines for the protection of aquatic life: phosphorus: Canadian guidance framework for the management of freshwater systems. Winnipeg (MB): Canadian Council of Ministers of the Environment (CCME).
- Carpenter SR. 2005. Eutrophication of aquatic ecosystems: bistability and soil phosphorus. Proc Natl Acad Sci USA. 102(29):10002–10005. doi:10.1073/pnas.0503959102.
- Chapman LJ, Putnam DF. 1984. The physiography of southern Ontario. 3rd ed. Toronto: Ontario Geological Survey, Ministry of Natural Resources.
- Clerk S, Hall R, Quinlan R, Smol JP. 2000. Quantitative inferences of past hypolimnetic anoxia and nutrient levels from a Canadian Precambrian Shield lake. J Paleolimn. 23(3):319–336.
- Couture R, de Wit HA, Tominaga K, Kiuru P, Markelov I. 2015. Oxygen dynamics in a boreal lake responds to long-term changes in climate, ice, phenology, and DOC inputs. J Geophys Res Biogeosci. 120(11):2441–2456. doi:10.1002/2015JG003065.
- Dubois N, Saulnier-Talbot E, Mills K, Gell P, Battarbee R, Bennion H, Chawchai S, Dong X, Francus P, Flower R, et al. 2018. First human impacts and responses of aquatic systems: A review of paleolimnological records from around the world. Anthropocene Rev. 5(1):28–68. doi:10.1177/2053019617740365.
- EGA Consultants. 2001. Dam Safety Assessment, Northeast Region, Manitou Lake Dam.
- Eimers MC, Watmough SA, Paterson AM, Dillon PJ, Yao H. 2009. Long-term declines in phosphorus export from forested catchments in south-central Ontario. Can J Fish Aquat Sci. 66(10):1682–1692. doi:10.1139/F09-101.
- Environment and Climate Change Canada (ECCC). 2018. Adjusted and homogenized Canadian climate data (AHCCD); [cited 14 Aug 2018]. Available from http://www.ec.gc.ca/dccha-ahccd/
- Evans DO. 2007. Effects of hypoxia on scope-for-activity and power capacity of lake trout (Salvelinus namaycush). Can J Fish Aquat Sci. 64(2):345–361. doi:10.1139/f07-007.
- Evans DO, Casselman JM, Wilox CC. 1991. Effects of exploitation, loss of nursery habitat, and stocking on the dynamics and productivity of Lake Trout populations in Ontario lakes. Toronto, (Ont.): Ontario Ministry of Natural Resources, p.103.
- Fang X, Stefan HG. 2009. Simulations of climate effects on water temperature, dissolved oxygen, and ice and snow covers in lakes of the contiguous United States under past and future climate scenarios. Limnol Oceanogr. 54(6part2):2359–2370.
- Fee EJ, Hecky RE, Kasian SEM, Cruikshank DR. 1996. Effects of lake size, water clarity and climatic variability on mixing depths in Canadian Shield lakes. Limnol Oceanogr. 41(5):912–920. doi:10.4319/lo.1996.41.5.0912.
- Foley B, Jones ID, Maberly SC, Rippey B. 2012. Long‐term changes in oxygen depletion in a small temperate lake: effects of climate change and eutrophication. Freshwater Biol. 57(2):278–289. doi:10.1111/j.1365-2427.2011.02662.x.
- Francis DR. 2000. A record of hypolimnetic oxygen conditions in a temperate multi-depression lake from chemical evidence and chironomid remains. J Paleolimn. 25:351–365.
- Francis DR. 2001. A record of hypolimnetic oxygen conditions in a temperate multi-depression lake from chemical evidence and chironomid remains. J Paleolimn. 25(3):351–365.
- Futter MN. 2003. Patterns and trends in southern Ontario lake ice phenology. Environ Monit Assess. 88(1–3):431–444.
- Glew JR. 1988. A portable extruding device for close interval sectioning of unconsolidated core samples. J Paleolimn. 1:235–239.
- Glew JR. 1989. A new trigger mechanism for sediment samplers. J Paleolimn. 2:241–243.
- Grimm EC. 1987. CONISS: a FORTRAN 77 program for stratigraphically constrained cluster analysis by the method of incremental sum of squares. Comput Geosci. 13(1):13–35. doi:10.1016/0098-3004(87)90022-7.
- Hadley KR, Paterson AM, Stainsby EA, Michelutti N, Yao H, Rusak JA, Ingram R, McConnell C, Smol JP. 2014. Climate warming alters thermal stability but not stratification phenology in a small north‐temperate lake. Hydrol Process. 28(26):6309–6319. doi:10.1002/hyp.10120.
- Hall RI, Smol JP. 1996. Paleolimnological assessment of long-term water-quality changes in south-central Ontario lakes affected by cottage development and acidification. Can J Fish Aquat Sci. 53(1):1–17. doi:10.1139/cjfas-53-1-1.
- Harvey HH. 1978. Fish communities of the Manitoulin Island lakes. Int Ver Theor Angew Limnol: Ver. 20:2031–2038. doi:10.1080/03680770.1977.11896812.
- Hoffman DW, Wicklund RE, Richards NR. 1959. Soil survey of Manitoulin Island Ontario. Report No. 26 of the Ontario Soil Survey. p. 85.
- Jenny JP, Francus P, Normandeau A, La Pointe F, Perga ME, Ojala A, Schimmelmann A, Zolitschka B. 2016. Global spread of hypoxia in freshwater ecosystems during the last three centuries is caused by rising local human pressure. 2016. Glob Change Biol. 22(4):1481–1489. doi:10.1111/gcb.13193.
- Keller W, Heneberry J, Leduc J. 2005. Linkages between weather, dissolved organic carbon, and cold-water habitat in a Boreal Shield lake recovering from acidification. Can J Fish Aquat Sci. 62(2):341–347. doi:10.1139/f04-192.
- Keller W, Paterson AM, Somers KM, Dillon PJ, Heneberry JH, Ford A. 2008. Relationship between dissolved organic carbon, weather, and acidification in small Boreal Shield lakes. Can J Fish Aquat Sci. 65(5):786–795. doi:10.1139/f07-193.
- Kerr SJ, Lasenby TA. 2001. Lake Trout stocking in inland lakes: an annotated bibliography and literature review. Peterborough: Ontario Ministry of Natural Resources, p.196.
- Krammer K, Lange-Bertalot H. 1986. Bacillariophyceae. 1. Teil: Naviculaceae. In: Ettl H, Gerloff J, Heynig H, Mollenhauer D, editors. Süsswasserflora von Mitteleuropa, Band 2/1. Stuttgart, New York: Gustav Fischer Verlag, p. 1–876. German.
- Krammer K, Lange-Bertalot H. 1988. Bacillariophyceae. 2. Teil: Bacillariaceae, Epithemiaceae, Surirellaceae. In: Ettl H, Gerloff J, Heynig H, Mollenhauer D, editors. Süsswasserflora von Mitteleuropa, Band 2/2. Gustav Fischer Verlag, Jena. p. 1–596. German.
- Krammer K, Lange-Bertalot H. 1991a. Bacillariophyceae. 3. Teil: Centrales, Fragilariaceae, Eunotiaceae. In: Ettl H, Gerloff J, Heynig H, Mollenhauer D, editors. Süsswasserflora von Mitteleuropa, Band 2/3. Gustav Fischer Verlag, Stuttgart, Jena. p. 1–576. German.
- Krammer K, Lange-Bertalot H. 1991b. Bacillariophyceae. 4. Teil: Achnanthaceae, Kritische Ergänzungen zu Navicula (Lineolatae) und Gomphonema, Gesamtliteraturverzeichnis Teil 1-4. In: Ettl H, Gerloff J, Heynig H, Mollenhauer D, editors. Süsswasserflora von Mitteleuropa, Band 2/4. Stuttgart, Jena: GustavFischer Verlag, p. 1–437. German.
- Lepori F, Roberts JJ. 2017. Effects of internal phosphorus loading and food-web structure on the recovery of a deep lake from eutrophication. J Great Lakes Res. 43(2):255–264. doi:10.1016/j.jglr.2017.01.008.
- Mallin MA, Johnson VL, Ensign SH, MacPherson TA. 2006. Factors contributing to hypoxia in rivers, lakes and streams. Limnol Oceanogr. 51(1part2):690–701. doi:10.4319/lo.2006.51.1_part_2.0690.
- Meyer-Jacob C, Michelutti N, Paterson AM, Monteith D, Yang H, Weckström J, Smol JP, Bindler R. 2017. Inferring past trends in lake water organic carbon concentrations in northern lakes using sediment spectroscopy. Environ Sci Technol. 51(22):13248–13255. doi:10.1021/acs.est.7b03147.
- Michelutti N, Blais JM, Cumming BF, Paterson AM, Rühland K, Wolfe AP, Smol JP. 2010. Do spectrally inferred determinations of chlorophyll a reflect trends in lake trophic status? J Paleolimnol. 43(2):205–217. doi:10.1007/s10933-009-9325-8.
- Michelutti N, Smol JP. 2016. Visible spectroscopy reliably tracks trends in paleo-production. J Paleolimnol. 56(4):253–265. doi:10.1007/s10933-016-9921-3.
- Monteith DT, Stoddard JL, Evans CD, de Witt HA, Forsius M, Høåsen T, Wilander A, Skjelkvåle BL, Jeffries DS, Vuorenmaa J, et al. 2007. Dissolved organic carbon trends resulting from changes in atmospheric deposition chemistry. Nat Lett. 460:537–541. doi:10.1038/nature06316.
- Nelligan C, Jeziorski A, Rühland KM, Paterson AM, Smol JP. 2019. Long-term trends in hypolimnetic volumes and dissolved oxygen concentrations in Boreal Shield lakes of south-central Ontario, Canada. Can J Fish Aquat Sci. 76(12):2315–2325. doi:10.1139/cjfas-2018-0278.
- North RP, North RL, Livingstone DM, Köster O, Kipfer R. 2014. Long-term changes in hypoxia and soluble reactive phosphorus in the hypolimnion of a large temperate lake: consequences of a climate regime shift. Glob Chang Biol. 20(3):811–823. doi:10.1111/gcb.12371.
- Nürnberg GK. 2009. Assessing internal phosphorus load – problems to be solved. Lake Reserv Manage. 25(4):419–432. doi:10.1080/00357520903458848.
- Ontario Ministry of Natural Resources and Forestry (OMNRF). 2006. Inland Ontario lakes designated for lake trout management. Peterborough (ON): Ontario Ministry of Natural Resources and Forestry (OMNRF).
- Ontario Ministry of Natural Resources and Forestry (OMNRF). 2018. Ontario flow assessment tool; [cited 31 Aug 2018]. Available from http://www.gisapplication.lrc.gov.on.ca/OFAT/Index.html?site=OFAT&viewer=OFAT&locale=en-US.
- Paerl HW, Huisman J. 2008. Blooms like it hot. Science. 320(5872):57–58. doi:10.1126/science.1155398.
- Pasciak WJ, Gavis J. 1974. Transport limitation of nutrient uptake in phytoplankton. Limnol Oceanogr. 19(6):881–888. doi:10.4319/lo.1974.19.6.0881.
- Paterson AM, Rühland KM, Anstey CV, Smol JP. 2017. Climate as a driver of increasing algal production in Lake of the Woods, Ontario, Canada. Lake. Reserv Manage. 33:403–413. doi:10.1080/10402381.2017.1379574.
- Pilla RM, Williamson CE, Zhang J, Smyth R, Lenters JD, Brentrup J, Knoll LB, Fisher TJ. 2018. Browning-related decreases in water transparency lead to long-term increases in surface water temperature and thermal stratification in two small lakes. J Geophys Res Biogeosci. 123(5):1651–1665. doi:10.1029/2017JG004321.
- Quinlan R, Smol JP. 2001a. Chironomid-based inference models for estimating end-of-summer hypolimnetic oxygen from south-central Ontario shield lakes. Freshwater Biol. 46(11):1529–1551. doi:10.1046/j.1365-2427.2001.00763.x.
- Quinlan R, Smol JP. 2001b. Setting minimum head capsule abundance and taxa deletion criteria in chironomid-based inference models. J Paleolimn. 26(3):327–342.
- Quinlan R, Smol JP. 2010. Use of subfossil Chaoborus mandibles in models for inferring past hypolimnetic oxygen. J Paleolimnol. 44(1):43–50. doi:10.1007/s10933-009-9384-x.
- R Core Team. 2017. R: A language and environment for statistical computing. Vienna, Austria: R foundation for Statistical Computing. http://www.R-project.org/
- Reavie ED, Kireta AR. 2015. Centric, araphid and eunotioid diatoms of the coastal Laurentian Great Lakes. Germany: Bibliotheca Diatomologica, p. 184.
- Reavie ED, Smol JP. 2001. Diatom-environmental relationships in 64 alkaline southeastern Ontario (Canada) lakes: a diatom-based model for water quality reconstructions. J Paleolimn. 25(1):25–42.
- Robertson WD. 2012. Phosphorus retention in a 20-year-old septic system filter bed. J Environ Qual. 41:1437–1444. doi:10.2134/jeq2011.0427.
- Rühland KM, Paterson AM, Smol JP. 2008. Hemispheric-scale patterns of climate-related shifts in planktonic diatoms from North American and European lakes. Global Change Biol. 14:2740–2754.
- Rühland KM, Paterson AM, Smol JP. 2015. Lake diatom responses to warming: reviewing the evidence. J Paleolimnol. 54(1):1–35. doi:10.1007/s10933-015-9837-3.
- Rühland KM, Smol JP. 2002. Freshwater diatoms from the Canadian Arctic treeline and development of paleolimnological inference models. J Phycol. 38(2):249–264. doi:10.1046/j.1529-8817.2002.01129.x.
- Scavia D, Allan JD, Arend KK, Bartell S, Belesky D, Bosch NS, Brandt SB, Brilland RD, Daloğlu I, DePinto JV, et al. 2014. Assessing and addressing the re-eutrophication of Lake Erie: Central basin hypoxia. J Great Lakes Res. 40:226–246. doi:10.1016/j.jglr.2014.02.004.
- Schelske CL, Peplow A, Brenner M, Spencer CN. 1994. Low-background gamma counting: applications for 210Pb dating of sediments. J Paleolimnol. 10(2):115–128. doi:10.1007/BF00682508.
- Simpson GL. 2012. Analogue methods in palaeolimnology. In: Birks HJB, Lotter AF, Juggins S, Smol JP. Tracking environmental change using lake sediments: data handling and numerical techniques, 3. Dordrecht: Kluwer Academic Publishers, p. 496–522.
- Smol JP. 2008. Pollution of lakes and rivers: a paleoenvironmental perspective. 2nd ed. Oxford (UK): Blackwell Publishing.
- Smol JP, Stoermer EF, editors. 2010. The diatoms: Applications for the environmental and earth sciences. 2nd ed. Cambridge: Cambridge University Press, p. 667.
- Stainsby E, Winter J, Jarjanazi H, Paterson A, Evans D, Young J. 2011. Changes in the thermal stability of Lake Simcoe from 1980 to 2008. J Great Lakes Res. 37:55–62. doi:10.1016/j.jglr.2011.04.001.
- Statistics Canada. 2017. Manitoulin, DIS [Census division], Ontario and Ontario [Province] (table). Census Profile. 2016 Census. Statistics Canada Catalogue no. 98-316-X2016001. Ottawa. Released November 29, 2017.
- Surtees RJ. 1986. Treaty research report Manitoulin Island Treaties. Indian and Northern Affairs Canada, p. 27.
- Uutala AJ. 1990. Chaoborus (Diptera: Chaoboridae) mandibles – paleolimnological indicators of the historical status of fish populations in acid-sensitive lakes. J Paleolimn. 4:139–151.
- Walker IR. 2001. Midges: Chironomidae and related Diptera. In: Smol JP, Birks HJB, Last WM editors. Tracking environmental change using lake sediments: zoological indicators. Netherlands: Springer, p. 43–66.
- Wiederholm T. 1983. Chironomidae of the Holarctic region. Keys and diagnoses. Part I. Larvae. In Entomological Society of Lund, Suppl 19. Sweden: Entomological Society of Lund.
- Winder M, Reuter JE, Schladow SG. 2009. Lake warming favours small-sized planktonic diatom species. P Roy Soc B-Biol Sci. 276:427–435. doi:10.1098/rspb.2008.1200.
