
Abstract
James WF, Bischoff JM. 2019. Aluminum:phosphorus binding ratios and internal phosphorus loading characteristics 12 years after aluminum sulfate application to Lake McCarrons, Minnesota. Lake Reserv Manage. 36:1–13.
Lake McCarrons, Minnesota, an urban eutrophic system (mean depth = 7.6 m, maximum depth = 17.4 m) located in the St. Paul metropolitan area, was treated in 2004 with ∼77 g Al/m2 uniformly over depths >1.5 m to reduce internal phosphorus (P) loading. Sediment cores were collected at various depths and areas in the lake in 2016, 12 yr after the Al treatment, to examine concentrations and vertical distribution of Al, Al-bound P, the aluminum:Al-bound P (Al:P) binding ratio, and current anaerobic diffusive P flux. The Al floc became redistributed after application and varied with respect to the northwest–southeast (NW-SE) maximum fetch. Added Al was maximal in the SE area, exceeding nearly 180% of the target Al dose, and buried with up to 5 cm of sediment. In the NW, added Al was lower (14% to 34% of target Al dose) to not detected and dispersed in the upper 3 cm with little burial. Al-bound P increased with increasing added Al concentration over all stations. The molar Al:P binding ratio approached 10:1 in conjunction with lowest added Al concentrations found in the NW, suggesting P saturation and inefficient control of newly deposited redox P and corresponding diffusive P flux. Although SE areas had the greatest added Al, the molar Al:P binding ratio was > 30:1, suggesting poor binding efficiency and crystallization. This Al floc has become buried, and redox P in surface sediment now represents an important internal P load to the lake to be managed in the future.
Application of aluminum salts to bind sediment mobile phosphorus (P) and control internal phosphorus (P) loading in eutrophic lakes has been used with varying degrees of success for nearly 50 yr (Cooke et al. Citation2005, Huser et al. Citation2016). In a meta-analysis of Al-treated lakes worldwide, Huser et al. (Citation2016) indicated that longevity of successful reductions in epilimnetic total P after Al treatment varied widely from months to nearly 50 yr, and averaged ∼21 yr for stratified lakes. They found that aluminum dosage concentration and the watershed:lake surface area (i.e., a surrogate for the relative importance of external P loading) explained most of the variation in Al treatment longevity.
Current Al dosing strategies are based on inactivation of sediment mobile P concentrations (i.e., loosely bound P, iron-bound P, and labile organic P) and an Al:P binding ratio (Rydin and Welch Citation1999, Reitzel et al. Citation2003, Citation2005, Pilgrim et al. Citation2007, James Citation2011, Huser and Pilgrim Citation2014, James and Bischoff Citation2015, Jensen et al. Citation2015). The Al:P binding ratio of freshly precipitated Al(OH)3 can be higher than 1:1 (Lijklema Citation1980) due to reaction with other ions and dissolved organic matter (de Vicente et al. Citation2008a), competition for binding sites by P (Cheng et al. Citation2004, Guan et al. Citation2006, Huser and Pilgrim Citation2014, James and Bischoff Citation2015), and pH (Egemose et al. Citation2009). In addition, P binding affinity and capacity rapidly diminish in the absence of immediate exposure to P due to polymerization as the Al floc ages (Berkowitz et al. Citation2005, Citation2006, de Vicente et al. Citation2008a, Citation2008b). Although Al(OH)3 can continue to bind P for years after initial application (Lewandowski et al. Citation2003, Jensen et al. Citation2015, James Citation2017), binding capacity can be reduced by up to 75% within ∼3 months of application without exposure to P (Berkowitz et al. Citation2006, de Vicente et al. Citation2008a). James (Citation2017) found that Al floc binding efficiency declined to 60% within 4 yr of a 150 g Al/m2 application to the western arm of Half Moon Lake, Wisconsin. The Al floc adsorbed minimum P during deposition and settled on top of the sediment, rather than mixing into and becoming exposed to redox P located several centimeters below. Thus, exposure of the Al floc to P occurred primarily by slow upward diffusion. James attributed decreased binding efficiency to possible polymerization.
Depending on initial dosage, Al:P binding ratios can tend to stabilize and approach ∼5:1 to 13:1 molar after many years (4:1 to 11:1 mass; Rydin et al. Citation2000, Huser et al. Citation2011, Egemose et al. Citation2013, Welch et al. Citation2017). De Vicente et al. (Citation2008a) and Jensen et al. (Citation2015) suggested that saturation of Al(OH)3 with P generally occurs at an Al:P binding ratio of ∼10:1 molar. However, a much lower molar ratio of ∼2:1 was found in Lake Süsser See sediment in conjunction with multiple annual low Al dose applications (Lewandowski et al. Citation2003). The lower ratio may have been achieved via some formation of AlPO4 or higher Ca concentration that impacted surface charge on the Al(OH)3 floc.
Phosphorus binding onto Al(OH)3 can also be influenced by movement and redistribution after application. Huser (Citation2012) found that the Al:P binding ratio was positively related to both Al dose and lake morphometry. The Al:P binding ratio increased as a function of increasing Depth Index (Z/A0.5, where Z is the sediment core sampling depth and A is the lake surface area), suggesting that redistribution and focusing of the Al floc to deeper regions resulted in overdosage with respect to mobile P. In contrast, the Al floc can also be exposed to internal P loads during movement and focusing, leading to increased contact with and binding of P during transport (Egemose et al. Citation2013, Huser Citation2017, Welch et al. Citation2017).
More information is needed on long-term P binding capacity on Al(OH)3 to improve our understanding of alum effectiveness in controlling internal P loading. Lake McCarrons was treated with a relatively high Al dose of 77 g/m2 that was homogeneously applied over the 1.5-m contour in late October 2004. Sediment cores collected at various areas and depths in 2016, that is, 12 yr later, exhibited marked variations in added Al concentration (range = 11 g/m2 to 140 g/m2) as a function of station location more so than of depth. Although exact mechanisms and timing of redistribution are unknown, wind-generated horizontal water circulation and transport along the maximum fetch (northwest [NW] to southeast [SE] wind rose) could have moved some of the freshly precipitated low-density Al floc during or shortly after application, altering the desired homogeneous distribution. The uneven distribution of added Al in the lake sediments presented an a posteriori opportunity to examine variations in apparent Al(OH)3 saturation with aluminum-bound P and the resultant Al:P binding ratio as a function of added Al concentration 12 yr after the Al application. Finally, we examined diffusive P flux from surface sediments deposited on top of the Al floc for comparison with pretreatment rates measured in 2003 (Pilgrim et al. Citation2007) to gain insight into the internal P loading potential of recently deposited sediment.
Site description
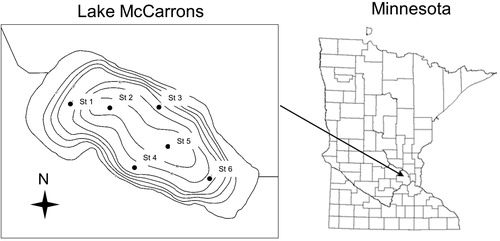
Lake McCarrons () is a small (33 ha surface area, mean depth 7.6 m, maximum depth 17.4 m), glacially formed urban lake located in Roseville, MN (Myrbo Citation2008). Much of the water income from the 433-ha urban watershed, primarily via storm sewer inputs, flows through a constructed detention pond and wetland complex before entering the lake. The wetland system, constructed in 1985, initially exhibited 96% and 70% total suspended solids (TSS) and total P removal efficiency, respectively (Oberts and Osgood Citation1991, Schueler Citation2000, Capital Region Watershed District [CRWD] Citation2010). However, removal efficiency declined to 66% for TSS and only 4% for P by 1995–1996 (Schueler Citation2000). Summer total and soluble P loading to the lake were 112 kg and 29 kg, respectively, in 2007 (CRWD Citation2010). Residence time of Lake McCarrons is ∼3 yr. The maximum fetch, located along a NW to SE wind rose, is 873 m. Complete fall turnover may be delayed until late fall (i.e, November) or sometimes may not occur (Myrbo Citation2008). Prior to alum treatment, the lake exhibited eutrophic conditions (Carlson Trophic State Index [TSI] = 55, total phosphorus [TP] = 41 µg/L, chlorophyll-a [Chl-a] = 18 µg/L, Secchi depth (SD) = 1.9 m; CRWD Citation2003, Myrbo Citation2008). Before Al treatment, redox-P concentrations in the upper 4 cm were moderate and ranged between ∼0.36 mg/g at depths >10 m and ∼0.16 mg/g between 4.5 m and 10 m. Laboratory-measured anaerobic diffusive P flux was ∼2 mg/m2/d in the deep basin before Al treatment (Pilgrim et al. Citation2007, Barr Engineering 2003 unpubl. data), and soluble reactive P concentrations exceeded 0.50 mg/L above the sediment interface during summer hypolimnetic anoxia (Ramsey County Public Works, Ramsey County Citation2018). Internal P loading represented ∼50% of the annual P sources to the lake. Aluminum sulfate was uniformly applied at a concentration of 77 g/m2 to all depths greater than ∼1.5 m between 21 and 25 October 2004.
Figure 1. Sediment core station locations in Lake McCarrons, Minnesota.
Methods
Intact sediment cores were collected in February 2016 from 6 stations in the profundal region of Lake McCarrons () to examine spatial and depth-related variations in sediment physical–chemical characteristics, concentration and location of the Al floc and associated aluminum-bound P within the vertical sediment profile, and current diffusive P flux under laboratory-controlled anaerobic conditions. Two sediment stations were established in the NW (St 2) and SE (St 5) regions of the deep basin (). Stations 1, 3, 4, and 6 were located at shallower depths ranging between ∼7.5 m and 11 m to examine potential postdepositional redistribution of the Al floc (). Stations 1 and 6 were established in the NW and SE region of the lake along the longitudinal axis of the maximum fetch, while St 3 and St 4 were located along the NE to SW axis where basin morphometry is steeper.
Table 1. Sediment physical-textural characteristics of the upper 5-cm sediment layer at various stations in Lake McCarrons, Minnesota. Station numbers are generally ordered from west to east (i.e., low to high numbers, 1 = west, 6 = east).
A gravity sediment coring device (Aquatic Research Instruments, Hope, ID) equipped with an acrylic core liner (6.5 cm ID and 50 cm length) was used to collect sediment. Three replicate cores each were collected from St 5 and St 6 for determination of rates of diffusive P flux under anaerobic conditions. Additional sediment cores collected at all stations were sectioned vertically over the upper 20-cm layer to evaluate variations in sediment physical-textural and chemical characteristics. These cores were sectioned at 1-cm intervals over the first 10 cm and at 2-cm intervals between 10 and 20 cm.
A known volume of sediment was dried at 105 C for determination of moisture content and sediment wet and dry bulk density and burned at 550 C for determination of loss-on-ignition organic matter (Avnimelech et al. Citation2001, Håkanson and Jansson Citation2002). Sequential P fractionation was conducted according to Psenner and Puckso (Citation1988) for the determination of ammonium chloride-extractable P (1 M NH4Cl, loosely bound P or loose P), bicarbonate-dithionite-extractable P (0.11 M NaHCO2-dithionate, iron-bound P or Fe-P), and sodium hydroxide-extractable P (1 M NaOH, aluminum-bound P or Al-bound P). Redox-sensitive P (redox-P) was estimated as the sum of the loosely bound and iron-bound P fractions. Additional sediment was dried and ground for determination of total Al via inductively coupled plasma–mass spectroscopy (ICP-MS) analysis (EPA methods 3050b and 6020a).
Methods for estimating diffusive P fluxes under anaerobic conditions followed those described in James (Citation2017). The upper 10 cm was extruded intact to a smaller acrylic core liner (6.5 cm diameter and 20 cm height) for incubation. Surface water collected from the lake was filtered through a glass fiber filter (Gelman A-E), and 300 mL was siphoned onto the sediment contained in the small acrylic core liner without causing sediment resuspension. Sediment incubation systems were placed in the darkened environmental chamber and incubated at a constant temperature (20 C). Since this temperature was high compared to in situ hypolimnetic temperatures in Lake McCarrons (∼6 C at 16 m in September; Johnson and Stephan Citation2006, Myrbo Citation2008), laboratory-derived anaerobic diffusive fluxes were probably higher than those determined by in situ increases in P mass. The oxidation–reduction environment in the overlying water was controlled by gently bubbling nitrogen (anaerobic) through an air stone placed just above the sediment surface in each system.
Water samples for soluble reactive P (SRP) were collected from the center of each system using an acid-washed syringe and filtered through a 0.45-µm membrane syringe filter. The water volume removed from each system during sampling was replaced by addition of filtered lake water preadjusted to the proper oxidation–reduction condition. These volumes were accurately measured for determination of dilution effects. Soluble reactive P was measured colorimetrically using the ascorbic acid method (American Public Health Association [APHA] Citation2011). Rates of P release from the sediment (mg/m2/d) were calculated as the linear change in mass in the overlying water divided by time (d) and the area (m2) of the incubation core liner. Regression analysis was used to estimate rates over the linear portion of the data.
Results
Vertical sediment Al profiles varied markedly between stations (). For instance, St 5, located in the eastern deep basin, and St 6, located in the eastern region at ∼10 m, exhibited distinct peaks in Al concentration at the 3–4 cm and 5–6 cm depths, respectively. This subsurface pattern suggested that the Al floc had become buried with new sediment since the 2004 application. The peak Al concentration was greatest in St 6 sediments at ∼265 mg/g, while the St 5 peak Al was much lower at 61 mg/g, even though this station was located in the deepest area of the lake and therefore was expected to have the highest sediment Al concentration as a result of sediment focusing (Huser et al. Citation2012). In contrast, St 2, located in the western deep basin, exhibited a near-surface Al concentration of 33 mg/g, lower compared to St 5 and St 6 peak Al concentrations. Shallower St 1, located in the northwest region at ∼8 m, did not exhibit an Al concentration peak. Instead, the Al concentration was relatively constant throughout the sediment profile and low at a mean 6.2 mg/g, suggesting no detection of added Al at this station. Stations 3 and 4, each located within the 10-m contour, exhibited slightly higher Al concentrations in the upper ∼5 cm versus concentrations at sediment depths greater than 10 cm. Unlike St 2, St 5, and St 6, a distinct Al concentration maximum was not detected in St 3 and St 4 sediment profiles. However, slightly higher concentrations were observed between the 2 to 4 cm and 2 to 3 cm depths at St 3 and St 4, respectively, suggesting evidence of an Al floc layer.
Figure 2. Vertical variations in sediment aluminum (Al) concentration measured at various stations in 2016. Vertical dashed lines represent background Al concentrations. Arrows denote the general location of added Al.
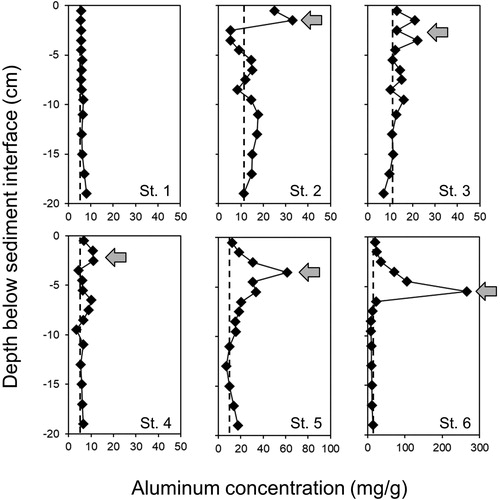
The depth-integrated concentration at each station was determined over the upper 8-cm thickness or less, depending on station location, to estimated added Al (). For St 3, St 4, St 5, and St 6, we estimated the depth-integrated Al concentration over the upper 8 cm as suggested by vertical Al profile patterns (). In contrast, the sediment layer containing the Al floc appeared to be located in the upper ∼3 cm layer at St 2. Since pretreatment sediment Al concentrations were not examined or available, we accounted for the background Al concentration (i.e., the pretreatment Al concentration) by estimating mean Al below the 10-cm depth for each sediment core. This mean was subtracted from the depth-integrated Al concentration to correct for background Al (Huser Citation2012, Egemose et al. Citation2013). This correction assumed that background Al was also present in the Al floc layer that was applied in 2004, which may not be the case. For instance, the Al floc likely initially settled on top of the original sediment–water interface and contained no additional sediment with background Al (James Citation2017). However, some mixing and homogenization could have occurred over time.
Table 2. Background-corrected concentrations of added aluminum (Al) and adsorbed aluminum-bound phosphorus (Al-bound P) at various stations in Lake McCarrons, Minnesota. Station numbers are generally ordered from west to east (i.e., low to high numbers, 1 = west, 6 = east). Background-corrected concentrations were calculated by subtraction (i.e., concentration-background concentration, see ). ND = not detected. The added Al percentage is based on 77 g/m2 added in 2004.
Overall, added Al concentrations in the upper sediment layer were generally greater than background levels, indicating detection of the applied Al floc (). An exception was St 1. Generally, the background Al concentration was a mean 10.3 mg/g. Stations 1 and 4 sediment cores exhibited lower background Al than the other stations, possibly due to general resuspension, erosion, and focusing of finer grained particles with higher Al concentration to deeper areas of the lake. In contrast, St 2 sediment exhibited anomalously high background Al compared to other stations (). For background correction calculation purposes, we used the mean background Al concentration determined for the other stations to estimate added Al for station 2.
Global positioning system (GPS) tracking maps of the 2004 Al treatment (Wenck Associates, Inc. Citation2016) verified that the application boat evenly covered the treatment area. However, Stations 2 through 4 were substantially lower in added Al at only 14%, 34%, and 21% of the 77 g/m2 target dose, respectively (). Station 5 added Al accounted for ∼98% of the target concentration, and St 6 added Al was much greater than the target concentration (i.e., 181%). Deviations from the target added Al concentration may be related to postdepositional Al floc redistribution. In typical cases, the less dense Al floc can be susceptible to resuspension, redistribution, and focusing from shallow to deeper areas during periods of turnover, resulting in lower and higher added Al concentrations versus the target dose (Egemose et al. Citation2013). This hypothesis was not entirely supported in the case of Lake McCarrons. While St 1, St 3, and St 4 were located at shallower depths and exhibited lower added Al relative to target concentrations, St 6, also located at an intermediate depth, exceeded the target. Station 2, located in the deep basin, was also well below the target 77 g/m2. Relatively high winds along the maximum fetch during the October application and into early November could have impacted the distribution of the Al floc as it settled, moving it from west and central areas to east. For instance, sustained winds from the northly direction in excess of 5 m/s (gusts >8 m/s, National Oceanic and Atmospheric Administration, https://www.ncdc.noaa.gov/IPS/lcd/lcd.html?_page=1&state=MN&stationID=14922&_target2=Next±%3E) occurred during the latter period of Al application during 23–25 October 2004 and into early November and could have played a role in Al floc movement and redistribution. Indeed, the added Al concentration was greatest in the east area and minimal at shallower St 1, St 3, and St 4, located in the west portion of the lake, suggesting possible unintended movement during application.
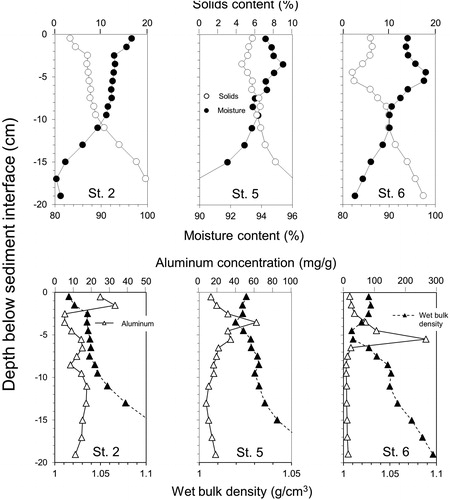
For all stations, moisture content was relatively high at ≥90% in the upper sediment layer and declined with increasing sediment depth, suggesting very flocculent sediment with high porosity (i.e., interstitial spaces for porewater) overlying more compacted, denser sediment. Moisture content increased to a maximum, while solids content exhibited minima, in the vicinity of peak added Al concentrations, as shown for St 2, St 5, and St 6 (). Thus, the subsurface Al floc exhibited high moisture content and overall lower density and solids content than sediment layers located above and below this layer (). The precipitated Al floc is typically very fluid after application, which can promote deposition on top of the denser original sediment–water interface (James Citation2017). Vertical patterns at St 2, St 5, and St 6 in 2016 suggested that the density of Al floc in Lake McCarrons sediments has remained very low 12 yr after application and that the Al has become buried by denser sediment that has accreted on top of the Al layer.
Figure 3. Vertical variations in sediment moisture content (upper panels), solids content, and wet bulk density (lower panels) for St 2 (left panels), St 5 (middle panels), and St 6 (right panels) in 2016.
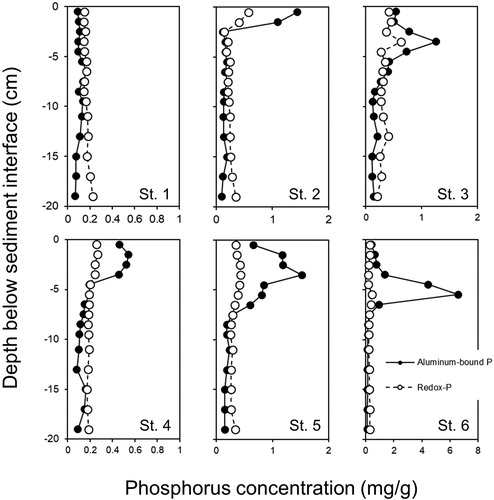
Al-bound P exhibited concentration peaks that coincided with maxima in added Al, indicating adsorption of P onto the Al floc (). Al-bound P concentration maxima were observed at the sediment surface at St 2, the 4–5 cm depth at St 3, between 0 and 5 cm at St 4, between 0 and 7 cm at St 5, and between 3 and 7 cm at St 6. Al-bound P sequestered by the Al floc ranged between 0.88 g/m2 and 4.62 g/m2, and higher Al concentrations were associated with higher concentrations of adsorbed aluminum-bound P ().
Figure 4. Vertical variations in redox-P (i.e., the sum of the loosely-bound P and iron-bound P fractions) and aluminum-bound P concentrations measured at various stations in 2016.
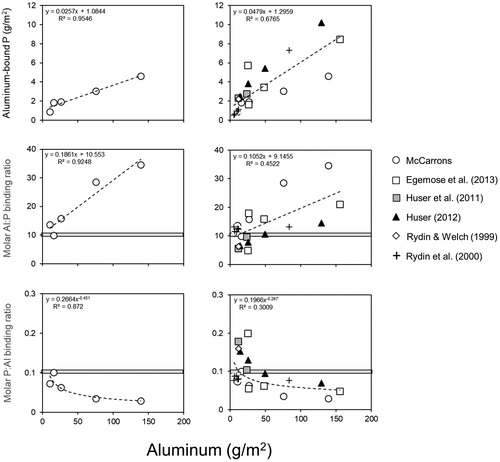
The molar Al:aluminum-bound P binding ratio (i.e., Al:P, stoichiometric binding ratio between Al and aluminum-bound P), varied between 10:1 and 35:1 (). In addition, Al-bound P and the molar Al:P binding ratio increased linearly as a function of increasing added Al concentration (). For instance, the molar Al:P binding ratio approached 10:1 at stations exhibiting the lowest added Al concentration (i.e., St 2, St 3, and St 4). The molar ratio exceeded 25:1 at St 5 and was 35:1 at St 6 in conjunction with high added Al concentrations (). For comparison with de Vicente et al. (Citation2008a, Citation2008b), the molar P:Al ratio varied negatively as a function of increasing added Al concentration (). These patterns suggested that (1) the Al:P binding ratio was lower (i.e., greater P binding efficiency and P saturation) at lower added Al concentrations and (2) while the Al:P binding ratio increased as a function of higher added Al concentrations (i.e., lower P binding efficiency and P subsaturation) there was nevertheless an overall greater concentration of P bound to the Al floc at these higher added Al concentrations.
Figure 5. A comparison of relationships between sediment aluminum and aluminum-bound phosphorus (P, upper panels), the molar aluminum:aluminum-bound P (Al:P) binding ratio (middle panels), and the molar P:Al ratio (lower panels) for Lake McCarrons sediments (left) and other lakes (right, Egemose et al. Citation2013, Huser Citation2012, Huser et al. Citation2011, Rydin and Welch Citation1999, Rydin et al. Citation2000).
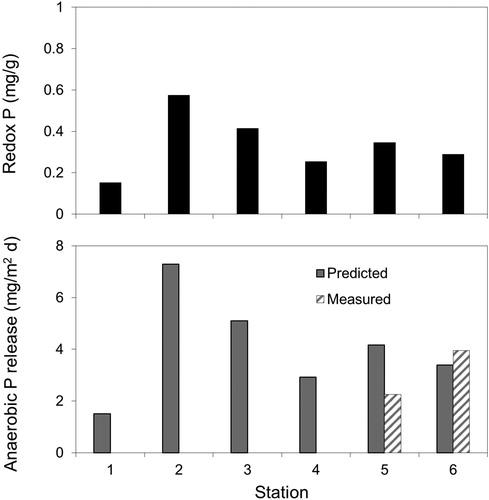
Assuming that burial of the Al floc layer with new sediment has occurred over time, ranges in the concentration of redox-P in the upper 1-cm sediment layer suggested that recently deposited P was likely beginning to contribute to internal P loading (). Surface redox-P was lowest at St 1 (0.153 mg/g), highest at St 2 (0.574 mg/g), and averaged ∼0.33 mg/g at other stations. The overall surface mean redox-P concentration of 0.34 mg/g is currently moderate and similar to the pretreatment redox-P concentration of 0.35 mg/g determined by Pilgrim et al. (Citation2007). Using regression equations developed by Nürnberg (Citation1988) between iron-bound P and the anaerobic P release rate ([redox-P × 13.72] – 0.58), predicted values ranged between 1.5 and 7.3 mg/m2/d and were comparable to measured anaerobic diffusive P fluxes (). The mean predicted anaerobic P release rate over all stations was 4.1 mg/m2/d. In addition, the anaerobic diffusive P flux of 2.3 mg/m2/d measured at St 5 in 2016 was similar to the pretreatment rate of ∼2 mg/m2/d measured in 2003 (Pilgrim et al. Citation2007), suggesting that burial of the Al floc with new redox-P over a 12-yr period has resulted in recovery of internal P loading.
Figure 6. Variations in redox-P (i.e., the sum of the loosely-bound P and iron-bound P fractions) in the surface sediment (upper panels) and predicted (Nürnberg Citation1988) and measured anaerobic diffusive P flux at various stations in Lake McCarrons.
Discussion
In contrast to other findings, Al floc redistribution in Lake McCarrons appeared to be mostly related to maximum fetch along the NW–SE wind rose versus depth (Huser Citation2012, Egemose et al. Citation2013). Added Al concentrations were lowest to negligible in NW areas and highest in SE areas of the lake bottom, regardless of depth. Indeed, added Al concentrations were lower in the deep basin (St 2 and St 5) than at shallower St 6 in the SE area. These patterns suggested that perhaps horizontal currents and water movement during the typically windy October and November period transported some of the Al floc horizontally during application or shortly after initial deposition. Al floc density is initially very low, close to that of water (Huser Citation2012, James Citation2017), and therefore very susceptible to water turbulence and wind-generated movement at low shear stresses (Egemose et al. Citation2009).
Apparent deposition of sediment on top of the Al floc over the past 12 yr also followed the same spatial pattern as the distribution of added Al concentrations. For instance, added Al maxima were still located near the sediment surface at St 2, St 3, and St 4 in 2016, and concentrations tended to be spread out and more diffuse over the upper 5 cm, suggesting minor new accretion coupled with downward mixing of the Al floc in the NW area of the lake. In the SE area, well-defined subsurface added Al concentration peaks suggested burial. Some mixing of the Al floc with new and redistributed sediment has likely occurred in this region, as indicated by the occurrence of gradients of lower added Al concentrations immediately above these Al maxima. Sediment resuspension and transport along the prevailing NW–SE wind rose and maximum fetch could explain these unusual spatial and vertical patterns in Al, but more information is needed to better understand these distributional patterns.
Vertical variations in sediment physical–textural characteristics further suggested that the Al floc located in the SE basin has been buried with sediment. Interestingly, sediment moisture content was highest (∼95% to 98%), while wet bulk density (1.01 g/cm3 to 1.02 g/cm3) and solids content were lowest, at the depth of peak added Al concentration, particularly at St 5 and St 6. Moisture content declined while solids content and density increased both below and above the Al floc location. These patterns supported the contention that Al floc density is typically very low in relation to sediment density after application (Huser Citation2012, James Citation2017), resulting in positioning of the floc layer on top of the sediment interface with little sinking or mixing into deeper layers unless physically disturbed by resuspension or bioturbation (Egemose et al. Citation2013). In the case of Lake McCarrons, the low-density Al floc was probably concentrated in the SE basin by wind-induced horizontal water currents, eventually settled on top of the original sediment interface in that area in 2004, and became buried over time by sediment transported to the same area by the similar turbulent processes, resulting in inverted moisture and solids content at 5 cm below the sediment interface at St 5 and St 6.
One year before the 2004 Al application, mean surface redox-P concentrations in the upper 4-cm layer were relatively uniform basin-wide at 0.791 g/m2 (range = 0.767 to 0.814 g/m2) in the deep basin (>12 m) and 0.609 g/m2 (range = 0.445 g/m2 to 0.781 g/m2, n = 4) between the 9- and 12-m depth contours (Pilgrim et al. Citation2007, Barr Engineering 2003 unpubl. data). Al-bound P associated with the Al floc in 2016 was ∼1.1 to 5.8 times higher than pretreatment redox-P concentrations at most stations. Although diffusive flux of P into the Al floc has undoubtedly occurred over time (Lewandowski et al. Citation2003, James Citation2017), the pronounced spatial variations in Al-bound P suggested that other P sources were also sequestered onto the Al floc perhaps shortly after application. For instance, a substantial percentage of this Al-bound P could have originated from the hypolimnion in other areas of the lake during Al floc settling and then become transported horizontally to the SE area. Prior to Al treatment, the lake typically remained partially stratified well into late September through November, with near-bottom hypolimnetic total P and SRP concentrations often exceeding 1.00 mg/L and 0.75 mg/L, respectively, in October (Ramsey County Public Works, Ramsey County Citation2018). SRP concentration gradients also usually extended upward to the top of the hypolimnion and into the metalimnion (i.e., ∼7–8 m), suggesting potential exposure to the Al floc during application. Flux of P from sediment accreted on top of the Al floc may additionally explain the higher Al-bound P concentrations in the SE area of the lake (St 5 and St 6; Lewandowski et al. Citation2003).
At low added Al concentrations to sediments of Lake McCarrons (<27 g/m2, ), the Al:P molar ratio approached 10:1 to 15:1 (P:Al molar ratio ∼0.1), similar to findings of de Vicente et al. (Citation2008a) and Jensen et al. (Citation2015). They suggested that this stoichiometric relationship represented a final P binding saturation ratio and that Al dosage should follow a 10:1 molar ratio. Based on sediment redox-P, the Al dosage of 77 g/m2 for Lake McCarrons should have represented a much higher treatment ratio of ∼100:1 molar if the Al floc had settled evenly over the application area. Thus, uneven Al floc redistribution resulted in areas where the Al dosage was optimal for apparent P binding saturation and other areas that were overdosed at least with respect to sediment redox-P concentrations.
The strong linear relationship between added Al and Al-bound P in Lake McCarrons indicated that higher Al concentrations were associated with greater sequestration of Al-bound P. The molar Al:P binding ratio also increased with increasing added Al, like patterns reported in Huser (Citation2012). At the highest added Al concentration, located at St 6 in Lake McCarrons, the molar Al:P binding ratio was ∼35:1. Compared to other Al-treated lake sediments that had been sampled a minimum of ∼4 yr after alum application, sequestered Al-bound P concentrations tended to be lower, while the molar Al:P binding ratio was higher, relative to added Al concentration in Lake McCarrons (). However, an overall linear pattern of increasing sequestered Al-bound P concentration and molar Al:P binding ratio versus increasing added Al concentration emerged (): namely, although higher Al dose was associated with higher Al-bound P, the binding affinity for P was lower as reflected by a higher Al:P binding ratio. Variability in the linear trend may be due to differences in initial mobile P concentration relative to Al dose. Reasons and underlying mechanisms for these patterns require more research but could be related to several hypotheses: (1) crystallization occurring at higher Al doses due to deficiencies in exposure to P, resulting in less available binding sites (Berkowitz et al., Citation2005, Citation2006, de Vicente et al. Citation2008a), (2) competition for binding sites by other ions and dissolved humic substances at higher Al doses relative to P (Cheng et al. Citation2004, Guan et al. Citation2006, de Vicente et al. Citation2008b), and (3) Langmuir-type decreased binding efficiency as Al additions increase relative to redox-P or mobile P concentration (Huser and Pilgrim Citation2014). We suggest that after 12 yr, molar Al:P binding ratios will probably not decline much further in the SE area of the lake and the Al floc has perhaps reached P saturation or equilibrium as a result of Al overdosing that led to a combination of the processes just described.
While consensus grows that attaining a long-term molar Al:P binding ratio of 10:1 or less in Al-treated sediment is a desired goal, more research is still needed to better understand and refine Al dosing estimation and application strategies to control internal P loading while attempting to maximize Al(OH)3 binding efficiency and capacity. Researchers have suggested using multiple lower Al dose applications over a period of several years to both maximize Al(OH)3 binding efficiency and P saturation and counteract inevitable burial during the process of lake management and reversal of eutrophication (de Vicente et al. Citation2008a, Huser Citation2012). In contrast, increased Al:P binding ratios and decreased binding efficiency and capacity considerations could be factored into estimation of larger, single-application, Al doses.
Lake McCarrons continues to exhibit much-improved limnological conditions since the 2004 alum treatment. Mean summer post-treatment (2005–2016) surface total P (0.018 mg/L) and chlorophyll (4.3 µg/L) are 57% and 67% lower, while Secchi transparency (3.7 m) is 57% greater than summer pretreatment (1988–2004) means (CRWD Citation2017). Annual mean hypolimnetic total P concentrations have steadily increased to ∼0.25 mg/L as of 2016 but still remain well below pretreatment annual means that usually exceeded 0.80 mg/L (CRWD Citation2017). However, additional future Al applications may be necessary for Lake McCarrons for a variety of reasons. Although sediment in NW areas of the lake exhibits optimal molar Al:P binding ratios, the Al floc has become saturated and can no longer control P. Apparent upward diffusion of porewater Fe and P through the saturated Al floc and consequent buildup of surface redox-P has resulted in increased internal P loading potential as suggested by high predicted anaerobic P release rates at St 1, St 2, St 3, and St 4. In the SE area, apparent burial over time of the Al floc with overlying sediment rich in redox-P has also resulted in elevated internal P loading potential and high measured rate of diffusive P flux under anaerobic conditions.
Acknowledgments
We acknowledge the Capitol Region Watershed District (CRWD), St. Paul, MN, for funding this project. Britta Belden, CRWD, provided valuable information and insights that greatly improved this article. We also thank Brian Beck, Wenck Associates, Inc. (currently with the Minnehaha Creek Watershed District), personnel from the Capitol Region Watershed District for sediment core collection, Evan Petska and Lyndsey Provos, University of Wisconsin–Stout, for providing analytical support, and anonymous reviewers for providing valuable comments.
References
- American Public Health Association. 2011. Standard methods for the examination of water and wastewater. 21st ed. Washington (DC).
- Avnimelech Y, Ritvo G, Meijer LE, Kochba M. 2001. Water content, organic carbon and dry bulk density in flooded sediments. Aquat Eng. 25:25–33. doi:10.1016/S0144-8609(01)00068-1.
- Berkowitz J, Anderson MA, Graham R. 2005. Laboratory investigation of aluminum solubility and solid-phase properties following alum treatment of lake waters. Water Res 39:3918–3928. doi:10.1016/j.watres.2005.06.025.
- Berkowitz J, Anderson MA, Amrhein C. 2006. Influence of aging on phosphorus sorption to alum floc in lake water. Water Res. 40:911–916. doi:10.1016/j.watres.2005.12.018.
- [CRWD] Capitol Region Watershed District. 2003. Lake McCarrons Management Plan. January. The Board of Managers, Capitol Region Watershed District, Roseville, MN. http://www.capitolregionwd.org/wp-content/uploads/2012/09/LakeMcCarronsMgmtPlan.pdf.
- [CRWD] Capitol Region Watershed District. 2010. Villa Park Wetland System Management Plan. Prepared for the Capitol Region Watershed District, St. Paul, MN, by Wenck Associates (Wenck File # 1486-14), Golden Valley, MN.
- [CRWD] Capitol Region Watershed District. 2017. 2016 Lakes Monitoring Report. March. Prepared by Capitol Region Watershed District, St. Paul, MN. https://www.capitolregionwd.org/wp-content/uploads/2018/12/Lakes-Report-2016_FINAL.pdf.
- Cheng WP, Chi FH, Yu RF. 2004. Effect of phosphate on removal of humic substances by aluminum sulfate coagulant. J Colloid Interface Sci. 272:153–157. doi:10.1016/j.jcis.2003.08.074.
- Cooke GD, Welch EB, Peterson SA, Nichols SA. 2005. Restoration and management of lakes and reservoirs. 3rd ed. Boca Raton (FL): CRC Press.
- de Vicente I, Huang P, Andersen FØ, Jensen HS. 2008a. Phosphate adsorption by fresh and aged aluminum hydroxide. Consequences for lake restoration. Environ Sci Technol. 42:6650–6655. doi:10.1021/es800503s.
- de Vicente I, Jensen HS, Andersen FØ. 2008b. Factors affecting phosphate adsorption to aluminum in lake water: implications for lake restoration. Sci Total Environ. 389:29–36. doi:10.1016/j.scitotenv.2007.08.040.
- Egemose SG, Wauer G, Kleeberg A. 2009. Resuspension behavior of aluminum treated lake sediments: effects of aging and pH. Hydrobiologia. 636: 203–217. doi:10.1007/s10750-009-9949-8.
- Egemose SG, Reitzel K, Andersen FØ, Jensen HS. 2013. Resuspension-mediated aluminum and phosphorus distribution in lake sediments after aluminum treatment. Hydrobiologia. .701:79–88. doi:10.1007/s10750-012-1258-y.
- Guan X-H, Shang C, Chen G-H. 2006. Competitive adsorption of organic matter with phosphate on aluminum hydroxide. J Colloid Interface Sci. 296:51–58. doi:10.1016/j.jcis.2005.08.050.
- Håkanson L, Jansson, M. 2002. Principles of lake sedimentology. Caldwell (NJ): The Blackburn Press.
- Huser BJ. 2012. Variability in phosphorus binding by aluminum in alum treated lakes explained by lake morphology and aluminum dose. Water Res. 46:4697–4704. doi:10.1016/j.watres.2012.06.005.
- Huser BJ. 2017. Aluminum application to restore water quality in eutrophic lakes: maximizing binding efficiency between aluminum and phosphorus. Lake Reserv Manage. 33:143–151. doi:10.1080/10402381.2016.1235635.
- Huser BJ, Pilgrim KM. 2014. A simple model for predicting aluminum bound phosphorus formation and internal loading reduction in lakes after aluminum addition to lake sediment. Water Res. 53:378–385. doi:10.1016/j.watres.2014.01.062.
- Huser B, Brezonik P, Newman R. 2011. Effects of alum treatment on water quality and sediment in the Minneapolis chain of lakes, Minnesota, USA. Lake Reserv Manage. 27:220–228.
- Huser BJ, Egemose S, Harper H, Hupfer M, Jensen H, Pilgrim KM, Reitzel K, Rydin E, Futter M. 2016. Longevity and effectiveness of aluminum addition to reduce sediment phosphorus release and restore lake water quality. Water Res. 97:122–132. doi:10.1016/j.watres.2015.06.051.
- James WF. 2011. Variations in the aluminum:phosphorus binding ratio and alum dosage considerations for Half Moon Lake, Wisconsin. Lake Reserv Manage 27:128–137.
- James WF. 2017. Phosphorus binding dynamics in the aluminum floc layer of Half Moon Lake, Wisconsin. Lake Reserv Manage. 33:130–142. doi:10.1080/10402381.2017.1287789.
- James WF, Bischoff JM. 2015. Relationships between redox-sensitive phosphorus concentration in sediment and the aluminum:phosphorus binding ratio. Lake Reserv Manage. 31:339–346. doi:10.1080/10402381.2015.1092483.
- Jensen HS, Reitzel K, Egemose S. 2015. Evaluation of aluminum treatment efficiency on water quality and internal phosphorus cycling in six Danish lakes. Hydrobiologia. 751:189–199. doi:10.1007/s10750-015-2186-4.
- Johnson SL, Stefan HG. 2006. Indicators of climate warming in Minnesota: lake ice covers and snowmelt runoff. Clim Change. 75:421–453. doi:10.1007/s10584-006-0356-0.
- Lewandowski J, Schauser I, Hupfer M. 2003. Long term effects of phosphorus precipitations with alum in hypereutrophic Lake Süsser See (Germany). Water Res. 37:3194–3204. doi:10.1016/S0043-1354(03)00137-4.
- Lijklema L. 1980. Interaction of orthophosphate with iron(III) and aluminum hydroxides. Environ Sci Technol. 14:537–541. doi:10.1021/es60165a013.
- Myrbo A. 2008. Sedimentary and historical context of eutrophication and remediation in urban Lake McCarrons (Roseville, Minnesota). Lake Reserv Manage. 24:349–360. doi:10.1080/07438140809354845.
- Nürnberg GK. 1988. Prediction of phosphorus release rates from total and reductant-soluble phosphorus in anoxic lake sediments. Can J Fish Aquat Sci. 45:453–461. doi:10.1139/f88-054.
- Oberts GL, Osgood RA. 1991. Water-quality effectiveness of a detention/wetland treatment system and its effect on an urban lake. Environ Manage. 15:131–138. doi:10.1007/BF02393844.
- Pilgrim KM, Huser BJ, Brezonik PL. 2007. A method for comparative evaluation of whole-lake and inflow alum treatment. Water Res. 41:1215–1224. doi:10.1016/j.watres.2006.12.025.
- Psenner R, Puckso R. 1988. Phosphorus fractionation: Advantages and limits of the method for the study of sediment P origins and interactions. Arch Hydrobiol Biel Erg Limnol. 30:43–59.
- Ramsey County Public Works, Ramsey County. 2018. Lakefinder. https://cf.pca.state.mn.us/eda/stationInfo.php?ID=62-0054-00-101&ORG=MNPCA&wdip=2.
- Reitzel K, Hansen J, Jensen HS, Andersen FØ, Hansen KS. 2003. Testing aluminum addition as a tool for lake restoration in shallow eutrophic Lake Sønderby, Denmark. Hydrobiologia. 506–509:781–787. doi:10.1023/B:HYDR.0000008624.54844.2d.
- Reitzel K, Hansen J, Andersen FØ, Hansen KS, Jensen HS. 2005. Lake restoration by dosing aluminum relative to mobile phosphorus in the sediment. Environ Sci Technol. 39:4134–4140. doi:10.1021/es0485964.
- Rydin E, Welch EB. 1998. Aluminum dose required to inactivate phosphate in lake sediment. Water Res. 32: 2969–2976. doi:10.1016/S0043-1354(98)00055-4.
- Rydin E, Welch EB. 1999. Dosing alum to Wisconsin lake sediments based on in vitro formation of aluminum bound phosphate. Lake Reserv Manage. 15:324–331. doi:10.1080/07438149909354127.
- Rydin E, Huser B, Welch EB. 2000. Amount of phosphorus inactivated by alum treatments in Washington Lakes. Limnol Oceanogr. 45:226–230. doi:10.4319/lo.2000.45.1.0226.
- Schueler T. 2000. Return to Lake McCarrons: Does the performance of wetlands hold up over time? Technical note 102. Watershed Protect Techniques. 3:597–600. https://owl.cwp.org/?mdocs-file=4791.
- Welch EB, Gibbons HL, Brattebo SK, Corson-Rikert HA. 2017. Progressive conversion of sediment mobile phosphorus to aluminum phosphorus. Lake Reserv Manage. 33:205–210. doi:10.1080/10402381.2017.1292333.
- Wenck Associates, Inc. 2016. Sediment characterization for Lake McCarrons and Como Lake. Prepared by Wenck Associates, Inc., Maple Plain, MN. File 1486-0055.