
Abstract
Horne AJ. 2019b. Hypolimnetic oxygenation 4. Effects on turbidity in Camanche Reservoir and its downstream fish hatchery. Lake and Reserve Manage. 36:360–375.
Turbidity is a major concern for reservoir, river, and hatchery managers, partially because sediments smother fish eggs. The oxygenated plume of the Camanche Reservoir hypolimnetic oxygenation system (HOS) is close enough to the sediments to suppress releases of nutrients, hydrogen sulfide, and methylmercury. Experiments and models predicted little sediment resuspension from the plume. On/off in-reservoir tests in the initial year of HOS operation (1993) showed a small (x = 1.4 NTU) and not statistically significant increase in average turbidity that extended over 300 m, was minimal at 1.5 km (0.3 NTU), and was not apparent in the next year (1994). Increased turbidity was attributed to tiny (<2 μm) calcite particles caused by lake whitening during intense periods of photosynthesis during cyanobacterial blooms prior to HOS. Turbidity in the fish hatchery declined substantially (4 to 2 NTU, summer 1991 vs. 1994) and averaged 2.5 NTU in 1999 and 2009. This decline is likely due to the 79% HOS-induced decrease in chlorophyll, because bottom turbidity was related to algae blooms (R2 = 0.57) if lagged by 4 weeks to allow the algae to sink. The result would be less planktonic remains and fewer lake whitening particles sinking to deep water. Microscopic examination, size spectrum analysis, and chemical fingerprinting of particles showed that egg tray sediments (mostly inorganic silica diatom frustules and aeolian dust with an even size spectrum from 0 to 200 μm) were not like those in the reservoir bottom water outflow (mostly organic and <2-μm calcite particles).
Clear water is generally desirable for aquatic life, though some species thrive in muddy water characteristic of major rivers like the Mississippi River. Fish eggs in hatcheries or natural river gravels are especially at risk from suspended sediments since eggs can be smothered and killed. Concern about fish and turbid dam releases is warranted (Ward and Stanford Citation1995, Noh et al. Citation2014) because some reservoirs receive untrammeled stream inflows with turbidities as high as 150 NTU (Blaise and Hollabaugh Citation2006) and lower levels can also be detrimental (OWRB Citation2006). Dilution and settling occur once the stream flows into the reservoir, but effects can still be severe. Dense, cool, turbid flows to reservoirs dip at the plunge point and often flow along the bottom. Such turbidity plumes may exit via deep-water outlets used for power generation or to supply cool water to fish downstream. In shallow reservoirs, large areas may reach 35 NTU following storms (e.g., City of San Diego Citation2006) and wind stirring can increase turbidity in shallow water (Loveless et al. Citation2006). In contrast, drinking-water supply agencies using intakes at mid or upper levels of the hypolimnion generally find acceptable low turbidities of 0.5 to 1.5 NTU that approximate the USEPA drinking water standards of 0.3–1.0 NTU.
Turbidity in reservoir releases also increases during drawdown due to wave erosion of freshly exposed mud (50–400 NTU, Horne et al. Citation1989; 25–50 NTU, Mladenka and van Every Citation2005). The velocity of water in channels causing erosion in drawn-down reservoirs may be like water or air jets from aeration or oxygenation manifolds set above the mud (Engstrom and Wright Citation2002). The bottom water in Camanche Reservoir was anoxic prior to the use of a hypolimnetic oxygenation system (HOS) with large amounts of iron and manganese (Horne and Jung Citation2020). In the deep hypolimnion, turbidity in the well-stratified New Croton Reservoir, NY, averaged 7.9 NTU and was correlated with iron and manganese (NYCDEP Citation2000), suggesting anoxia. Iron flocs from oxygenation of anoxic tail-water discharges are known to be complex and not to obey theoretical laboratory-based kinetics (Ashby et al. Citation2004). The ability of pure oxygenation to substantially affect iron and manganese in North Twin Lake, WA (Dent et al. Citation2014), was supported by work in this series of papers. For a Connecticut storage reservoir, Kortmann (Citation1994) found bottom turbidity (3–19 NTU) under anoxic conditions. Directly related to this study on turbidity are others in the series, especially those on fisheries (Horne Citation2019) and oligotrophication (Horne and Beutel Citation2019)
How does turbidity relate to ecological effects? Turbidity standards vary with geographical region, the species to be protected, and the kind of sediment. Detrimental effects on some fish at 5–10 NTU—well within the range for reservoir bottom waters—have been shown (Newcombe and Jensen Citation1996). At the other extreme, adult salmon swim up to spawn in clear-water streams via glacially influenced rivers where turbidity may reach 300 NTU. Nonetheless, most anadromous fish spawn in clear water. The California numerical standard for fish and wildlife habitat is 20% above natural and not to exceed 10 NTU above natural, while Alaska uses 25 NTU above natural. The authoritative work by Lloyd (Citation1987) suggests that turbidity below ∼23 NTU will provide adequate protection. Turbidity has effects on salmonids, as reviewed by Bash et al. (Citation2001), who cautions that the relationship between total suspended solids and turbidity as measured in NTUs is less than ideal.
Salmon and trout eggs are sensitive to smothering over a long period if the turbidity has an easily settled fraction. The tailwaters from Camanche Reservoir are almost always bottom waters since there is no multiple outlet tower, as is found in many modern reservoirs. The outflow feeds a large Chinook salmon (Oncorhynchus tshawytscha) and steelhead (O. mykiss) hatchery located immediately below the dam, as well as the spawning gravels for wild salmonids in the Mokelumne River. If oxygenation increased turbidity below Camanche Reservoir, the change could provoke legal action by the hatchery operator, that is, the California Department of Fish and Wildlife.
Camanche Reservoir turbidity
Camanche Reservoir is a large water body (513 × 106 m3, 417,000 ac-feet) fed by the Mokelumne River that drains mostly granite rocks of the Sierra Mountains of California. A large salmonid fish hatchery lies immediately below the dam (). The watershed is mostly forest or undeveloped subalpine land. Clay and fine organic particles are not common in the river. Several reservoirs upstream, including a large one (Pardee Reservoir, 244 × 106 m3, 198,000 ac-feet) only 10 km above Camanche, retain larger particles and generally have low phytoplankton (chlorophyll a [Chl-a] < 5 μg/L). Thus, the sediments in Camanche Reservoir were expected to be derived from autochthonous matter such as phytoplankton remains with only a little allochthonous matter.
Figure 1. (a) Mokelumne River fish hatchery: aerial shot from below the dam showing location of the Speece cone on the reservoir bed 180 m from the dam (depth ∼30 m) as well as the reservoir. (b) Diagram of the large Speece cone hypolimnetic oxygenation system used to deliver up to 8 tonnes/d of pure oxygen to the bottom waters of Camanche Reservoir.
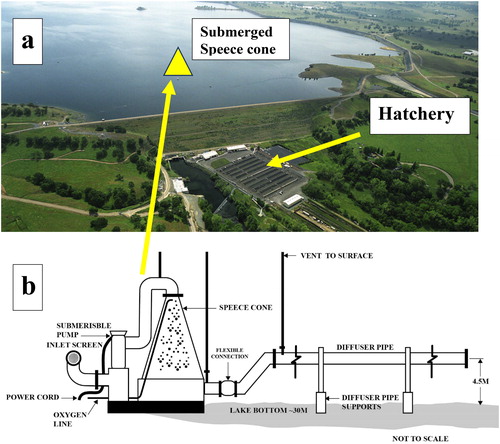
The HOS was installed to prevent fish kills caused by hydrogen sulfide (H2S) generated by anoxic sediments. Three design parameters were vital: (i) delivery of high levels of dissolved oxygen (DO) to the sediments, and (ii) no change in thermal stratification or (iii) turbidity. The HOS consisted of a pure oxygen delivery system via a Speece cone (Horne et al. Citation2019). From the turbidity perspective, the inflow to the cone was via a screened intake pipe down-reservoir from the cone and located about 5 m above the bottom sediments (). The outflowing plume of oxygenated water from the cone was diffused into the hypolimnion via a 65 cm diameter manifold with 150 ports each of 5 cm diameter creating horizontal jets pointed up-reservoir. The water was drawn from the deep hypolimnion by a submersible water pump (0.9 m3/s, 35 cfs). The 45 m long manifold, initially designed to sit 2 m above the sediments, was elevated to 4.5 m (EBMUD Citation1992, Systech Citation1992, Brown and Caldwell Inc Citation1995). The higher manifold elevation reduced efficiency but was justified by fears of increased turbidity and heavy metals from sediment disturbance reaching the hatchery and river. An abandoned copper mine upstream had resulted in increased sediment metal concentrations (Horne and Jung Citation2020).
Turbidity in the supply of water from the reservoir’s deep hypolimnion to the Mokelumne River Fish Hatchery was a concern before HOS was installed. The concerns centered on brown-colored water, foaming, slime growth in the flumes, and particularly sedimentation of a brown film onto eggs in hatching trays. Sediment is particularly important in some egg development stages when the eggs cannot be disturbed so sediment cannot be washed away manually. For effects on fish, oxygen dynamics, eutrophication, and heavy metals and the costs and improvements of operation, see Horne (Citation2019), Horne and Beutel (Citation2019), Horne et al. (Citation2019), Horne and Faisst (Citation2020), and Horne and Jung (Citation2020).
Prior to vigorous aeration before the hatchery, the deep-water inflow water was only slightly cloudy, and the hatchery tray samples a little more so. The main aeration system for the hatchery in the late 1980s to mid 1990s consisted of a very large wooden tank into which the reservoir bottom water flowed. The hydraulic head from the deep hypolimnion supply created a 10 m high fountain that splashed back into to the tank. The DO after this vigorous aeration was at saturation, even when DO in the supply from the reservoir was very low. This system was removed a few years after HOS installation and the feed to the eggs was routed via sand filters. In contrast. most of the inflow to the raceways and holding tanks is not sand filtered. Although sand filtration probably benefited the hatchery eggs, its installation did not occur until at least 1998, well after the work reported here. In addition, river-spawned fish increased along with hatchery-spawned ones following HOS (Horne Citation2019), but the river water volume was too large to ever be sand filtered.
Methods
Turbidity was measured in samples at 4 depths in the hypolimnion (1, 3, 5, and 8 m up from bottom) using a Hach model 2100P nephelometer. These depths would be within the oxygenated HOS plume and in the same region when the HOS was switched off. Samples were taken at 3 sites (T-stations 1–3) close to the Speece cone manifold along a centerline transect perpendicular to the diffuser (). Site T-1 was 100 m down-reservoir from the Speece cone diffuser manifold (i.e., toward the dam and out of the plume), site T-2 was a similar distance up-reservoir, and site T-3 was 300 m up-reservoir. The up-reservoir sites encompassed the area of maximum bed disturbance as calculated by the plume model. Temporal and spatial plume dynamics were calculated with standard hydrodynamic equations and conventional sediment-shear coefficients calibrated to the reservoir contours (Systech Citation1992). Turbidity was also measured at 1500 m and 3000 m up-reservoir of the manifold (). A turbidity meter in the pipeline between the reservoir and fish hatchery gave frequent data (every 30 min).
Figure 2. (a) Map of the 12 km long reservoir showing shallow water (<15 m, dark gray) and the deeper parts and thalweg (light gray). Oxygenation is confined to the deeper area. The approximate location of the Speece cone and dam are shown in heavy black. (b) Map of area of cone and dam in Camanche Reservoir showing turbidity stations T-1 to T-3 (circles with X) used for local effects of the plume. The Speece cone (hatched) was located between T-1 and T-2. The hatchery (diamond) is just below the dam.
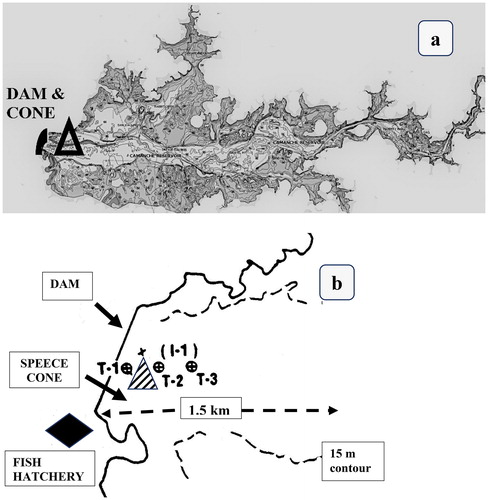
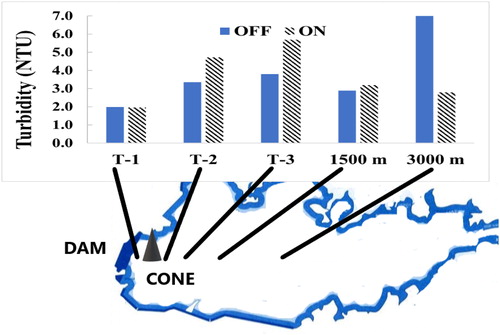
Figure 3. In-reservoir spatial variation in turbidity in bottom 8 m of the water column (i.e., within oxygenated plume) near and distant from the HOS manifold at 5 stations from 16 June–5 Nov 1993, the first year of operation. Hatched bars = HOS on, plain bars = HOS off. Up-reservoir turbidity increases (1.4–1.9 NTU) occurred near the Speece cone. Down-reservoir was unaffected by plume but was homogenized by the cone’s inlet sucking.
Profiles within the HOS oxygenated plumes from 1 m above the bottom to 8 m above the bottom were taken in the reservoir every 2 weeks, but for some on/off tests of the HOS, measurements were taken more frequently. Bottom is defined as the 1 m of water above the sediments determined by the usual practice of “feeling” the bottom when the probe cable slackens, then hauling it back 0.5 m, moving it up and down a few centimeters to free the sensors from any sediment, and allowing half a minute to equilibrate, while also watching the onboard monitor until a stable reading is reached.
Both independent laboratory tests using Camanche Reservoir sediments (Slotton Citation1994) and models using standard water shear-sediment suspensions relationships (Systech Citation1992) showed that shear stress produced by the HOS oxygenated plume should cause no resuspension and thus little or no turbidity from the sediments. Thus, the tests carried out here were somewhat redundant but were required to meet legal agreements to allow HOS installation. The HOS began operation on 23 July 1993, continued until 11 November 1993 and from 2 June to 11 November in 1994, and was used briefly in late October 1995. During these periods, experiments were made with the system off and on for varying times to determine oxygen decay rates and other variables of interest. The HOS has been run continuously every summer–fall since 1995 but later data are not reported here. The tests of HOS (on versus off, ) used profiles sampled on 9 occasions over 3 months in 1993 (T-sites) and 5 occasions (distant sites) giving n = 104. The intervals between the on and off during the HOS tests were of various lengths, ranging from a few days to 5 weeks. The mixing effects of the HOS were determined by examining the depth profile of the various sites and taking averages for the on/off periods. Statistical analyses were made using an Excel t-test program using paired or 2-tailed tests with equal variances assumed or an Excel regression analysis program.
Table 1. Listing of periods of oxygenation and amount added in 1993–1994 during the on/off tests.
In situ studies of sediments and the overlying water particle-rich layer are logistically difficult since sampling can easily disturb thin surface layers (Horne Citation2010, Kogelbauer et al. Citation2013). A firm, oxidized crust can clearly delineate water from sediments, but in shallow, eutrophic Lake George, Uganda, flocculent masses of dead algae and hippo excreta obscure where sediments begin (Burgis et al. Citation1973). Camanche Reservoir lies in between the 2 extremes, with a deep-water turbidity–depth profile having the highest turbidity at the bottom but solid sediments that can be “felt” with typical DO–temperature probes. Examination of the composition of the bottom water layer showed it to be a nephelometric layer since it scatters light measurable by a turbidity meter. The term “nephelometric” or “nepheloid” is the “N” in NTU and has long been used in oceanography to indicate deep-water layers of light-scattering organisms. It was first used in freshwater systems by Moore et al. (Citation2012). The composition of the nephelometric layer in Camanche Reservoir is important since the bottom water is the only outflow under normal conditions. The tailwater discharge is to the Mokelumne River and the large salmonid fish hatchery, which releases about 6 million young fish/yr, is located just below the dam (; Horne Citation2019).
The composition of suspended matter in the nephelometric layer was examined microscopically, by particle size distribution, and by chemical analysis. All samples were kept in the dark, cool and unpreserved. Microscopic examination was within 24 h. Samples from the egg trays were collected at the inflow and bottom of the trays. Samples of the reservoir’s bottom water were collected with a closing sampler about 0.5 m above the sediments as described earlier and examined microscopically at up to ×400 magnification, using phase contrast if needed. Suspended matter including algae cell fragments, zooplankton excreted pellets, zooplankton carapace fragments, and amorphous matter were identified, and their sizes measured. Particle size distribution was measured using a particle counter with 6 ranges between 1–2 μm and 100–200 μm. The chemical signature was used to determine particle sources. For example, the silica cell wall comprises 60% of the dry weight of living and decaying diatoms (range 30–78%, Sicko-Goad et al. Citation1984) but only 28% of typical rocks and mineral soil (Tubana et al. Citation2016). Aluminum and often iron in soils (8% and 5%, respectively; Press and Siever Citation1974, Shacklette and Boerngen Citation1984) are more abundant than in lake sediments (Fe 3.6% Al 0.5%; Prairie Citation2005, ERI Citation2017). Particles were assayed for 20 elements (Ag, Al, Ba, Ca, Co, Cr, Cu, Fe, Li, Mn, Mo, Ni, Pb, Sc, Se, Si, Sr, Ti, V, Na), but only the 8 most abundant were chosen for use here. The percentage of volatile (organic) suspended solids relative to total suspended solids was used to distinguish between organic and inorganic particles.
Results
In-reservoir bottom plume
During the first year of HOS operation (1993), experimental on/off studies were carried out. There was a small increase in depth-averaged turbidity in the plume during HOS operation and a decrease when switched off (). Similar changes were not found in the next 2 years of HOS operation. The increases in 1993 were most pronounced in the 300 m close to the Speece cone manifold but were detectable for more than 1500 m but less than 3000 m up-reservoir. On average, turbidity at the up-reservoir, in-plume stations within 300 m of the HOS increased by 1.4 NYU, while that at 1500 m showed an increase of 0.3 NTU. None of the changes in average turbidity (HOS off vs. on) at the 5 stations within 3000 m of the Speece cone were statistically significant (n = 36 for T-stations, n = 20 for the distant stations, t-test, 2-tailed paired sample p = 0.000132; ) Nonetheless, the differences were probably real since all increase and decreases were in the same direction. In contrast, the station at 3000 m showed a substantial and statistically significant decrease in turbidity of 4.9 NTU compared with when HOS was off (n = 20; 2-tail, eq var p 0.006425). The T-1 station located 100 m down-reservoir from the Speece cone also showed no increase in turbidity with HOS plume outflow (). These changes in turbidity occurred against a background of considerable variation in the bottom 8 m of the hypolimnion in both space and time in 1993 (0.4 to 13.6 NTU), but less so in later years.
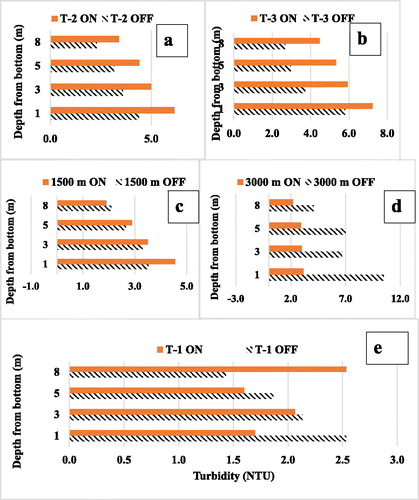
The vertical distributions of turbidity increases at each depth at the 3 of the 5 stations up to 1500 m and influenced by the oxygenated plume were similar. There was a general, if small, increase in turbidity that maintained the typical unmodified water column gradient of lowest at the top and highest at the bottom (). At the most distant station at 3000 m, it is likely that other mechanisms were affecting turbidity, which was always lower when the HOS was on and where a gradient from top to bottom was not consistent (). The T-1 station lies between the cone and the dam but down-reservoir from the oxygenated plume, which was directed up-reservoir away from the cone. In contrast to the other stations, T-1 was apparently homogenized not by the Speece cone outflow plume but by the inflow to the cone (). When the HOS was not in operation, the seasonal average for the bottom 8 m turbidity–depth profile at T-1 was typical of most lakes and reservoirs with higher turbidity near the bottom (hatched bars).
Figure 4. In-reservoir turbidity depth profiles for bottom 8 m of water at the 5 stations shown in and 3 from 16 Jun to 5 Nov 1993, the first year of operation of HOS. Hatched = HOS on, plain bars = HOS off. (a–d) Stations within plume showing increased turbidity with HOS on and declining turbidity when off. Effect was greater near the cone, fading away between 1.5 and 3 km down-reservoir. (e) Site T-1 out of the plume with inversion of normal increase in turbidity with depth, probably caused by the sucking effect of the cone inlet pump.
Hatchery supply
The response to the on/off tests of HOS found for the hatchery and river supply via the tailwaters reflected that found in the reservoir. There was a marked effect in the first year of operation but no effects in later years. In 1992 (pre-HOS) there was a large increase in turbidity starting in May (2.8 NTU), reaching about 7.5 NTU in June and then falling to about 2 NTU in August, where it remained for the rest of the season (). In 1993 (first HOS use), the turbidity pattern was different. Turbidity was initially very low (0.5–1 NTU) until the first use of HOS in mid July 1993 (). The on/off sequences that followed in the rest of that year showed a rise in turbidity to 6.8 NTU (30 Aug, HOS on) and 5.3 NTU (30 Sep, HOS on) with a drop to 3.2 NTU in between (HOS off). In the second year of HOS operation in 1994, turbidity in spring was like the previous year (0.8 NTU) and rose to 2.9 NTU in 14 July which was a muted version of the pre-HOS 1992 pattern. After this peak, turbidity fell to 1.8 NTU (13 Aug) and then fluctuated between 1.3 and 2.6 NTU for the rest of the year (). There was no indication of any effect on turbidity of the 1994 HOS on/off tests.
Figure 5. Hatchery turbidity. (a) Startup year (1993 dashed line, squares) and pre-HOS (1992, solid line, crosses). (b) After 2 years of HOS operation (1994, dashed line, squares) and pre-HOS (1992, solid line, crosses). (c) Minimal HOS use in late Oct only (1995 dashed line, squares) and pre-HOS (solid line, crosses).). One season of HOS was required to reduce overall turbidity with the main effect in spring–summer. The autumn increase in turbidity in the startup year was eliminated in the second year (1994) but returned in 1995 when HOS was not used (anoxia occurred and nutrient increased; Horne and Beutel Citation2019).
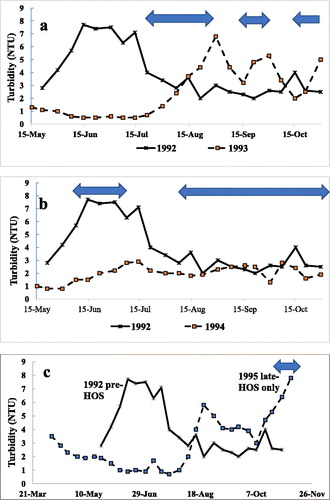
Similar results occurred in 1995 when HOS was not used until late October, just before overturn. The reason HOS was so delayed was to test whether HOS was no longer needed after 2 seasons (1993–1994). In 1995, turbidity in mid May (2 NTU) was comparable with other years, and then turbidity fell to 0.9 NTU (30 Jun) with only a small rise to 1.7 NTU in early July, falling rapidly to 0.7 NTU a week later (). At this point this non-HOS year diverged from the full HOS year previously. Instead of oscillating around a low turbidity, the 1995 data show a large increase to 5.8 NTU (21 Aug), and turbidity remained above 3 NTU for the rest of the season. The sediments became anoxic and nutrients were released (Horne et al. Citation2019), which caused an algae bloom and presumably increased sediment deposition and bottom turbidity.
The most important finding for the hatchery was a substantial reduction in long-term turbidity when the HOS was operated (, ). In 1991, 2 years before HOS, the mean hatchery inflow turbidity during 15 May−30 October was 4.0 NTU. Turbidity for the same periods when HOS was used was 2.5 NTU (1993, standard deviation = 1.9, n = 21) and 2.0 NTU (1994, standard deviation = 0.6, n = 22). The difference between turbidity at the hatchery in 1992 and 1994 was statistically significant (P = 0.00013, n = 43, t-test, 2-tailed paired sample). Six years later, in 1999, turbidity in the Mokelumne River below Camanche Dam averaged 2.5 NTU between May and July (Vogel and Marine Citation2000, n = 15), and the same value was recorded between May and July 2009 (n = 35), indicating a continued reduction (Boyd Citation2010, ). This late spring–summer period showed historically the highest turbidity in the bottom water of the reservoir and thus the supply to the river and hatchery ().
Figure 6. Hatchery. Short-term trends in turbidity in the fish hatchery inflow: a week in summer 1991 (2 years before HOS; solid line) and much lower values for the same summer week in second year of HOS in 1994 (dashed line, n = 26).
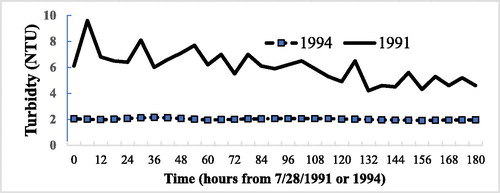
Table 2a. Decline in turbidity after HOS during the thermally stratified period, Average in bottom 8 m of the reservoir close to tailwater outlet 1991–1995 and in the fish hatchery or river, both fed by tailwaters (1991–2009).
Table 2b. Decline in turbidity after HOS during the thermally stratified period, Peak at hatchery 1991–1994.
Peak turbidity is important at the fish hatchery since the egg trays and the hatchery runway tanks can act as sediment traps. Over the longer term of the thermally stratified period, peak turbidity at the hatchery was reduced by almost half (42%, ). In the 2 years prior to oxygenation, turbidity ranged from 3 to 10 NTU, while in the 2 years with oxygenation, peak turbidity ranged from 0.4 to 6.8 NTU. The main drop in turbidity at the hatchery occurred between May and mid August, a time when DO in the nephelometric layer sediments was falling but not zero (Horne et al. Citation2019).
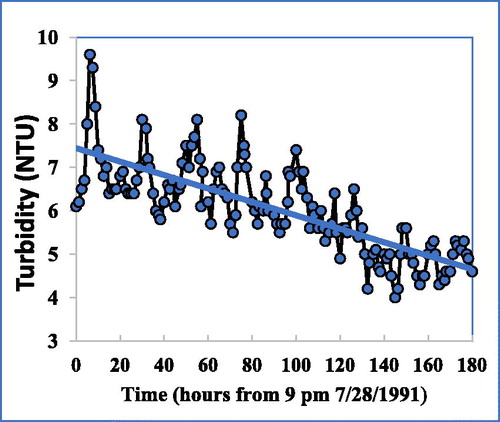
One confounding factor for fully clear interpretation of the data was that turbidity was quite variable, even prior to HOS. In 1991, 2 years before HOS, the hatchery supply showed both a short-term periodicity in turbidity ( = 11.9 h, cause unknown) and a longer term decline (). The cause of the latter may be related to sunken algae bloom debris and concomitant small calcite particles, discussed in the following.
Figure 7. Hatchery. Periodicity in turbidity ( = 11.9 hrs.) and longer-term decline in turbidity in the hatchery supply over one week in summer before installation of HOS (R2 = 0.6, n = 125), showing considerable inherent variations.
Turbidity relative to algae blooms
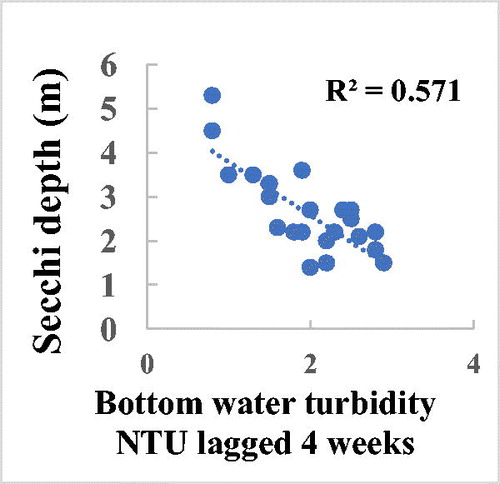
Sinking phytoplankton or associated particles from recent surface blooms appear to play a major role in nephelometric bottom water turbidity in Camanche Reservoir. The seasonal cycle of the phytoplankton in most surface waters is paralleled by changes in Secchi depth (Horne and Goldman Citation1994). In 1994, the second year of HOS operation, Secchi depth varied from 7 m in early spring blooms to 2 m in summer blooms, with a short “clear water” period of 5 m in June (Horne and Beutel Citation2019). The Secchi depth decreased from 5 m to 1.4 m in mid summer and then up to 3.5 m for the fall bloom in late October (). These fluctuations were generally paralleled by rises and falls in bottom water turbidity measured in the reservoir tailwater supply to the hatchery (). Turbidity in the fish hatchery was related to the changes in Secchi depth if lagged by about a month to allow the phytoplankton to die and sink ().
Figure 8. Hatchery. Variation in turbidity and water clarity (Secchi depth) for May–October 1994, the first full year of operation.
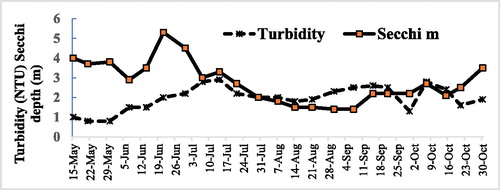
Figure 9. Hatchery. Regression of Secchi disk depth (algae blooms) and surface water turbidity between May and Oct 1994 lagged by 4 weeks (to allow the algae to die and sink to the bottom, R2 = 0.57, n = 43, p = 0.002926).
Microscopic, size spectrum, and chemical analysis
Particles in the hatchery supply control turbidity. Microscopically visible particles from the nephelometric layer in the deep hypolimnion and from the hatchery had many similarities and a few differences. The similarities were a common background of large amorphous particles of 20–150 μm diameter with some 2 to 4 μm red or black inclusions. The differences were that egg trays contained microscopically visible vegetation fragments of aeolian (wind-blown) origin, moribund colonies of the common Camanche Reservoir diatom Fragilaria (about 100 μm long) with intact cell contents, and a few pennate diatoms. No such moribund Fragilaria colonies were found in the reservoir deep water nephelometric layer.
The particle size spectra for the nephelometric zone water near the HOS manifold, 1.5 km up-reservoir, and the hatchery inflow were similar (). All sites were dominated by very small particles (0–2 μm) with decreasing numbers of larger particles, almost none >60 μm.
Figure 10. Particle size spectrum showing similarity in neritic layer particles from 2 sites in Camanche Reservoir. There were few particles above 80 µm except for those that had accumulated in the egg trays.
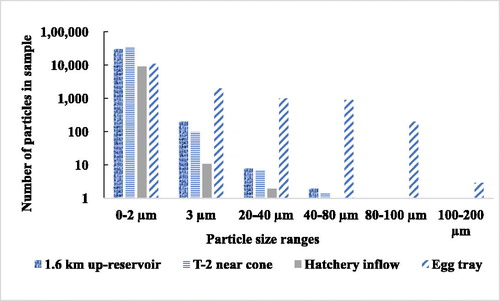
The size spectra for the hatchery sediments were very different from those in the nephelometric zone and hatchery inflow water. The egg trays and troughs had larger particles with an almost even distribution throughout the spectrum up to 100 μm (, hatched bars), including a few very large particles (100–200 μm). The hatchery particle size distribution indicates that it was the occasional rare larger particles in the inflow water that dropped out in the hatchery and not the common small particles. The size range of the zooplankton fecal pellets fragments found in the egg trays in November 1993 (larger algae, both centric and Fragilaria diatom chains), as well as most colonial phytoplankton in Camanche Reservoir, was from 20 to 100 μm.
Like the particle size spectrum and the microscopic examination, the egg tray sediments were chemically different from the samples collected in nephelometric zone in deep water in the reservoir or the hatchery inflow. The most obvious difference was the low percentage of organic matter in the egg trays and troughs (11%) as compared with the deep-water reservoir suspended solids (67–86%; ). This would make sense, since the lighter organic matter would pass over the eggs and flow away while the heavier mineral matter would sink onto the eggs. The suspended sediments from the deep hypolimnion and hatchery inflow also had a distinctly different chemical “fingerprint” than did sediment from the egg tray and troughs (). Silica had the highest percentage composition (28–38%) and was like soil. Sediments from the egg trays showed higher silica (37–38%) than the influent samples or hypolimnion nephelometric zone proto-sediments (28–35%). Sediments from the egg trays possessed much more aluminum but less iron and potassium than the other samples ().
Figure 11. Percent elemental composition of Camanche Reservoir neritic zone particles showing the 8 most common elements during HOS operation. The egg tray sediments (far left bars) bear little resemblance to the suspended matter from the hatchery inflow (second from left), or the deep-water matter either at the site near the Speece cone (third from left) or from a central reservoir site (far right bar). Hatch = fish hatchery.
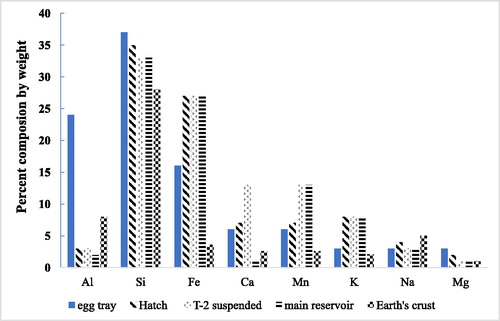
Table 3. Chemical analysis (in ppm) of organic matter and silica in neritic zone particles from the fish hatchery, suspended sediments from the influent to the hatchery, and deep water of Camanche Reservoir in November 1993 during oxygenation. TSS = total suspended solids, VSS = volatile suspended solids (organic matter).
Nephelometric sediments were also distinguished by higher calcium content (27–29%) when compared with only 6% in hatchery sediments. This trend was similar, but less apparent in 1994 (31–36% versus 18–23%). High calcium is characteristic of soft surficial lake sediments (Table 3.7 in Brock Citation1985). Together with the higher magnesium content and small size (0–2 μm), the chemical composition of the nephelometric particles indicates the presence of tiny imperfectly formed crystals of magnesium calcite. Such material is often found in lake sediments (Schroll Citation1979) and can cause lake whitening.
The large percentages of volatile solids (60–85%) in the nephelometric hypolimnion samples indicates considerable organic matter, as was found by microscopic examination. Organic matter in lakes is often found adsorbed onto inorganic particles such as calcite, and the nephelometric zone sediments may contain this type of mixture. The chemical analysis agrees with conclusions from the particle size spectrum and microscopic examination that the hatchery sediments were a mixture of dead planktonic diatoms, terrestrial dust, and mineral particles.
Moribund algae particles
Phytoplankton fragments were the second most common fraction in the suspended sediments after 20–60 μm amorphous particles. The most common species found in the hatchery egg trays were the colonial pennate diatom Fragilaria and the colonial filamentous centric diatom Aulacoseira (). Hundreds of millions of these algae cells per liter were found in the egg tray slurries, compared with only hundreds of thousands of cells per liter in the deep waters of the hypolimnion (). These cells were examined in fresh samples in summer 1994 and were found to be moribund, sunken remains of that spring’s phytoplankton bloom. The large, heavy diatoms sank out and remained in the hatchery trays to become concentrated a thousand-fold as water continually passed over the eggs.
Table 4. Algae (cells/L) in sediments from the fish hatchery and neritic zone particles from the deep-water hypolimnion of Camanche Reservoir on 1 Jun 1994.
Discussion
All methods of getting oxygen down to the sediments involve some mixing. In stratified waters, the most mixing occurs with pipes laid directly on the sediments and least when manifolds are set several meters above the bottom. Because a quiescent bottom boundary layer occurs below a suspended manifold or other jet producer (Moore et al. Citation1996, Horne et al. Citation2003), less oxygen is delivered directly to the critical sediment–water interface. Since higher oxygen concentrations over the sediments mean lower amounts of phosphate, ammonia, toxic H2S, and especially methylmercury released from the mud (Beutel Citation2006), the ideal location of the manifold is directly on the bottom. Thus, there is a potential trade-off between turbidity increase and contaminant decrease. If control of the release of pollutants from the sediment is the objective, then the closer oxygenated plume is to the bottom, the better. On the other hand, placing manifolds or directing jets too low can lead to too much turbidity as a result (Mobley et al. Citation2000). Uncertainly about the sediment stirring also prevents realistic comparison between methods, sometimes giving poor performance and increased costs for the engineering design of all kinds of hypolimnetic aeration, oxygenation, or propeller mixing systems. However, little is ever said in print. A review by the current author of more than 100 archival papers, reports, and commercial literature on mixing, aeration, or mixing found few concerning turbidities. One of these, Engstrom and Wright (Citation2002), showed no differences between aerated and non-aerated lakes using long-term sediment accumulation. There is currently a debate about the reduction of large amounts of (nonsuspended) sediments with oxygenation and aeration.
Unexpected turbidity increases due to HOS
The hydrodynamic HOS plume model (Systech Citation1992) calculated a maximum bottom velocity of 8 cm/s (0.31 ft/s) at around 60 m from the manifold. The equivalent maximum shear stress on the sediments had values of 0.24 dynes/cm2 at 30 m, <0.1 dynes/cm2 at 120 m, and 0.03 dynes/cm2 at 600 m from the oxygenation manifold. The smallest current that can scour noncohesive particles is 19 cm/s (Hjulstrom–Sundborg transport–sedimentation diagram, Earle Citation2015), which can be compared with the maximum of 8 cm/s from the oxygenation manifold jets. Very small particles that might be expected to be scoured by gentle currents are usually modeled as larger particles because they are assumed to be cohesive like clay particles. Separate laboratory experiments showed that undisturbed deep sediments collected in Camanche Reservoir required a shear stress of 0.8 to 2.0 dynes/cm for resuspension (Slotton Citation1994). Professor Gregg Lawrence in Newman Lake, WA, determined that the critical velocity for scouring by a Speece cone was 13 cm/s (0.5 ft/s; Moore et al. Citation1996), again above the maximum value of 8 cm/s calculated for Camanche Reservoir.
Despite the tests just described, the reservoir data in the first year of operation of HOS, though not in later years, clearly showed a small, increase in turbidity in the oxygenated plume over large sections of the bottom water up to 1500 m, at least. The most likely explanation is the resuspension of very small calcite particles (1–2 μm diameter), which dominated the deep-water particle counts and microscopic observations in Camanche Reservoir. Such particles are commonly produced in lakes during intense photosynthesis when algae blooms occur (Horne and Goldman Citation1994, p. 43, Thompson et al. Citation1997) and are called “lake whitening” events. Particle size measurements from lake whitening events have been extensively studied in Lake Michigan (Strong and Eadie Citation1978). These studies showed that particle size averaged 3.7 μm (range 3.1–4.9; Effler and Peng Citation2014), 1–10 μm (Peng and Effler Citation2011), and 7 μm (range 2–16; Vanderploeg et al. Citation1987). The calcite particles measured in Camanche Reservoir are within the range of the reported values for hardwater lakes, though at the lower end of the range. Being so small and presumably not yet cohesive, they could be stirred up by the oxygenated plume.
Most lake whitening work has been on hardwater lakes like Lake Michigan (hardness ∼170 mg/L CaCO3) and Cayuga Lake NY (hardness ∼70 mg/L). Camanche Reservoir is a softwater reservoir (<20 mg/L CaCO3), so whitening events might not be anticipated. Conditions needed for whitening are high chlorophyll and intense algal photosynthesis (often shown as a very high pH). In 1991–1992 the peak surface Chl-a in the pre-HOS Camanche Reservoir ranged between 45 and 49 μg/L, almost double the boundary of 25 μg/L used to distinguish the “hyper-eutrophic” category (Cooke and Welch Citation2008). It is also well above that in Lake Michigan (peak Chl-a 5–10 μg/L, Lesht et al. Citation2002). In July–September 1991, the surface water pH for the pre-HOS Camanche Reservoir ranged from 9.5 to 9.8, indicating intense photosynthesis that promotes calcium precipitation when CO2 is depleted from dissolved calcium bicarbonate. In contrast, the modern Camanche Reservoir after 21 years of HOS shows a mid-September surface water pH of only 8.1. Thus, most conditions were suitable for whitening prior to HOS. Further investigation of softwater whitening is needed to confirm the previous assumptions (Thompson et al. Citation1997).
After being mixed up through the plume by HOS, the resuspended sediments sank back to the bottom within 18 d (0.2 m/d from mid plume). This is faster than the expected rate of sinking for the <2 μm particles that dominated the bottom waters. The sinking rates of very small particles in real aquatic situations are hard to measure and most small particles captured in sediment traps have agglomerated to much larger sizes. Some of the best simulated field measurements include that for a 3.8 μm diameter unicellular algae where the sinking rate was 0.071 m/d (Bach et al. Citation2012). If this approximates the sinking in Camanche Reservoir (∼1.3 m between HOS off/on sequences), it will give a rate 3 times less than the required rate of 4 m from plume center to bed. Nevertheless, the calcite particles in the reservoir are heavier than algae and also could be in an agglomerated form due to the dissolved organic matter and other charged particles, so they would sink faster. However, both the calcite and organic particles would be negatively charged, so agglomeration would not be simple. The mixing in the oxygenated plume would be expected to be gentler than the standard particle counter, which would separate loose agglomerations (Bach et al. Citation2012). If the increases in turbidity with HOS operation in 1993, but not in other years, was most likely due to mixing of accumulated small lake whitening calcite particles, they would be at a maximum in 1993 after 1 or more years of dense algae blooms but would be much reduced after the reduction in algae that occurred in 1993, the first year for decades that the sediments remained oxygenated all year. This scenario agrees with the finding in Camanche Reservoir reported here.
Chemical composition of the particles
The chemical composition of the Camanche Reservoir proto-sediments can be compared with those from a European lake, Neusiedlersee. Although the Neusiedlersee sediments had more calcium (52%) and less silicon (21%) than the Camanche nephelometric sediments (Ca = 27%; Si = 33%), these 2 elements dominated both samples. Calcite crystals are often made of larger aggregates or crystals of pure calcium carbonate and are one component of the “lake whitening” mentioned earlier.
Conclusions
In the first year of HOS only, the hypolimnetic oxygenation system (HOS) produced small but unexpected increases in turbidity (∼1.4 NTU) in the bottom water within the oxygenated plume for at least 1.5 km but <3 km, much of the reservoir. Turbidity fell rapidly when the HOS was switched off. The effect may be due to resuspension of very small lake-whitening calcite particles formed during the intense photosynthesis of the dense cyanobacterial blooms prior to HOS.
The annual turbidity in water supplied from the hypolimnion to the Chinook salmon fish hatchery halved after HOS. The decline was probably due to a 79% decline in phytoplankton and associated lake-whitening particles.
The main turbidity in the nephelometric deep water layer in Camanche Reservoir was due to tiny calcite particles with a few larger moribund algae. The sediments that threatened to smother fish eggs in the hatchery were larger and/or dominated by aeolian dust and large diatom frustules that settled while the small particles passed through the hatchery.
Acknowledgments
I thank the field crews of both Brown & Caldwell Consulting Engineers, Walnut Creek CA and EBMUD. I very much thank Associate Editor Chris Holdren and reviewers Benjamin Cross, Barry Moore, and others for providing essential hep with this article.
References
- Ashby SL, Faulkner SP, Gambrell RP, Smith BA. 2004. Assessing iron dynamics in the release from a stratified reservoir. Lake Reserv Manag. 20(1):65–75. doi:10.1080/07438140409354101.
- Bach LT, Riebesell U, Sett S, Febiri S, Rzepka P, Schulz KG. 2012. An approach for particle sinking velocity measurements in the 3-400 μm size range and considerations on the effect of temperature on sinking rate. Mar Biol. 159 (8):1853–1864. doi:10.1007/s00227-012-1945-2.
- Bash J, Berman C, Bolton S. 2001. Effects of turbidity and suspended solids on salmonids center for streamside studies. University of Washington. Nov 2001.
- Beutel MW. 2006. Inhibition of ammonia release from profundal sediments in lakes using hypolimnetic oxygenation. Ecol Eng. 28(3):271–279. doi:10.1016/j.ecoleng.2006.05.009.
- Blaise JB, Hollabaugh CL. 2006. Variations in turbidity and nutrients in the Tallapoosa and Chattahoochee watershed of West Georgia. Geogr Soc Amer. Abst 38:32.
- Boyd SR. 2010. Monitoring emigration of juvenile Chinook salmon and steelhead in the Mokelumne River Dec 2008-Jul 2009. East Bay Municipal Utility District. Lodi, CA.
- Brock TD. 1985. A eutrophic lake: Lake Mendota, Wisconsin (NY): Springer-Verlag.
- Brown and Caldwell Inc. 1995. Camanche reservoir oxygenation demonstration system: Report on operation 1993/94 Prep. by Brown & Caldwell, AHA, and Biosystems Analysis Inc. for EBMUD, Oakland CA.
- Burgis MJ, Darlington JP, Dunn IG, Ganf GG, Gwahaba JJ, McGowan LM. 1973. The biomass and distribution of organisms in Lake George, Uganda. Proc R Soc Lond, B, Biol Sci. 184(1076):271–298. doi:10.1098/rspb.1973.0049.
- City of San Diego 2006. Report on conditions at Lake Hodges, CA.
- Cooke JD, Welch EB. 2008. Eutrophication of Tenkiller Reservoir, Oklahoma and effects on water quality and fisheries. Expert Report for State of Oklahoma Case No. 05-CU-329-GKF-SAJ. Oklahoma City OK. 62 p + Appendices.
- Dent SR, Beutel MW, Ganzer P, Moore BC. 2014. Response of methylmercury, total iron, and manganese to oxygenation of an anoxic hypolimnion in North Twin Lake, Washington. Lake. Reserv Manag. 30:119–130. doi:10.1080/10402381.2014.898350.
- Earle S. 2015. Physical geology. https://opentextbc.ca/geology/hjulstrom-sundborg-diagram.
- EBMUD 1992. Bid document for HOS. Camanche Reservoir Hypolimnetic Oxygenation Facility Nov 1992. East Bay Municipal Utility District, Oakland CA.
- Effler SW, Peng F. 2014. Long-term study of minerogenic particle optics in Cayuga Lake, New York. Limnol Oceanogr. 59(2):325–339. doi:10.4319/lo.2014.59.2.0325.
- Engstrom DR, Wright DI. 2002. Sedimentological effects of aeration-induced lake circulation. Lake Reserv Manage.18(3):201–204. doi:10.1080/07438140209354149.
- ERI 2017. Lake Rotorua and Lake Rotoehu: total and non-crystalline aluminum content in bottom sediments Envir Res Inst Rept No. 89. Univ Waikato, Hamilton New Zealand.
- Horne AJ. 2019. Hypolimnetic oxygenation 1. Win-Win solution for massive salmon mortalities in a reservoir tail-water hatchery on the Mokelumne River, California. Lake Reserv Manag. 35 (3):308–322. doi:10.1080/10402381.2019.1649770.
- Horne AJ, Beutel M. 2019. Hypolimnetic oxygenation 3. An engineered switch from eutrophic to a meso/oligo-trophic state in a Californian reservoir. Lake Reserv Manag. 35 (3):338–353. doi:10.1080/10402381.2019.1648613.
- Horne AJ, Faisst W. 2020. Hypolimnetic oxygenation 6. Costs of installation and operation, improvement in fisheries, hydropower, and drought management. Lake Reserv Manag. Forthcoming.
- Horne AJ, Goldman CR. 1994. Limnology. 2nd ed. New York (NY): McGraw-Hill.
- Horne AJ, Jung R. 2020. Hypolimnetic oxygenation 5. Reductions in heavy metals in the reservoir downstream of an abandoned copper mine following HOS. Lake Reserv Manag. Forthcoming.
- Horne AJ, Jung R, Lai H, Faisst B, Beutel M. 2019. Hypolimnetic oxygenation 2. Oxygen dynamics in a large reservoir with submerged downflow contact oxygenation. Lake Reserv Manag. 35 (3):323–337. doi:10.1080/10402381.2019.1648612.
- Horne AJ, Roderick-Jones R, Toms C. 2003. The 2002 oxygen bubble plume HOS in Upper San Leandro Reservoir: Effectiveness for internal nutrient load reduction and effect on benthic taste and odor-causing blue green algae Rept. to EBMUD Oakland, CA.
- Horne AJ, Trihey EW, Baldridge JE. 1989. Bridgeport Reservoir Drawdown Study Rept. for Walker River Irrigation District, Yerington NV.
- Horne AJ. 2010. Three special studies on nitrogen offsets in semi-desert Lake Elsinore in 2006-08 as part of the nutrient TMDL for reclaimed water added to stabilize lake levels for the Lake Elsinore and San Jacinto Watershed Authority, Mar 2010. 48 p.
- Kogelbauer I, Heine E, D'Amboise C, Müllebner C, Sokol W, Loiskandl W. 2013. Adaptation of soil physical measurement techniques for the delineation of mud and lakebed sediments at Neusiedler Sensors Basel. 13(12):17067–17083. doi:10.3390/s131217067.
- Kortmann RW. 1994. Oligotrophication of Lake Shenipsit by layer aeration. Lake Reserv Manag. 9(1):94–97. doi:10.1080/07438149409354734.
- Lesht BM, Stroud JR, McCormick MJ, Fahnenstiel GL, Stein ML, Welty LJ, Leshkevich GA. 2002. An event‐driven phytoplankton bloom in southern Lake Michigan observed by satellite. Geophys Res Lett. 29(8): 67-1–67-4. 10.1029/2001GL013533.
- Lloyd DS. 1987. Turbidity as a water quality standard for salmonid habitats in Alaska. N. Amer. J. Fisheries Manage.7(1):34–45. doi:10.1577/1548-8659(1987)7<34:TAAWQS>2.0.CO;2.
- Loveless WT, Harris RR, Hollabaugh CL. 2006. Seasonal variations of dissolved oxygen, nutrients, turbidity and fecal coliform bacteria in three small watershed lakes in the Little Tallapoosa watershed, Georgia. Amer Geol Soc 55th Ann. Meet. Mar 2006.
- Mladenka GC, van Every LR. 2005. Downstream effects on water quality from reservoir drawdown in Southeast Idaho. Amer. Geophys. Union Spring Meet 2005.
- Mobley MH, Ruane RJ, Harsbarger ED. 2000. And then it sank. The development of an oxygen diffuser for hydropower. Hydrovision Conference, Charlotte NC Aug 2000.
- Moore BC, Chen PH, Funk WH, Yonge D. 1996. A model for predicting lake sediment oxygen demand following hypolimnetic aeration. J Am Water Resour Assoc. 32(4):723–731. doi:10.1111/j.1752-1688.1996.tb03469.x.
- Moore BC, Cross BK, Beutel MW, Dent S, Preece E, Swanson M. 2012. Newman Lake restoration: a case study part III: hypolimnetic oxygenation. Lake Reserv Manag. 28(4):311–327. doi:10.1080/07438141.2012.738463.
- Newcombe CP, Jensen J. 1996. Channel suspended sediment and fisheries: a synthesis for quantitative assessment of risk and impact. N Am J Fish Manag. 16(4):693–727. doi:10.1577/1548-8675(1996)016<0693:CSSAFA>2.3.CO;2.
- Noh J, Kim J-C, Park J. 2014. Turbidity control downstream of the reservoir: the Nakdong River in Korea. Environ Earth Sci. 71(4):1871–1810. doi:10.1007/s12665-013-2589-3.
- NYCDEP. 2000. Water quality problems in New Croton Reservoir NY City Dept Envir Protection.
- OWRB. 2006. Oklahoma Water Watch. Illinois River 1997-2002 data summary Oklahoma Water Resources Bd.
- Peng F, Effler SW. 2011. Characterizations of the light-scattering attributes of mineral particles in Lake Ontario and the effects of whiting. J Great Lakes Res. 37 (4):672–682. doi:10.1016/j.jglr.2011.07.002.
- Prairie Y. 2005. Sediment iron and phosphorus content in Lakes Heney, des Cedres, Bernard and Blue Sea Heney Lake Sediment Report. Montreal (Canada): University of Quebec.
- Press F, Siever R. 1974. Earth. San Francisco (CA): Freeman & Co.
- Schroll R. 1979. Table 4.8 in Hakanson L, Jansson M. 2002. Principles of Lake Sedimentology. Caldwell (NJ): Blackburn Press. 316 p.
- Shacklette HT, Boerngen JG. 1984. Element concentrations in soils and other surficial materials of the conterminous United States. US Geol Surv Prof Paper 1270.
- Sicko-Goad LM, Schelske CL, Stoermer EF. 1984. Estimation of intracellular carbon and silica content of diatoms from natural assemblages using morphometric techniques. Limnol Oceanogr. 29(6):1170–l178. doi:10.4319/lo.1984.29.6.1170.
- Slotton DG. 1994. Camanche Reservoir bottom sediment study UC Davis Inst. Ecol. No. 40. Jun 1994.
- Strong AE, Eadie BJ. 1978. Satellite observations of calcium carbonate precipitations in the Great Lakes. Limnol Oceanogr. 23(5):877–887. doi:10.4319/lo.1978.23.5.0877.
- Systech. 1992. Plume model for the EBMUD hypolimnetic oxygenation system. Lafayette (CA): Systech Consulting.
- Thompson JB, Schultze-Lam S, Beveridge TJ, Des Marais DJ. 1997. Whiting events: biogenic origin due to the photosynthetic activity of cyanobacterial picoplankton. Limnol Oceanogr. 42(1):133–141. doi:10.4319/lo.1997.42.1.0133.
- Tubana BS, Babu T, Datnoff LE. 2016. A review of silicon in soils and plants and its role in US agricultural history and future perspectives. Soil Sci.181:393–411. doi:10.1097/SS.0000000000000179.
- Vanderploeg HA, Eadie BJ, Liebig JR, Tarapchak SJ, Glover RM. 1987. Contribution of calcite to the particle-size spectrum of Lake Michigan seston and its interactions with the plankton. Can J Fish Aquat Sci. 44(11):1898–1914. doi:10.1139/f87-234.
- Vogel DA, Marine KR. 2000. Lower Mokelumne River fisheries monitoring program 1999-2000. Red Bluff (CA): Natural Resources Scientists Inc.
- Ward JV, Stanford JA. 1995. Ecological connectivity in alluvial river ecosystems and its disruption by flow regulation. Regul Rivers Res Manag. 11:105–119. doi:10.1002/rrr.3450110109.