
Abstract
Simmatis B, Nelligan C, Rühland KM, Jeziorski A, Castro V, Paterson AM, Smol JP. 2020. Tracking ∼200 years of water quality in Muskrat Lake, a eutrophic lake trout lake in Ontario (Canada) with cyanobacterial blooms. Lake Reserv Manage. 36:260–277.
Muskrat Lake is a deep (64 m), eutrophic lake in southeastern Ontario, Canada, that supports a natural lake trout population. Frequent algal blooms and low deep-water dissolved oxygen concentrations have generated management concerns. Based on anecdotal reports, algal blooms first occurred in the 1920s. Concern regarding recreational activities has escalated since the early 1980s. Monitoring records for total phosphorus (TP) and dissolved oxygen concentrations are sparse, requiring paleolimnological methods to extend our knowledge of past lake conditions. We inferred trends in past whole-lake primary production using visual-range spectroscopy-inferred chlorophyll a, nutrients using diatom assemblage changes, and end-of-summer volume-weighted hypolimnetic oxygen concentrations (VWHO) using chironomids to assess environmental conditions in Muskrat Lake over the past ∼200 years. Diatom taxa indicative of mesotrophic conditions were present throughout the sedimentary record, which suggests that Muskrat Lake was moderately productive before European settlement, with conditions worsening somewhat after ca. 1920, following land clearance and agricultural development. Chironomid-inferred VWHO trends suggest that the hypolimnion was not naturally well oxygenated, but deep-water oxygen levels declined further after ca. 1900 following European settlement. After ca. 1990, changes in diatom assemblage composition were consistent with climate-mediated increases in thermal lake properties, which might have contributed to cyanobacterial dominance. Whole-lake primary production increased after ca. 1900 and peaked ca. 1960, remaining stable until ca. 2006, after which it declined. Overall, Muskrat Lake has been productive over the past ∼200 years, but the cumulative effects of changes in nutrient loading and mixing patterns should be considered in future management decisions.
Cultural eutrophication represents a significant global water quality problem (Smith and Schindler Citation2009) that is associated with increased algal abundance (Schindler Citation1977), deep-water oxygen depletion (Müller et al. Citation2012), and decreased species diversity (Salgado et al. Citation2018). Eutrophication is often implicated in the development of nuisance algal blooms; however, an increasing frequency of algal blooms has also been recorded in lower nutrient lakes at northern temperate to subarctic latitudes due to other environmental pressures, such as reduced wind speed, increased water temperature, and/or longer open-water periods (Taranu et al. Citation2015, Schindler et al. Citation2016, Favot et al. Citation2019). Internal loading of nutrients from the sediments might also occur in some lakes when anoxic conditions at the water–sediment interface promote the release of dissolved phosphorus into the water column. This process may fuel late-season algal blooms because nutrients can be resupplied to shallow waters during mixing events (Nürnberg Citation1995).
In relatively deep, oligo- to mesotrophic lakes that typify the Precambrian Shield, lake trout are sentinels of environmental degradation due to their slow growth, late maturation, and narrow habitat requirements (Gibson and Fry Citation1954, Evans Citation2007, Plumb et al. Citation2014). Optimal habitat for lake trout is characterized by cold (<10 C), well-oxygenated waters with a mean volume-weighted hypolimnetic oxygen (VWHO) concentration >6 mg/L (Evans et al. Citation1991). Low dissolved oxygen concentrations can occur if there is a large biological oxygen demand in the hypolimnion during thermal stratification, such as high bacterial activity caused by algal sedimentation, or if there are morphometric constraints to water column mixing, such as small surface-area-to-volume ratios and/or small hypolimnetic volumes (Nürnberg Citation1984). Without long-term monitoring records, it is difficult to determine whether the limnological conditions that promote algal blooms are driven by recent cultural eutrophication and associated hypolimnetic oxygen depletion. It is also possible that conditions appropriate for algal blooms have existed for long periods and have only more recently been exacerbated by other stressors, such as climate change.
Paleolimnology is an indirect technique used to extend monitoring records by inferring past water quality parameters from biological and other proxies that are archived in lake sediment records (Smol Citation1992, Citation2008). Paleolimnological methods can be used to assess whole-lake primary production, nutrient concentrations, climate-related changes to lake physical properties, and VWHO concentrations. Visual range spectroscopy (VRS) can track trends in whole-lake primary production from the sedimentary record by inferring chlorophyll a and its primary degradation products from bulk sediment measurements (Michelutti and Smol Citation2016). Diatoms (Bacillariophyceae) are sensitive indicators of lake thermal properties (Rühland et al. Citation2015, Reavie et al. Citation2017), as well as of past total phosphorus (TP) concentrations (e.g., Reavie et al. Citation1995, Hall and Smol Citation2010, Enache et al. Citation2012). Additionally, larval chironomids (Diptera: Chironomidae) are responsive to changes in deep-water oxygen conditions (Brodersen and Quinlan Citation2006), and their subfossil assemblages can be used to quantitatively reconstruct past VWHO conditions (Quinlan and Smol Citation2001a, Citation2010). Long-term environmental records are critical for establishing appropriate water quality management objectives. This is especially important when targets based on short monitoring records assume that long-term degradation has occurred, but poor conditions may have persisted for centuries (Simmatis et al. Citation2018).
In this study, we examine a sediment record of ∼200 years from Muskrat Lake (), Ontario. Muskrat Lake is a large, deep, currently eutrophic lake that supports a natural lake trout population maintained with annual subadult stocking. Excess algal growth and low deep-water oxygen concentrations are of concern to lake managers, recreational lake users, and the local tourism-driven economy. Establishing whether lake water quality has changed is particularly important, because there is currently a narrow volume of optimal habitat available for lake trout in late summer () and purportedly an increase in the frequency of cyanobacterial blooms since the mid 2000s. The watershed of Muskrat Lake has productive soils, with anecdotal records of nearby indigenous agricultural activity recorded in Samuel de Champlain’s diary in 1613 (Brown and Smol Citation1985). A previous paleolimnological study (Brown and Smol Citation1985) examined diatom, chrysophyte, and sedimentary pigment records and concluded that Muskrat Lake was productive for the past ∼200 years but had experienced modest nutrient enrichment since ca. 1850 with the onset of European settlement, deforestation, and the development of agriculture. Elevated cyanobacterial pigments ca. 1900 further indicated that the lake had historically been productive (Brown and Smol Citation1985). This study, however, focuses on the potential drivers of more recent blooms that have occurred in the past ∼20 years despite nutrient abatement efforts, by considering the role of regional climate change in addition to changes in nutrient levels (interpreted qualitatively from diatom assemblages), spectrally inferred whole-lake primary production, and deep-water oxygen conditions.
Figure 1. Map of region surrounding Muskrat Lake (Ontario, Canada), with shaded areas representing forested land. The arrow represents the direction of water flow, and the ⨂ marks the coring site at a depth of 33 m. Inset: Location of Muskrat Lake in Ontario (inverted black triangle) with Ottawa, Ontario, Canada, marked with a star.
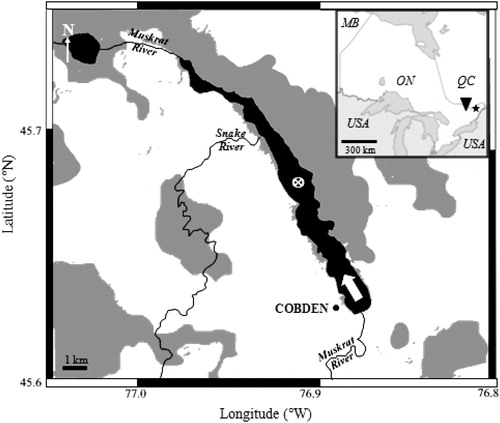
Figure 2. (a) Measured spring epilimnetic total phosphorus concentrations ([TP]epi) averaged per decade, with the number of measurements noted at the bottom of each column. (b) Measured isopleths of 10 C water temperature (black solid line), 6 mg/L dissolved oxygen (black dashed line), <1 mg/L dissolved oxygen (gray striped area), and a dark gray shaded region of optimal late-summer lake trout optimal oxythermal habitat (temperature <10 C, dissolved oxygen >6 mg/L; Evans et al. Citation1991).
![Figure 2. (a) Measured spring epilimnetic total phosphorus concentrations ([TP]epi) averaged per decade, with the number of measurements noted at the bottom of each column. (b) Measured isopleths of 10 C water temperature (black solid line), 6 mg/L dissolved oxygen (black dashed line), <1 mg/L dissolved oxygen (gray striped area), and a dark gray shaded region of optimal late-summer lake trout optimal oxythermal habitat (temperature <10 C, dissolved oxygen >6 mg/L; Evans et al. Citation1991).](/cms/asset/7659e1c8-7f79-4a55-b884-91ffebbcb452/ulrm_a_1755749_f0002_b.jpg)
As the primary management concerns in Muskrat Lake are excess algal growth (including recent increases in cyanobacterial blooms) and low end-of-summer VWHO concentrations, we use sedimentary diatom and chironomid assemblages, as well as trends in VRS-inferred chlorophyll a, to assess how water quality in Muskrat Lake has changed since European settlement within its catchment in the 1850s. Our results may provide insights into possible drivers of frequent algal blooms in the past few decades and how current deep-water oxygen levels differ from presettlement conditions. These paleolimnological inferences can help lake managers assess whether current management targets are realistic and provide historical context to evaluate the current quality of lake trout habitat in eutrophic Muskrat Lake.
Study site
Muskrat Lake (45°40′40.8′′N, 76°54′28.8′′W; ) is a relatively large (surface area 12 km2, length ∼14 km, maximum width 1.5 km), deep (maximum depth 64 m, mean depth 17.9 m), single-basin system located approximately 80 km northwest of Ottawa, Ontario, Canada. Currently, the lake is eutrophic (23 µg/L, Jul 2011, ). End-of-summer (Sep) mean volume-weighted hypolimnetic dissolved oxygen concentration records extend from 2003 to 2018 and ranged from 2.52 mg/L (2004) to 4.07 mg/L (2011) with an average of 3.15 mg/L over the monitoring record (Castro V, Ontario Ministry of the Environment, Climate Change and Parks, 2019, unpubl. data). Secchi disk depth ranged from 1 m to 4.5 m, with an overall decrease between the 1978–1987 record and the 2003–2018 record (LPP Citation2019; Castro V, Ontario Ministry of the Environment, Conservation and Parks, 2019, unpubl. data; Figure S1). The lake is dimictic and stratifies strongly in the summer (approximately May to Sep, though monitoring before May or after Sep is rare; Table S1). September thermocline depth ranged from 11 to 17 m in 1978–1986 and from 11 to 14 m in the 2003–2018 monitoring record (Castro V, Ontario Ministry of the Environment, Conservation and Parks, 2019, unpubl. data).
The lake catchment is 481 km2 and is underlain by both Precambrian Shield and sedimentary bedrock (Brown and Smol Citation1985). Most of the land surrounding the lake and its tributaries is used for agriculture (primarily intensive row crops such as corn or soybean, but also livestock pasture). The town of Cobden is situated on the southern shore, where the Muskrat River flows into Muskrat Lake. The water flows northwest, eventually draining into the Ottawa River. The northern shore of the lake is shallow (maximum depth of approximately 9 m at the outlet) and macrophyte dominated. Muskrat Lake is the drinking-water source for the town of Cobden and supports a variety of sport fish, including smelt, northern pike, walleye, and lake trout (OMNRF Citation2015). Muskrat Lake is classified as a natural lake trout lake and is managed for a naturally reproducing lake trout population by the Ontario Ministry of Natural Resources and Forestry (OMNRF Citation2015). The lake has been stocked with lake trout fry since at least 1884 (Kerr and Lasenby Citation2001).
The first railway to the area was built during the 1880s, and Cobden was incorporated as a village in 1901 in response to increasing regional population size. A number of wetlands were purportedly filled as agricultural development continued in the early 20th century (affected area unknown). There is anecdotal evidence of annual late-August algal blooms in Muskrat Lake when conditions were calm, as early as the 1920s. A sewage treatment plant was installed in the 1970s to address concerns regarding bacterial levels in the lake. However, based on anecdotal evidence, it was noted in the late 1970s that conditions seemed to be deteriorating: algal bloom frequency appeared to increase and blooms occurred earlier in the summer, prompting frequent beach closures by the early 1980s. Local interest groups attributed the worsening water quality to the removal of a downstream dam and the deepening of the Lake Dore outlet (upstream of Muskrat Lake), with increased algal blooms ascribed to reduced water retention time and declining water levels. In the mid 2000s, nuisance algal blooms and cyanobacterial blooms were reported, despite apparent stability or minor declines in measured nutrient concentrations, prompting questions about the roles of climate, oxygen depletion, and diffuse nutrient export from the watershed in modern algal blooms.
Methods
Core chronology
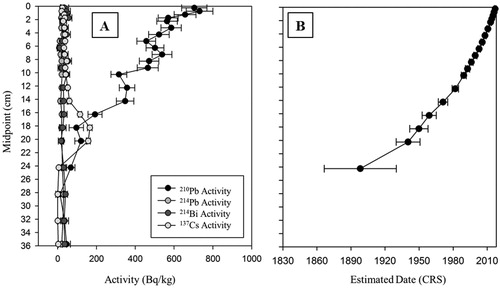
A 36 cm sediment core was collected from Muskrat Lake in June 2017 from a depth of 33 m () using a Glew (Citation1989) gravity corer. The core was sectioned on site into 0.5 cm contiguous intervals using a Glew (Citation1988) extruder. Gamma spectroscopy was used to detect 210Pb and 137Cs activities in 22 sedimentary intervals throughout the core. Approximately 1–2 g of freeze-dried sediment was placed into plastic vials and sealed with 2 ton epoxy, left for 2 weeks to allow for the equalization of 226Ra, then placed into germanium gamma counters to quantify radioisotope activities following Schelske et al. (Citation1994). Sediment ages were estimated from unsupported 210Pb activities using the constant rate of supply (CRS) model, assuming a variable rate of sedimentation (Appleby and Oldfield Citation1978).
VRS-inferred whole-lake primary production
VRS can track trends in whole-lake primary production by inferring the concentration of sedimentary chlorophyll a (along with its isomers and main degradation products), providing information on shifts in lake trophic status (Michelutti et al. Citation2010, Michelutti and Smol Citation2016). Freeze-dried sediments were sieved through a 125 µm screen to homogenize grain size, then analyzed using a FOSS NIRSystem model 6500 rapid content analyzer operating over a range of 400–2500 nm (Wolfe et al. Citation2006, Michelutti et al. Citation2010). Trends in the concentration of chlorophyll a and its main diagenetic products were inferred from spectral absorbance values from the 650–700 nm wavelength range using a linear model (Wolfe et al. Citation2006, Michelutti et al. Citation2010).
Sedimentary diatom assemblages
Diatom preparations followed the standard methods outlined in Rühland and Smol (Citation2002). Subsamples of ∼0.2 g of wet sediment were digested using a 50:50 molar ratio of concentrated sulfuric and nitric acid to remove organic content from the sediments while leaving siliceous materials intact. The acid digestion was catalyzed by placing samples in a hot water bath (∼80 C) for ∼2 h. Acidic diatom slurries were rinsed with deionized water and allowed to settle for 24 h between rinses until the samples reached a circumneutral pH. The slurries were plated onto coverslips, evaporated under low heat, and permanently mounted to microscope slides using Naphrax. Diatoms were identified under 1000× magnification using a Leica DMR microscope fitted with differential interference contrast optics to the lowest possible taxonomic level, using primarily Krammer and Lange-Bertalot (Citation1986, Citation1988, Citation1991a, Citation1991b), Camburn and Charles (Citation2000), and Reavie and Kireta (Citation2015). At a minimum, 400 diatom valves were enumerated per interval.
Sedimentary chironomid assemblages and chironomid-inferred VWHO
Chironomid remains were processed generally following Walker (Citation2001). Subsamples of ∼0.5–4 g of freeze-dried sediments were warmed at ∼80 C on a hotplate in a solution of 5% potassium hydroxide for 30 min to disaggregate the sediment, and then washed through a 100 µm mesh sieve using deionized water. Head capsules were manually picked from a Bogorov tray and slides were permanently mounted using Entellen. At least 40–50 chironomid head capsules (Quinlan and Smol Citation2001b) were identified to the lowest possible taxonomic level (Brooks et al. Citation2007, Andersen et al. Citation2013).
Statistical analyses and modeling
Diatoms and chironomids were presented as percent relative abundances to the total number of valves or head capsules, respectively, counted in each sediment interval. The most commonly occurring taxa were displayed stratigraphically, and in some cases taxa were grouped for display if they followed similar trends through time. However, all species and varieties were kept distinct for statistical analyses (e.g., cluster analysis, ordinations, inference models). Major biostratigraphic zones for both the diatom and chironomid assemblages were identified through cluster analysis using stratigraphically constrained incremental sum of squares (CONISS) determined by squared chord-distance dissimilarity matrices by using the vegan and analogue packages in R (Grimm Citation1987, Oksanen et al. Citation2017, Simpson and Oksanen Citation2019), and the importance of these zones was assessed with a broken-stick analysis (Bennett Citation1996). The diatom and chironomid taxa displayed in the stratigraphies were organized by species weighted-average mean or “optimum,” approximated using canonical correspondence analysis (CCA) constrained to sample depth, and ordering taxa based on each taxon’s axis 1 species scores (Janssen and Birks Citation1994).
Historical trends in nutrients were derived from diatom compositional changes. However, application of a quantitative TP model on the sedimentary diatom assemblages from Muskrat Lake was not utilized due to poor analogs and hence poor model performance.
Past VWHO concentrations were inferred using the chironomid calibration set described in Quinlan and Smol (Citation2001a; RMSE of the model is ±1.9 mg/L). The late-summer VWHO calibration set included 54 sites located in southern Ontario (VWHO range 0.01 mg/L to 10.6 mg/L; Quinlan and Smol Citation2001a, Citation2010). Principal component analysis (PCA) of the calibration set with passively plotted fossil data, the percent of taxa used in the inference model, and analog matching described in Simpson (Citation2012) using Bray–Curtis dissimilarity coefficients were used to determine model applicability to the downcore chironomid data set using the analogue package in R.
Major patterns of variation through time for both diatoms and chironomids were summarized using sample scores for the first 2 PCA axes and were plotted by both core depth and 210Pb estimated dates. PCA was performed using the “rda” function from vegan in R, with a square-root transformation of diatom and chironomid percent relative abundance data to equalize the variance among taxa. Summarizing the data in this way allowed for comparisons in the timing and magnitude of change among proxies (diatoms, chironomids, VRS-inferred chlorophyll a, and chironomid-inferred [CI]-VWHO) with known historical events in the catchment (e.g., European settlement and changes in catchment activities) and instrumental records (e.g., regional temperature records). Trends of individual proxies (diatom and chironomid PCA scores and VRS-inferred chlorophyll a) were expressed as a deviation from the pre-1850 mean to highlight the degree of change over time.
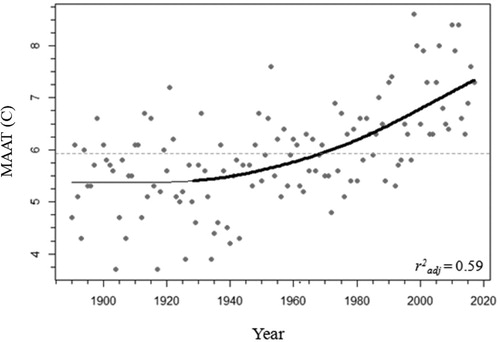
Mean annual air temperature (MAAT) data were examined using a generalized additive model (GAM) via the “gam” function of the mgcv package in R to estimate trends as a smoothed function of time, including the identification of periods of significant change (Simpson Citation2018). In the GAM, a model was fit using a cubic basis (k = 50, k-index = 0.93, edf = 2.43, method = GCV; n = 126, r2adj = 0.59). The significant period of change in MAAT was determined by estimating where a zero value was not included in the confidence interval of the first derivative (estimated using finite differences) of the fitted spline (Simpson Citation2018).
Results
Core chronology
The 210Pb activity for our Muskrat Lake core had initial concentrations of ∼700 Bq/kg and generally followed an exponential decline (), suggesting that mixing was not a significant issue for this sediment core. Equilibrium depth (supported 210Pb levels) was reached between 24 and 28 cm (), with the oldest date estimated by the CRS model being ca. 1900 ± 31 years at 24 cm (), indicating that the 36 cm long sediment core captured environmental information from a period prior to European settlement. Dates extrapolated below 24 cm should be viewed with caution but are included in figures to provide an estimate of the arrival of Europeans in the area. The 137Cs profile showed a typical increase and decay, with the peak of radioisotopic activity occurring at 18 cm (), estimated as having a CRS date of ca. 1950 (± 8 years; ), which was in relatively good agreement with the height of atmospheric nuclear weapons testing in 1963.
Figure 3. 210Pb radiometric dating analysis of the Muskrat Lake sediment core, retrieved in July 2017. (a) Radioisotope activities by sediment depth and (b) estimated sediment age by depth as determined using the constant rate of supply (CRS) model for the Muskrat Lake sediment core (error bars indicating uncertainty in the date estimate).
Instrumental records
Adjusted and homogenized air temperature records from Environment and Climate Change Canada for Killaloe, Ontario (∼40 km west of Cobden, Ontario), were available from 1888 to 2017 (ECCC Citation2019). In the GAM assessing MAAT data from Killaloe, the significant period of change was determined to be between 1932 and the present day (). Based on the fitted values of the GAM, the region has warmed by ∼2 C since the mid 1930s, although the mean annual temperature surpassed the 1890–2018 mean in the 1970s and continued to increase thereafter (, ECCC Citation2019). Though the relationship was weak (r2adj < 0.2), winter temperature also appears to be increasing over time, with similar trends and magnitude (∼1.7 C increase) as was seen in MAAT.
Figure 4. Mean annual air temperature (MAAT) from 1880 to 2017 in Killaloe, Ontario (gray points; ECCC Citation2019). The 1880–2017 average MAAT is indicated by the dotted horizontal gray line. The fitted values of the generalized additive model used to visualize the trend in MAAT (r2adj = 0.59) is indicated with a solid line. The significant increasing trend is indicated by the thick black line.
Subfossil diatom assemblages
Poor TP model performance was the result of poor analog matching, dissimilarity between fossil and calibration assemblages, and the possibility that diatoms were tracking both nutrients conditions and recent warming. The downcore diatom assemblages from Muskrat Lake were on average only ∼50% similar to calibration set samples and thus the regional calibration set was considered to be a poor analog for the historical samples (specifically Reavie and Smol Citation2001). In addition, recent sediments also had higher relative abundances of taxa characteristic of warming-induced changes in lake thermal properties, which could also result in a spurious trend in diatom-inferred TP (Juggins Citation2013). Therefore, nutrient trends were determined qualitatively using the diatom sedimentary record. This was done by assessing changes in the relative abundance of several nutrient-sensitive taxa and contrasting TP optima of these taxa as reported in other published calibration sets (e.g., Reavie et al. Citation1995, Reavie et al. Citation2006, Cumming et al. Citation2015).
In the 33 intervals analyzed in the sediment core, 114 diatom taxa from 27 genera were identified. The most common taxa were displayed stratigraphically, including 2 groupings of taxa (small cyclotelloid taxa and benthic fragilarioid taxa), each with similar habitat requirements that show similar trends through time (). CONISS, together with broken-stick analysis, identified 4 important biostratigraphical zones, with the largest change occurring ca. 1960 (). Diatom assemblages were dominated by planktonic taxa and underwent several distinct compositional changes throughout the sediment record of ∼200 years ().
Figure 5. Simplified stratigraphy of diatom assemblages scaled by depth (with secondary axis of CRS-estimated 210Pb dates) showing the relative abundances of the most common taxa. Taxa are ordered from high (lower left) to low (upper right) “optima,” approximated by canonical correspondence analysis (CCA) axis 1 species scores (CCA constrained to depth). Bold numbers in square brackets are estimated total phosphorus (TP) optima (µg/L) based on Reavie et al. (Citation1995), Reavie et al. (Citation2006), and Cumming et al. (Citation2015). Numbers in parentheses depict the number of taxa in the grouping: Small cyclotelloid taxa (Lindavia ocellata, L. michiganiana, L. comensis, and Cyclotella cyclopuncta), benthic fragilarioid taxa (Staurosira construens, Staurosirella pinnata, and Pseudostaurosira brevistriata), and elongate planktonic Fragilaria taxa (F. capucina, F. ulna, and F. delicatissima) are grouped for display but are separate for statistical analyses. Horizontal lines depict CONISS zones with solid lines showing important zones identified by broken-stick analysis. The estimated timing of important historical events is given to the right of the diatom profile. Dates beyond ∼120 years were extrapolated but are not displayed; ca. 1850 is approximately 30 cm.
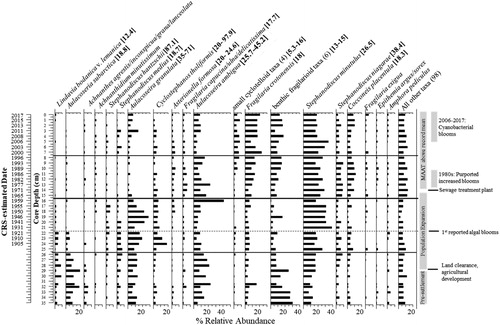
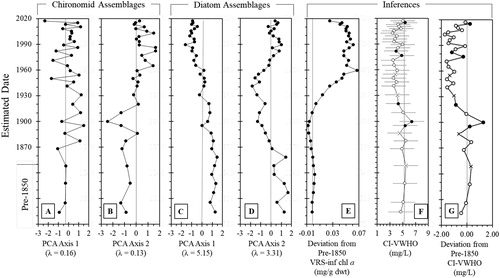
Figure 6. Species scores of principal component analysis (PCA) axes 1 and 2 for sedimentary (a, b) diatom and (c, d) chironomid assemblages, respectively. (e) The deviation in inferred values from the average pre-1850 (pre ∼30 cm) values for visual range spectroscopy (VRS)-inferred chlorophyll a trends. (f) Chironomid-inferred volume-weighted hypolimnetic oxygen (CI-VWHO) with the average for before ca. 1850 shown by a gray line, where black points represent good analogs, open points represent poor analogs, “X” markers indicate very poor analogs in the reconstruction, and error bars represent the 1.9 mg/L RSME of the Quinlan and Smol (Citation2001b) model (see also Figure S2). (g) Deviation from the pre-1850 average CI-VWHO where black points represent good analogs, open points represent poor analogs, and “X” markers indicate very poor analogs in the reconstruction.
The presettlement diatom assemblages (below 26 cm, extrapolated CRS date of ∼1885) were composed of taxa indicative of mesotrophic nutrient concentrations (Reavie et al. Citation1995, Citation2006, Cumming et al. Citation2015). In particular, taxa that were distinct to these intervals included Lindavia bodanica var. lemanica (∼5% relative abundance; TP optimum ∼12.4 µg/L; Cumming et al. Citation2015), Aulacoseira subarctica (∼10% relative abundance; TP optimum∼18.8 µg/L; Cumming et al. Citation2015), and the small Achnanthes agrestis/inconspicua/grana/lanceolata group (∼5% relative abundance) that declined in the late 1800s and reached trace abundances after ca. 1920 (). In these predisturbance intervals, the benthic fragilarioid complex (i.e., Staurosira construens, Staurosirella pinnata, Pseudostaurosira brevistriata; TP optima ∼13 to 15 µg/L; Cumming et al. Citation2015) reached its highest abundances (∼30% relative abundance) in the diatom record. Post ca. 1920 until ca. 1960, several taxa that are indicative of higher (i.e., eutrophic) nutrient concentrations increased in relative abundance by ∼10%, including Stephanodiscus minutulus (TP optimum ∼26.5 µg/L; Cumming et al. Citation2015), Aulacoseira granulata (TP optimum 35–71 µg/L; Reavie et al. Citation1995, Citation2006), S. medius (TP optimum ∼18.7 µg/L; Cumming et al. Citation2015), Cyclostephanos tholiformis (TP optimum 20–97.9 µg/L; Reavie et al. Citation1995, Citation2006), and S. hantzschii (TP optimum ∼87.1 µg/L; Cumming et al. Citation2015, ). The largest diatom compositional change identified by CONISS occurred in the late 1950s to the early 1960s, when several taxa including S. hantzschii, S. medius, and A. granulata declined to trace abundances. At this time, there was a brief increase (from ∼10% to ∼41%) in the relative abundance of Aulacoseira ambigua, an indicator of high nutrient conditions (TP optimum 25.7 to 45.2 ug/L; Reavie et al. Citation2006, Cumming et al. Citation2015), and an increase in Stephanodiscus niagarae (TP optimum ∼38.4 µg/L, Cumming et al. Citation2015). Several elongate planktonic taxa with meso- to mesoeutrophic TP optima (16–24.6 µg/L; Cumming et al. Citation2015) became more prominent, including Asterionella formosa, the Fragilaria capucina/ulna/delicatissima complex, and F. crotonensis (). In addition to the post-1960s increases in planktonic taxa, periphytic Cocconeis placentula (TP optimum ∼18.3 µg/L, Reavie et al. Citation1995) increased by ∼6%, and the benthic fragilarioid taxa increased by ∼7% relative abundance. In the more recent sediments (ca. 1990s to ca. 2000), the arrival of small cyclotelloid taxa (average abundance 6%, TP optima ∼5.3–16; Cumming et al. Citation2015, Reavie et al. Citation1995) that were previously rare in the record (average abundance 0.8%) is notable (). This is accompanied by increases in F. crotonensis, S. hantzschii, S. medius, and C. tholiformis and modest declines in A. ambigua, S. niagarae, and C. placentula ().
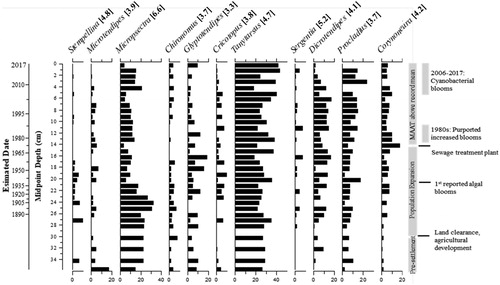
Trends in sedimentary chironomid assemblages
At a minimum, 40–50 whole head capsules were isolated and taxonomically identified from 33 intervals of the Muskrat Lake sediment core. From the intervals analyzed, 50 chironomid taxa from 35 genera were recorded, of which 16 taxa reached >5% in at least 2 intervals (). Broken-stick analysis did not identify any biostratigraphic zones in the chironomid stratigraphy; however, CONISS suggests that the largest change in the chironomid assemblage occurred in ca. 1910 (). The sedimentary chironomid assemblages were dominated by littoral taxa. Tanytarsus (VWHO optima 4.7 mg/L; Quinlan and Smol Citation2001a), a primarily littoral taxon (Brooks et al. Citation2007), occurred in relatively high abundances (>30%) throughout the sedimentary record. Prior to ca. 1910, taxa indicative of high oxygen conditions, including Micropsectra (∼25–30% relative abundance; VWHO optima 6.6 mg/L; Quinlan and Smol Citation2001a) and Stempellina (∼5–10% relative abundance; VWHO optima 4.8 mg/L; Quinlan and Smol Citation2001a), were present. After ca. 1910, Micropsectra declined by ∼15% relative abundance and Stempellina was reduced to trace abundances. This was accompanied by increases in Corynoneura (from trace to ∼15% relative abundance; VWHO optima 4.2 mg/L; Quinlan and Smol Citation2001a) and Procladius (from ∼8% to ∼20%; VWHO optima 3.7 mg/L; Quinlan and Smol Citation2001a). After the mid 1990s and early 2000s, there were declines (by ∼5–10% relative abundance) in littoral taxa such as Glyptotendipes (VWHO optima 3.3 mg/L), Cricotopus (VWHO optima 3.8 mg/L), Microtendipes (VWHO optima 3.9 mg/L), and Dicrotendipes (VWHO optima 4.1 mg/L; Quinlan and Smol Citation2001a).
Figure 7. Simplified sedimentary chironomid (Diptera: Chironomidae) profile showing the relative abundances of the most common taxa ordered by weighted average from left to right. Bold numbers in square brackets are estimated end-of-summer volume-weighted hypolimnetic oxygen (VWHO) optima (mg/L) based on Quinlan and Smol (Citation2001a). Taxa were grouped by genus for display but separated into the smallest taxonomic groups (e.g., species) for statistical analyses. The constrained incremental sum of squares (CONISS) is on the far right. Broken-stick analysis did not identify biostratigraphic zones (Bennett Citation1996). 210Pb-estimated CRS dates and midpoint depths are on the y-axis. Dates beyond ∼120 years were extrapolated but are not displayed; ca. 1850 is approximately 30 cm.
Overall taxonomic compositional change and inferred trends
A comparison of the downcore PCA sample scores for both diatoms () and chironomids () showed that they track similar trends (although not always synchronous) over the ∼200 years record. PCA axis 1 (PC1) and 2 (PC2) sample scores explained similar cumulative proportions of the inertia for both chironomids (PC1 = 15% and PC2 = 13%) and diatoms (PC1 = 23% and PC2 = 15%). Both chironomid and diatom assemblages underwent distinct changes following initial European settlement, agricultural expansion, and cultural eutrophication after ca. 1870, which was well expressed in both chironomid PC1 and PC2, and in diatom PC2 sample scores (), respectively). Shifts in the chironomid and diatom assemblages that occurred after ca. 1960 sediments were particularly clear in diatom PC1 and chironomid PC2 sample scores. Chironomid PC1 and 2 explained similar proportions of inertia within the chironomid assemblages. Chironomid PC1 appeared to more closely track assemblage species richness and the overall number of littoral taxa, whereas PC2 distinctly changes in ca. 1930 and appeared to be related to trends in CI-VWHO and the ratio of littoral to profundal taxa.
Trends in VRS-inferred chlorophyll a concentrations were relatively stable from the base of the core until ∼1900, and thereafter increased above the pre-1850 mean to a maximum value in the 1960s (), after which there was little change until the very top of the core. VRS-inferred chlorophyll a concentrations have decreased slightly since ca. 2006, although they remain higher than pre-1950 conditions ().
The passively plotted chironomid fossil data were spread evenly within the calibration ordination space, indicating that the assemblages in the fossil dataset were similar to those found within the Quinlan and Smol (Citation2001a, Citation2010) CI-VWHO model (Figure S2). The modern analog matches range from poor to good (whereby the minimum dissimilarity coefficient was >10th percentile of the pairwise distribution of calibration set samples for poor analogs, and to <5th percentile for good analogs; , S1) with poor model fit indicated by assessing the squared residual lengths of the fossil assemblages compared to those of the calibration set. Therefore, reconstructed values should be interpreted with caution and we will place more emphasis on overall trends. More than 90% of identified chironomid taxa in the sediment intervals were used in the Quinlan and Smol (Citation2001a, Citation2010) CI-VWHO transfer function. CI-VWHO was relatively stable until ∼1900 (). A minor decline in CI-VWHO occurred between ca. 1900 and ca. 1950, although the lowest reconstructed value occurred at ca. 2000 (however, the analog matching for that interval was poor). CI-VWHO increased modestly from ca. 2006 to 2017, though this trend appears to be more strongly linked to the decline in Dicrotendipes rather than to trends in profundal taxa such as Micropsectra or Procladius ().
Discussion
In contrast to the vast majority of lake trout lakes, Muskrat Lake is a productive lake experiencing annual nuisance algal blooms and frequent cyanobacterial blooms, while still supporting a natural population of lake trout (supplemented with annual subadult stocking). There is anecdotal evidence of annual algal blooms occurring as early as the 1920s, but long-term data are needed to help determine potential drivers of modern nuisance algal blooms.
The monitored (2003–2018) mean volume-weighted hypolimnetic dissolved oxygen values fall within the error of the recent CI-VWHO values, but the model appears to be overestimating the monitoring data. This overestimation may be related to (1) morphometric differences between lakes in the calibration set and Muskrat Lake (which is deeper and larger than most systems in the calibration set); (2) the relatively large contribution of littoral taxa in the Muskrat Lake core compared to the Quinlan and Smol (Citation2001b, Citation2010) model; and/or (3) the coring location, which is ∼30 m shallower than the deepest point and therefore does not capture anoxic conditions deeper in the water column that often occur below the 40 m depth (). Given the coring depth, CI-VWHO more likely represents conditions close to the top of the anoxic layer of the water column, with worsening conditions inferred from this sediment core potentially indicating a thickening of low-oxygen waters and further constriction of useable lake trout habitat.
Our results confirm that Muskrat Lake has remained relatively productive over the past ∼200 years. Low abundances of taxa indicative of higher oxygen optima, including Micropsectra and Stempellina (Quinlan and Smol Citation2001a), suggest that it is unlikely that Muskrat Lake had historically high VWHO. The high proportion of littoral taxa and presence of hypoxia-tolerant profundal taxa in the presettlement sediment further supports that Muskrat Lake was historically productive with diverse littoral habitats and was relatively well oxygenated compared to more recent conditions (Quinlan and Smol Citation2001a). For example, chironomid-inferred CI-VWHO concentrations are mostly stable throughout the record, although the model suggests that the highest VWHO concentrations likely occurred just after ca. 1900. The increase in CI-VWHO ca. 1900 likely is driven by a short-lived peak in Micropsectra spp. just before they declined in relative abundance, as summarized by the chironomid PC2 sample scores. CI-VWHO decreases after ca. 1900, potentially due to increased algal production and higher hypolimnetic biological oxygen demand (e.g., Nürnberg Citation1995, Clerk et al. Citation2000, Quinlan and Smol Citation2002). The diatom record supports these interpretations. For example, the prevalence of taxa such as Aulacoseira subarctica, Lindavia bodanica var. lemanica, and the Achnanthes agrestis/inconspicua/grana/lanceolata complex in the sediments prior to European settlement suggests that Muskrat Lake has long been moderately productive (likely mesotrophic), which agrees with earlier paleolimnological interpretations by Brown and Smol (Citation1985). The lake may have been productive over the past ∼200 years for several reasons, including the presence of fertile soils that were used for crop growing by local First Nations peoples (noted in Samuel de Champlain’s diary on June 7, 1613), together with a large drainage basin (481 km2) and ratio of large watershed to lake surface area (40), providing important natural sources of nutrients to the lake (Brown and Smol Citation1985).
The sediment record, however, also shows that cultural eutrophication associated with watershed and agricultural development influenced past algal dynamics and deep-water oxygen conditions between ca. 1920 and ca. 1950. Starting in the mid 1800s, the area around Muskrat Lake was cleared for logging and agriculture (Brown and Smol Citation1985), resulting in nutrient additions. This is clearly reflected by diatom PCA sample scores that track the reductions of oligotrophic to mesotrophic taxa such as Lindavia bodanica var. lemanica, Aulacoseira subarctica, Achnanthes spp., and small fragilarioid taxa to trace abundances between ca. 1880 and ca. 1920, during the period of early settlement and expansion. The difference in timing between the onset of European disturbance and changes in biological proxies is not uncommon in large, deep lakes undergoing eutrophication, reflecting greater lake volume, water residence time, and slowing the response to basin-wide changes that occur in response to a moderate degree of disturbance (Hawryshyn et al. Citation2012). Diatom assemblage changes in naturally productive lakes, such as Muskrat Lake, may not be as pronounced due to the relative change in the influx of nutrients (e.g., Hawryshyn et al. Citation2012), compared to the clear, distinct changes observed when logging occurs near oligotrophic systems where nutrient influx had otherwise been relatively low (e.g., Stoermer et al. Citation1985, Little et al. Citation2000). Nevertheless, diatom assemblage changes in mesotrophic Muskrat Lake track increasing catchment disturbances following European settlement. Initial increases in eutrophic taxa (e.g., Cyclostephanos tholiformis, S. hantzschii, S. minutulus, A. granulata) and the concurrent decline of presettlement lower nutrient taxa (e.g., A. subarctica, L. bodanica var. lemanica) in ca. 1880 track early stages of settlement activities in the Muskrat Lake area. Nutrients from catchment development would have resulted in conditions that could be considered ideal for A. granulata and A. ambigua (Hawryshyn et al. Citation2012), including increased nutrient availability, increased turbidity, and changes in light availability. There was a modest decline in benthic fragilarioid taxa, a change that was also observed after land clearance in the watershed of Lake Simcoe, a large, eutrophic lake in central Ontario, as planktonic diatom taxa became more prevalent in nutrient-rich conditions and the availability of benthic habitat decreased, possibly due to changes in light availability (Hawryshyn et al. Citation2012).
In the early 1900s, there were near-synchronous changes across our proxies, consistent with increasing catchment disturbance and population expansion in the region. A further reduction of A. subarctica and L. bodanica var. lemanica to trace abundances ca. 1920s is indicative of increasing catchment disturbance and nutrient enrichment in Muskrat Lake. Trends in VRS-inferred chlorophyll a increased above the pre-1850 mean by ca. 1920 and reached a peak in ca. 1960, reflecting increases in whole-lake primary production (Michelutti and Smol Citation2016). Major diatom shifts between ca. 1920 and ca. 1960 were among eutrophic taxa with similar nutrient optima (e.g., high relative abundances of C. tholiformis correspond to lower abundances of S. minutulus and A. granulata in ca. 1900, shifts between A. ambigua and A. granulata). Following ca. 1960, Stephanodiscus niagarae and Fragilaria crotonensis increased in relative abundances, together with an increase in A. ambigua, replacing A. granulata. The prevalence of A. ambigua and other eutrophic taxa indicates that Muskrat Lake continued to experience high nutrient conditions. Concurrently, there were declines in the chironomid Micropsectra, which indicates worsening hypolimnetic oxygen conditions that are consistent with algal accumulation during eutrophication (Quinlan et al. Citation1998, Little et al. Citation2000).
Muskrat Lake diatom assemblage changes in the early 1990s occurred during the recent warming period when Killaloe temperatures were consistently above the record mean. In particular, small-celled cyclotelloid taxa that previously occurred at trace relative abundances notably increase, whereas Aulacoseira taxa are not as prevalent as they were in earlier intervals. The increases in Fragilaria crotonensis and small cyclotelloid taxa in Muskrat Lake are similar to shifts in the diatom assemblages reported from Lake Simcoe resulting from increased air temperature, longer open-water periods, weaker vertical mixing, and increased thermal stability (Hawryshyn et al. Citation2012). These climate-mediated changes to water-column properties may have played a role in the increase in small cyclotelloid taxa that are capable of prolific reproduction as their large surface-area-to-volume ratios allow them to stay suspended longer in the photic zone than more heavily silicified Aulacoseira taxa, providing a competitive advantage during longer and stronger periods of thermal stratification (Rühland et al. Citation2015). Although these paleolimnological trends in Muskrat Lake are consistent with climate-mediated changes in physical lake properties, the signal is not necessarily conclusive in a lake that experiences multiple environmental stressors.
Reductions in VRS-inferred chlorophyll a and modestly higher deep-water oxygen concentrations over approximately the last decade, along with increases in small cyclotelloid taxa, may be evidence of recent water quality improvements. Despite this, management concerns for Muskrat Lake have recently escalated with the development of frequent cyanobacterial blooms, a reduction in recreational value, and concerns over oxythermal habitat for resident lake trout. Suboptimal summer lake trout habitat conditions have been present since monitoring began in 2003, and there have been no directional changes in TP concentrations, based on monitoring data from 2003 to 2011 (). Given that the purported increased algal bloom intensity in the past decade does not appear to be linked to a recent deterioration of Muskrat Lake water quality (nutrient and oxygen conditions), it is possible that regional warming is playing a role. Increased reports of algal blooms on Muskrat Lake have occurred during some of the highest temperatures recorded from nearby Killaloe, Ontario, when MAAT exceeded the 1880–2018 average in the 1970s and continued to increase over the course of the record (; ECCC Citation2019). Increased air temperature, longer open-water periods, and altered light regimes can influence vertical mixing or lake thermal properties to increase algal biomass and favor buoyancy-regulating, low-light-tolerant cyanobacteria (Gray et al. Citation2019). Based on available monitoring records, thermocline depth has not significantly or directionally changed between the 1980s and the mid 2000s, but water clarity was lower in more recent (mid 2000s) records compared to earlier (1970s to 1980s) monitoring records (Figure S1).
In eutrophic Müggelsee, where the cumulative effects of nutrients and climate warming on cyanobacterial blooms have been modeled, stronger thermal stability and longer periods of thermal stratification within a critical TP window resulted in the highest predicted biomass of cyanobacteria, regardless of changes to grazing pressure (Wagner and Adrian Citation2009). The consequences of climate warming may be similar in Muskrat Lake, where buoyant cyanobacteria that prefer calm, warm conditions (Huisman et al. Citation2018) are likely benefitting from longer and warmer open-water periods, reduced water column mixing, as well as longer and likely stronger periods of thermal stratification (Table S1). Although Muskrat Lake has had productive and low-oxygen conditions over the past ∼200 years, recent climate warming may exacerbate conditions that would further promote cyanobacterial dominance in late summer.
Minor changes in the remainder of the chironomid assemblages primarily occur after ca. 2000, and do not necessarily indicate recent changes in deep-water oxygen conditions. There were modest declines in Dicrotendipes spp. as well as increased relative abundances of Micropsectra spp. and Procladius spp. In general, the most recent assemblages are somewhat similar to pre-1900s assemblages, differing in higher relative abundances of Procladius spp. and Corynoneura spp. Collectively, the changes in chironomid assemblages after ca. 2000 may indicate changes in littoral habitat structure; for example, declines in macrophyte-associated Dicrotendipes spp. with increased abundances of microfiltering/biofilm-scraping Corynoneura spp. could indicate higher contributions of phytoplankton than macrophytes to algal communities (Brooks et al. Citation2007). Higher relative abundances of Micropsectra spp. would indicate improving deep-water oxygen conditions, but the concurrent increase in Procladius spp. is contradictory to this interpretation. Rather, there may be a change in spatial habitat preference or availability, such as Micropsectra spp. being present at shallower depths where higher oxygen conditions can persist throughout thermal stratification. Further, deep-water oxygen conditions appear to remain poor during modest declines in VRS-inferred chlorophyll a after ca. 2006. Eutrophication can result in “legacy anoxia” where declines in TP and algal biomass do not rapidly affect sedimentary chironomid assemblages or deep-water oxygen as excess organic matter continues to be decomposed in the upper layers of sediment (Clerk et al. Citation2000). The decline in VRS-inferred chlorophyll a and lack of response in profundal chironomid assemblages could be related to weaker periods of vertical mixing (Schwefel et al. Citation2016), increased thermal stability, increased stratification strength (Jankowski et al. Citation2006), and/or changes to hydrology, which could restrict the movement of nutrients required for algal growth and reduce vertical replenishment of oxygen to deep hypolimnetic habitats during lake overturn, perpetuating seasonal low-oxygen conditions and promoting late-summer cyanobacterial dominance.
Conclusions and implications for lake management
Our paleolimnological investigation indicates that Muskrat Lake is a productive (indicated by diatom and inferred whole-lake primary production), low-oxygen system, and that European settlement resulted in a shift from mesotrophic to eutrophic conditions. Nutrient concentrations in Muskrat Lake have been high enough to support algal blooms for at least 200 years, but climate likely is contributing to the development of recent nuisance algal blooms. It is likely that deep-water oxygen levels in Muskrat Lake have been near the minimum requirements needed to support lake trout, reflective of productive conditions throughout the ∼200-year paleolimnological record. The Muskrat Lake sediment core data suggest that water quality continued to deteriorate with higher algal biomass that exacerbated deep-water oxygen concentrations beginning in the early 1900s, when the first algal blooms in the lakes were noted (anecdotally in the 1920s). Conditions worsened until ca. 1960 and remained mostly stable until the 1990s. After ca. 1990, shifts in the diatom assemblages were indicative of regional warming and associated changes to water-column properties. Given that there is paleolimnological evidence of modest improvements in whole-lake primary production and deep-water oxygen conditions, the recent reports of worsening cyanobacterial blooms may be related to accelerated regional warming.
While reducing nutrient inputs could help improve water quality, this study demonstrates that recent warming and associated climatic changes must also be considered in the management of lakes with sensitive cold-water taxa experiencing nuisance algal blooms, in conjunction with nutrient management or abatement. For example, existing nutrient management targets may not suffice as algal blooms are now being recorded in oligo- to mesotrophic lakes in Ontario (Winter et al. Citation2011, Smol Citation2019). Furthermore, the management of diffuse TP sources during wet periods during cooler seasons may also become increasingly important as temperatures increase and precipitation patterns change, as nutrient export from lake catchments in southern Ontario may increase further with higher winter rainfall (Crossman et al. Citation2013). Creating a sustainable, long-term monitoring plan can help identify emerging issues, and new studies may be needed to understand the multiple stressors affecting Muskrat Lake. For example, further studies of thermal structure and ice phenology would establish reference conditions for future management decisions. By better understanding the thermal structure and mixing patterns of Muskrat Lake and similar systems, lake properties (such as algal succession or dominance) and deviations from modeling (such as those used for TP budgets or shoreline development capacity) can be more comprehensively assessed. Consistent reevaluation and assessment of management strategies would allow lake managers to appropriately address negative environmental shifts in rapidly changing systems.
Acknowledgments
The authors recognize funding from the Natural Science and Engineering Research Council (NSERC), as well as the support from the Ontario Ministry of the Environment, Conservation, and Parks and Algonquin College. BS was supported by the NSERC CREATE Algal Bloom Assessment Through Technology & Education (ABATE) program.
References
- Andersen T, Cranston PS, Epler JH. 2013. The larvae of chironomidae (Diptera) of the holarctic region: keys and diagnoses. Insect Syst Evol Suppl. 66:1–571.
- Appleby PG, Oldfield F. 1978. The calculation of lead-210 dates assuming a constant rate of supply of unsupported 210Pb to the sediment. Catena. 5(1):1–8. doi:10.1016/S0341-8162(78)80002-2.
- Bennett KD. 1996. Determination of the number of zones in a biostratigraphical sequence. New Phytol. 132(1):155–170. doi:10.1111/j.1469-8137.1996.tb04521.x.
- Brodersen KP, Quinlan R. 2006. Midges as paleoindicators of lake production, eutrophication and hypolimnetic oxygen. Quaternary Sci Rev. 25(15–16):1995–2012. doi:10.1016/j.quascirev.2005.03.020.
- Brooks SJ, Langdon PG, Heiri O. 2007. The identification and use of Paleoarctic Chironomidae larvae in palaeoecology. Technical Guide No. 10. London (UK): Quaternary Research Association.
- Brown SR, Smol JP. 1985. The recent trophic history of Muskrat Lake, Renfrew County. Prepared for the Ontario Ministry of the Environment, Kingston, Ontario.
- Camburn KE, Charles DF. 2000. Diatoms of low-alkalinity lakes in the northeastern United States. Special Publication 18. Philadelphia (PA): The Academy of Natural Sciences of Philadelphia; 152p.
- Clerk S, Hall R, Quinlan R, Smol JP. 2000. Quantitative inferences of past hypolimnetic anoxia and nutrient levels in a Canadian Precambrian Shield lake. J Paleolimnol. 23(3):319–336.
- Crossman J, Futter MN, Oni SK, Whitehead PG, Jin L, Butterfield D, Baulch HM, Dillon PJ. 2013. Impacts of climate change on hydrology and water quality: future proffing management strategies in the Lake Simcoe watershed. Canada. J Great Lakes Res. 39(1):19–32. doi:10.1016/j.jglr.2012.11.003.
- Cumming BF, Laird KR, Gregory-Eaves I, Simpson KG, Sokal MA, Nordin RN, Walker IR. 2015. Tracking past changes in lake-water phosphorus with a 251-lake calibration dataset in British Columbia: tool development and application in a multiproxy assessment of eutrophication and recovery in Osoyoos Lake, a transboundary lake in Western North America. Front Ecol Evol. 3:84.
- Enache MD, Charles DF, Belton TJ, Callinan CW. 2012. Total phosphorus changes in New York and New Jersey lakes (USA) inferred from sediment cores. Lake Reserv Manage. 28:239–310.
- Environment and Climate Change Canada (ECCC). 2019. Historical climate data: Killaloe, Ontario (station ID 6105976). Available from https://climate-change.canada.ca/climate-data/#/adjusted-station-data.
- Evans DO. 2007. Effects of hypoxia on scope-for-activity and power capacity of lake trout (Salvelinus namaycush). Can J Fish Aquat Sci. 64(2):345–361. doi:10.1139/f07-007.
- Evans DO, Casselman JM, Wilcox CC. 1991. Effects of exploitation, loss of nursery habitat, and stocking on the dynamics and productivity of lake trout populations in Ontario lakes. Peterborough (ON): Ontario Ministry of Natural Resources; 103p.
- Favot E, Rühland KM, DeSellas AM, Ingram R, Paterson AM, Smol JP. 2019. Climate variability promotes unprecedented cyanobacterial blooms in a remote, oligotrophic Ontario lake: evidence from paleolimnology. J Paleolimnol. 62(1):31–52. doi:10.1007/s10933-019-00074-4.
- Gibson ES, Fry FE. 1954. The performance of the lake trout, Salvelinus namaycush, at various levels of temperature and oxygen pressure. Can J Zool. 32(3):252–260. doi:10.1139/z54-025.
- Glew JR. 1988. A portable extruding device for close interval sectioning of unconsolidated core samples. J Paleolimnol. 1(3):235–239. doi:10.1007/BF00177769.
- Glew JR. 1989. A new trigger mechanism for sediment samplers. J Paleolimnol. 2(4):241–243. doi:10.1007/BF00195474.
- Gray E, Elliott JA, Mackay EB, Folkard AM, Keenan PO, Jones ID. 2019. Modelling lake cyanobacterial blooms: disentangling the climate-driven impacts of changing mixed depth and water temperature. Freshwater Biol. 64(12):2141–2155. doi:10.1111/fwb.13402..
- Grimm EC. 1987. CONISS: a Fortran 77 program for stratigraphically constrained cluster analysis by method of incremental sum of squares. Comput Geol. 13(1):13–35. doi:10.1016/0098-3004(87)90022-7.
- Hall RI, Smol JP. 2010. Diatoms as indicators of lake eutrophication In: Smol JP, Stoermer EF, editors. The diatoms: applications for the environmental and earth sciences, 2nd ed. Cambridge (UK): Cambridge University Press; p. 122–151.
- Hawryshyn J, Rühland KM, Quinlan R, Smol JP. 2012. Long-term water quality changes in a multiple-stressor system: a diatom-based paleolimnological study of Lake Simcoe (Ontario, Canada). Can J Fish Aquat Sci. 69(1):24–40. doi:10.1139/f2011-134.
- Huisman J, Codd GA, Paerl HW, Ibelings BW, Verspagen JMH, Visser PM. 2018. Cyanobacterial blooms. Nat Rev Microbiol. 16(8):471–483. doi:10.1038/s41579-018-0040-1.
- Jankowski T, Livingstone DM, Bührer H, Forster R, Niederhauser P. 2006. Consequences of the 2003. European heat wave for lake temperature profiles, thermal stability, and hypolimnetic oxygen depletion: implications for a warmer world. Limnol Oceanogr. 51(2):815–819. doi:10.4319/lo.2006.51.2.0815.
- Janssen CR, Birks H. 1994. Recurrent groups of pollen types in time. Rev Palaeobot Palyno. 82(1–2):165–173. doi:10.1016/0034-6667(94)90028-0.
- Juggins S. 2013. Quantitative reconstructions in palaeolimnology: new paradigm or sick science? Quat Sci Rev. 64:20–32. doi:10.1016/j.quascirev.2012.12.014.
- Kerr SJ, Lasenby TA. 2001. Lake trout stocking in inland lakes: an annotated bibliography and literature review. Peterborough (ON): Fish and Wildlife Branch, Ontario Ministry of Natural Resources; 178p.
- Krammer K, Lange-Bertalot H. 1986. Bacillariophyceae. 1. Teil: Naviculaceae In: Ettl H, Gerloff J, Heynig H, Mollenhauer D, editors. Süsswasserflora von Mitteleuropa, Band 2/1. Stuttgart (Germany): Gustav Fischer Verlag; p. 1–876. [German].
- Krammer K, Lange-Bertalot H. 1988. Bacillariophyceae. 2. Teil: Bacillariaceae, Epithemiaceae, Surirellaceae In: Ettl H, Gerloff J, Heynig H, Mollenhauer D, editors. Süsswasserflora von Mitteleuropa, Band 2/2. Jena (Germany): Gustav Fischer Verlag; p. 1–596. [German].
- Krammer K, Lange-Bertalot H. 1991a. Bacillariophyceae. 3. Teil: Centrales, Fragilariaceae, Eunotiaceae In: Ettl H, Gerloff J, Heynig H, Mollenhauer D, editors. Süsswasserflora von Mitteleuropa, Band 2/3. Stuttgart (Germany): Gustav Fischer Verlag; p. 1–576. [German].
- Krammer K, Lange-Bertalot H. 1991b. Bacillariophyceae. 4. Teil: Achnanthaceae, Kritische Ergänzungen zu Navicula (Lineolatae) und Gomphonema, Gesamtliteraturverzeichnis Teil 1–4. In: Ettl H, Gerloff J, Heynig H, Mollenhauer D, editors. Süsswasserflora von Mitteleuropa, 2/4. Stuttgart (Germany): Gustav Fischer Verlag; p. 1–437. [German].
- Little JL, Hall RI, Quinlan R, Smol JP. 2000. Past trophic status and hypolimnetic anoxia during eutrophication and remediation of Gravenhurst Bay, Ontario: comparison of diatoms, chironomids, and historical records. Can J Fish Aquat Sci. 57(2):333–341. doi:10.1139/f99-235.
- Michelutti N, Blais JM, Cumming BF, Paterson AM, Rühland KM, Wolfe AP, Smol JP. 2010. Do spectrally inferred determinations of chlorophyll a reflect trends in lake trophic status? J Paleolimnol. 43(2):205–217. doi:10.1007/s10933-009-9325-8.
- Michelutti N, Smol JP. 2016. Visible spectroscopy reliably tracks trends in paleo-production. J Paleolimnol. 56(4):253–265. doi:10.1007/s10933-016-9921-3.
- Müller B, Bryant LD, Matzinger A, Wüest A. 2012. Hypolimnetic oxygen depletion in eutrophic lakes. Environ Sci Technol. 46(18):9964–9971. doi:10.1021/es301422r.
- Nürnberg GK. 1984. The prediction of internal phosphorus load in lakes with anoxic hypolimnia. Limnol Oceanogr. 29(1):111–124. doi:10.4319/lo.1984.29.1.0111.
- Nürnberg GK. 1995. Quantifying anoxia in lakes. Limnol Oceanogr. 40(6):1100–1111. doi:10.4319/lo.1995.40.6.1100.
- Oksanen J, Blanchet FG, Friendly M, Roeland K, Legendre P, O’Hara RB, McGlinn D, Minchin PR, Simpson GL, Solymos P, et al. 2017. Vegan: community ecology package. R Package Version 2.4-2. Available from http://CRAN.R-project.org/package=vegan.
- Ontario Lake Partner Program (LPP). 2019. Total phosphorus and Secchi data: Muskrat Lake, mid-lake deep point, STN 3401. Available from https://www.ontario.ca/data/ontario-lake-partner.
- Ontario Ministry of Natural Resources and Forestry (OMNRF). 2015. Inland Ontario lakes designated for lake trout management. Peterborough (ON). Available from https://files.ontario.ca/inland-ontario-lakes-final-en_03122019.pdf.
- Plumb JM, Blanchfield PJ, Abrahams MV. 2014. A dynamic-bioenergetics model to assess depth selection and reproductive growth by lake trout (Salvelinus namaycush). Oecologia. 175(2):549–563. doi:10.1007/s00442-014-2934-6.
- Quinlan R, Smol JP. 2001a. Chironomid-based inference models for estimating end-of-summer hypolimnetic oxygen from south-central Ontario Shield lakes. Freshwater Biol. 46(11):1529–1551. doi:10.1046/j.1365-2427.2001.00763.x.
- Quinlan R, Smol JP. 2001b. Setting minimum head capsule abundance and taxa deletion criteria in chironomid-based inference models. J Paleolimnol. 26(3):327–342.
- Quinlan R, Smol JP. 2002. Regional assessment of long-term hypolimnetic oxygen changes in Ontario (Canada) Shield lakes using subfossil chironomids. J Paleolimnol. 27(2):249–260.
- Quinlan R, Smol JP. 2010. Use of subfossil Chaoborus mandibles in models for inferring past hypolimnetic oxygen. J Paleolimnol. 44(1):43–50. doi:10.1007/s10933-009-9384-x.
- Quinlan R, Smol JP, Hall RI. 1998. Quantitative inferences of past hypolimnetic anoxia in south-central Ontario lakes using fossil midges (Diptera: Chironomidae). Can J Fish Aquat Sci. 55(3):587–596. doi:10.1139/f97-279.
- Reavie ED, Hall RI, Smol JP. 1995. An expanded weighted-averaging model for inferring past total phosphorus concentrations from diatom assemblages in eutrophic British Columbia (Canada) lakes. J Paleolimnol. 14(1):49–67. doi:10.1007/BF00682593.
- Reavie ED, Kireta AR. 2015. Centric, araphid and eunoioid diatoms of the coastal Laurentian Great Lakes, vol. 62. Berlin (Germany): J. Cramer.
- Reavie ED, Neill KE, Little JL, Smol JP. 2006. Cultural eutrophication trends in three southeastern Ontario lakes: a paleolimnological perspective. Lake Reserv Manage. 22(1):44–58. doi:10.1080/07438140609353883.
- Reavie ED, Sgro GV, Estepp LR, Bramburger AJ, Shaw Chraïbi VL, Pillsbury RW, Cai M, Stow CA, Dove A. 2017. Climate warming and changes in Cyclotella sensu lato in the Laurentian Great Lakes. Limnol Oceanogr. 62(2):768–783. doi:10.1002/lno.10459.
- Reavie ED, Smol JP. 2001. Diatom-environmental relationships in 64 alkaline southeastern Ontario (Canada) lakes: a diatom-based model for water quality reconstructions. J Paleolimnol. 25(1):25–42.
- Rühland KM, Paterson AM, Smol JP. 2015. Lake diatom responses to warming: reviewing the evidence. J Paleolimnol. 54(1):1–35. doi:10.1007/s10933-015-9837-3.
- Rühland KM, Smol JP. 2002. Freshwater diatoms from the Canadian Arctic treeline and development of paleolimnological inference models. J Phycol. 38(2):249–264. doi:10.1046/j.1529-8817.2002.01129.x.
- Salgado J, Sayer CD, Brooks SJ, Davidson TA, Goldsmith B, Patmore IR, Baker AG, Okamura B. 2018. Eutrophication homogenizes shallow lake macrophyte assemblages over space and time. Ecosphere. 9(9):e02406. doi:10.1002/ecs2.2406.
- Schelske CL, Peplow A, Brenner M, Spencer CN. 1994. Low-background gamma counting: applications for 210Pb dating of sediments. J Paleolimnol. 10(2):115–128. doi:10.1007/BF00682508.
- Schindler DW. 1977. Evolution of phosphorous limitation in lakes. Science. 195(4275):260–262. doi:10.1126/science.195.4275.260.
- Schindler DW, Carpenter SR, Chapra SC, Hecky RE, Orihel DM. 2016. Reducing phosphorus to curb lake eutrophication is a success. Environ Sci Technol. 50(17):8923–8929. doi:10.1021/acs.est.6b02204.
- Schwefel R, Gaudard A, Wüest A, Bouffard D. 2016. Effects of climate change on deepwater oxygen and winter mixing in a deep lake (Lake Geneva): comparing observational findings and modeling. Water Resour Res. 52(11):8811–8826. doi:10.1002/2016WR019194.
- Simmatis B, Jeziorski A, Zemanek A, Selbie DT, Hyatt K, Fryer J, Cumming BF, Smol JP. 2018. Long-term reconstruction of deep-water oxygen conditions in Osoyoos Lake (British Columbia, Canada): implications for Okanagan River sockeye salmon. Lake Reserv Manage. 34(4):392–400. doi:10.1080/10402381.2018.1488779.
- Simpson GL. 2012. Analogue methods in paleolimnology In Birks HJB, Lotter AF, Juggins S, Smol JP, editors. Tracking environmental change using lake sediments – Volume 5: data handling and numeric techniques. Dordrecht (Netherlands): Kluwer Academic Publishers; p. 495–522.
- Simpson GL. 2018. Modelling palaeoecological time series using generalised additive models. Front Ecol Evol. 6:149. doi:10.3389/fevo.2018.00149.
- Simpson GL, Oksanen J. 2019. Analogue: analogue and weighted averaging methods for palaeoecology (v. 0.17-3). Available from https://cran.r-project.org/web/packages/analogue/index.html.
- Smith VH, Schindler DW. 2009. Eutrophication science: where do we go from here? Trends Ecol Evol. 24(4):201–207. doi:10.1016/j.tree.2008.11.009.
- Smol JP. 1992. Paleolimnology: an important tool for effective ecosystem management. J Aquat Ecosyst Stress Recov. 1(1):49–58. doi:10.1007/BF00044408.
- Smol JP. 2008. Pollutions of lakes and rivers: a paleoenvironmental perspective, 2nd ed. Oxford (UK): Wiley-Blackwell Publishing; 383p.
- Smol JP. 2019. Under the radar: long-term perspectives on ecological changes in lakes. Proc R Soc B. 286(1906):20190834. doi:10.1098/rspb.2019.0834.
- Stoermer EF, Wolin JA, Schelske CL, Conley DJ. 1985. Postsettlement diatom succession in the Bay of Quinte, Lake Ontario. Can J Fish Aquat Sci. 42(4):754–767. doi:10.1139/f85-097.
- Taranu ZE, Gregory-Eaves I, Leavitt PR, Bunting L, Buchaca T, Catalan J, Domaizon I, Guilizzoni P, Lami A, McGowan S, et al. 2015. Acceleration of cyanobacterial dominance in north temperate-subarctic lakes during the Anthropocene. Ecol Lett. 18(4):375–384. doi:10.1111/ele.12420.
- Wagner C, Adrian R. 2009. Cyanobacteria dominance: quantifying the effects of climate change. Limnol Oceanogr. 54 (6 part 2):2460–2468. doi:10.4319/lo.2009.54.6_part_2.2460.
- Walker IR. 2001. Midges: Chironomidae and related Diptera. In Smol JP, Birks HJB., Last WM, editors. Tracking environmental change using lake sediments – Volume 4: zoological indicators. Dordrecht (Netherlands): Kluwer Academic Publishers; p. 43–66.
- Winslow L, Read J, Woolway R, Brentrup J, Leach T, Zwart J, Albers S, Collinge D. 2019. rLakeAnalyzer: lake physics tools (v. 1.11.4.1). Available from https://cran.r-project.org/web/packages/rLakeAnalyzer/index.html.
- Winter JG, DeSellas AM, Fletcher R, Heintsch L, Morley A, Nakamoto L, Utsumi K. 2011. Algal blooms in Ontario, Canada: increases in reports since 1994. Lake Reserv Manage. 27(2):107–114. doi:10.1080/07438141.2011.557765.
- Wolfe AP, Vinebrooke RD, Michelutti N, Rivard B, Das B. 2006. Experimental calibration of lake-sediment spectral reflectance to chlorophyll a concentrations: methodology and paleolimnological validation. J Paleolimnol. 36(1):91–100. doi:10.1007/s10933-006-0006-6.
