
Abstract
Jones JR, Thorpe AP, Obrecht DV. 2020. Limnological characteristics of Missouri reservoirs: synthesis of a long-term assessment. Lake Reserv Manage. 36:412–422.
Missouri reservoirs reflect their edaphic location in the midcontinent ecotone between historic prairies and forests. Most are small (median surface area of 28 ha) but provide essential services in a region with few natural lakes. Long-term summer monitoring data (1978–2016) show that they span the full trophic state range, with oligotrophic reservoirs in deep, forested valleys and eutrophic–hypereutrophic impoundments in agricultural regions. In regression analysis, row crop (a surrogate for agricultural nutrient loss) along with depth and flushing rate accounted for some two-thirds of variation among reservoir nutrients. Hydrology is a strong influence; total phosphorus (TP) effectively doubles between flushing rates of 0.25/yr and 2/yr when holding land cover and depth constant. Temporal variation characterizes these impoundments; many show >3-fold range in mean summer trophic state metrics, which is influenced by the volume and timing of annual inflow. This variation may mask gradual nutrient-driven changes in trophic state; based on simulation, doubling chlorophyll (Chl) in a given lake over 20 yr could be undetectable with routine summer monitoring. Some two-thirds of cross-system variation in mean Chl was explained by TP, and inorganic solids further reduced variation (negative coefficient). On average, Chl:TP ratios increased from 0.28 to 0.48 during summer, coincident with a decline in inorganic solids. Inorganic particulates largely determine Secchi transparency and can result in light limitation of phytoplankton. Small reservoirs cover nearly double the area of major impoundments worldwide and are known for an intensity of ecological processes, making this information relevant beyond the region.
Humans have impounded flowing water for millennia, with global construction of artificial lakes increasing by an order of magnitude in recent decades. Large impoundments provide essential services, including hydropower, flood control, water supply, recreation, and irrigation. Small impoundments provide similar services, often supporting small-scale farming as well as fish and wildlife propagation; they are ubiquitous, covering nearly double the total area of major impoundments worldwide (Downing et al. Citation2006).
Missouri is located at the intersection of prairies and broad-leafed forests, near the midpoint of the conterminous United States, and below the latitude where glacial lakes prevail (; Nigh and Schroeder Citation2002). Oxbow and scour lakes naturally occur along its 2 major rivers (Missouri and Mississippi), but most lentic habitats are impoundments constructed during the past 60 years in valleys with suitable morphology and hydrology (; Jones et al. Citation2008b). They occur throughout the state in predominantly agricultural, forested, and urban catchments and mixtures of these cover types (). There is a strong conservation and outdoor sport ethic in the state, and impoundments dedicated to recreational fishing and adjacent wildlife habitat are common. Municipal water supply reservoirs have been constructed throughout the state but are numerous in northern Missouri, where groundwater is naturally saline.
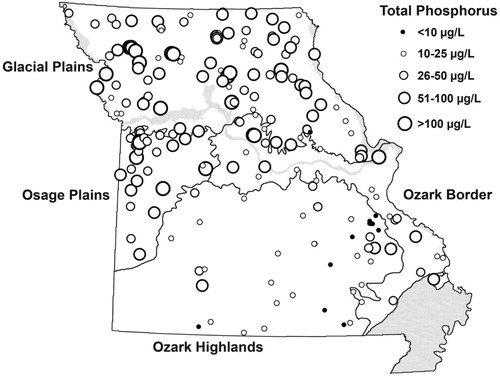
Figure 1. Physiographic sections of Missouri and reservoirs included in this summary. Locations are represented by scaled symbols showing mean long-term total phosphorus concentrations (µg/L) for each reservoir. Impoundments in the Mississippi Lowlands in the southeastern corner of the state (shaded) have been sampled occasionally and are included in the long-term monitoring effort.
Reservoir study at the University of Missouri started in 1975 and continues to the present; emphasis has been on quantifying how morphology, hydrology, and edaphic factors account for trophic state and particulate inorganic matter, and determining the variation of these metrics, within and among impoundments, over time (Jones and Knowlton Citation1993, Jones et al. Citation2004, Citation2008b, Citation2009, Citation2011a, Citation2011b). This information adds to our understanding of processes in artificial lakes, informs management efforts, and provides a basis to predict water quality in proposed impoundments. This note is a synopsis of our publications on Missouri reservoirs and serves as a guide to central findings on multiple limnological topics.
Program overview
Much of the information on Missouri reservoirs comes from a long-term summer monitoring program (1978 to 2016). Each summer university field crews collected composited samples from the surface layer at a near-dam site from about 70 reservoirs on 3 or 4 occasions during May–August (Jones et al. Citation2008b). In total, 200 impoundments have data from 4 to 36 summer seasons (half represented by >11 seasons). Methodology is detailed in Jones et al. (Citation2008b). In addition to statewide summer monitoring, several reservoir-specific studies were conducted to evaluate temporal variation and other limnological characteristics.
Results and discussion
Morphology, stratification, and oxygen depletion
Consistent with reservoir design elsewhere, Missouri impoundments have large watersheds with a median watershed-to-surface area ratio of 18, which results in a median flushing rate of once per year (). Large watersheds support stable water levels in artificial lakes, with inflow volume determined by annual rainfall. The median reservoir has a surface area of 28 ha and the median dam height is 13 m (mean depth is approximately one-fourth of this value). Morphology metrics vary by an order of magnitude among sampled impoundments ().
Table 1. Summary statistics from 200 Missouri reservoirs sampled over at least 4 summers.
Most reservoirs stably stratify by mid May, but few are sufficiently deep to have hypolimnia with near-uniform temperatures (Jones et al. Citation2011a). Cross-system variation in mixed depth and thermocline depth was largely accounted for by maximum length and maximum depth of these basins. Most natural lakes with similar features would not stratify; less wind exposure in impounded valleys and modest water clarity likely account for this difference (Jones et al. Citation2011a). Surface temperatures are usually >28 C by midsummer, and values >30 C occur (12% of 8008 measurements). Near-surface thermoclines were common in summer profiles, particularly in small impoundments. Mixed layers deepen during late summer, influenced by seasonal cooling (Knowlton and Jones Citation1995). By August, most impounded water is >20 C in all but the deepest reservoirs, with turnover in late September. Warm monomictic circulation prevails in the south and transitions to the dimictic type in the north, reflecting the regional temperature gradient. Polymictic circulation is found in impoundments located in shallow valleys.
Dissolved oxygen depletion occurs below the mixed layer by mid-May, and by August most profiles had layers with <1 mg/L (Jones et al. Citation2011a). Surface area and chlorophyll (Chl) explained more than one-third of among reservoir variation in the date of anoxia, while Chl explained half of variation in dissolved oxygen content below the mixed layer. These autotrophic processes are strong enough to stand out among other sources of variation and are consistent with productive lakes worldwide (Jones et al. Citation2011a). A Bayesian statistical model shows similar relationships between hypolimnetic oxygen demand and Chl in these reservoirs and a national dataset (Yuan and Jones Citation2020a). Data from a large hydropower reservoir showed that discharge caused rapid replacement of hypolimnetic water near the dam and accounted for >80% of interannual variation in deep-layer oxygen depletion during summer (Knowlton and Jones Citation1989a). Diel and seasonal changes in pH and dissolved oxygen in a shallow, macrophyte-dominated reservoir showed large daily pulses during summer, with community respiration in a steady-state relationship with photosynthesis over time (Wylie and Jones Citation1991).
The sampling protocol was evaluated by collecting paired samples from the surface and as a composite from the oxygen saturated zone of the water column. This comparison showed that differences in nutrients and Chl between these collections were usually small (∼5%) relative to temporal variation (Knowlton and Jones Citation1989b, Citation2006a, Citation2006b). Differences between samples increased with surface temperature-clines, when ephemeral subsurface phytoplankton layers were detected. Green sulfur bacteria are found in the metalimnion of these reservoirs, located in low-light and anoxic conditions (Knowlton and Jones Citation1989b, Knowlton et al. Citation1989).
Statewide patterns in nutrients, algal chlorophyll, and trophic state
In this long-term dataset, mean total phosphorus (TP) ranged from 6 to 397 µg/L among individual impoundments, and total nitrogen (TN) from 110 to 3290 µg/L (median values of 40 and 790 µg/L, respectively, ). Most TN:TP ratios were between 10 and 30, with a median of 19 (). These plant nutrients are correlated, with the increase in TP accelerated relative to TN, which results in a sharp decline in this ratio over the measured range of TP (Jones et al. Citation2011a). Algal Chl ranged from 1 to 223 µg/L with a median of 16 µg/L, and Secchi depth ranged from 0.2 to 4.4 m with a median of 0.9 m (). Based on TP trophic state criteria (Jones et al. Citation2008a), some 6% of the reservoirs are oligotrophic, 25% mesotrophic, 60% eutrophic, and 9% hypereutrophic. The prevalence of mesotrophic and eutrophic reservoirs is similar to findings elsewhere in the midcontinent region (Jones et al. Citation2008b).
Missouri reservoirs are located in 4 distinct physiographic sections delineated based on geomorphology, potential vegetation and major soil groups (Nigh and Schroeder Citation2002; , ). Cropland increases to the north and west along this axis, while forest cover declines (). The statewide trophic state pattern matches this gradient in land cover, with oligotrophic reservoirs generally in the forested Ozark Highlands in the south, with eutrophic and hypereutophic reservoirs in the western Osage Plains and the northern Glacial Plains sections, and transition conditions in the Ozark Border section (, ). Reservoir nutrients are similar in both Plains sections, and collectively are double to triple concentrations in Ozark Highlands, as illustrated by TP in (; Jones et al. Citation2008a, Citation2009). This pattern is sufficiently strong that latitude and longitude account for about one-quarter of the cross-system variation in TP and one-third of the variation in TN measured statewide. Concentrations of algal Chl match the statewide nutrient pattern, with a concurrent decline in Secchi transparency (). Bacterial abundance increases with TP and organic matter in these reservoirs. Values are within the mid range for aquatic systems worldwide, with ∼5-fold increase between oligo- and eutrophic lakes (Thorpe and Jones Citation2005).
Table 2. Median values of land cover and limnological parameters in the major physiographic sections of Missouri.
Conductivity values were mostly between 100 and 250 µS, but unlike many lake districts worldwide, cross-system correlations between conductivity and plant nutrients were modest (Jones et al. Citation2008b). It seems anthropogenic activities in this agricultural region obscure natural geology–nutrient relations. Most of the state has circumneutral, hard water of the bicarbonate type, with regional differences in ionic content and concentrations associated with local geologic features (Jones Citation1977). A small number of reservoirs, located in noncarbonate regions, are potentially acid sensitive, but detrimental effects were not evident (Wylie and Jones Citation1991).
Role of land cover and hydrology in determining nutrients and temporal variation
These midcontinent reservoirs broadly fit the external loading model put forth by Vollenweider (Citation1975). Using the proportion of watershed crop cover as a surrogate for non-point-source nutrient loss from agriculture, dam height (a morphology surrogate) and flushing rate (hydrology) in regression analyses accounted for some two-thirds of among reservoir variation in nutrients (Jones et al. Citation2004, Citation2008a, Citation2009). Even among reservoirs with >80% grass and forest cover, crop accounted for most of the variation. Nutrients showed a strong negative relation with forest cover, presumably because of modest nutrient loss relative to agriculture (Perkins et al. Citation1998). Several Plains reservoirs with low nutrient levels have watersheds dominated by forests and physical features similar to impoundments in the Ozark Highlands, which illustrates the importance of these characteristics on trophic state. Estimates suggest urban reservoirs have twice the nutrient level of reservoirs in non-cropland basins (forest and grass, Jones et al. Citation2004). Small impoundments are numerous in the Glacial Plains, and a 1 yr study of 42 of these waterbodies with a median surface area of 7 ha suggests they broadly match the trophic state characteristics of nearby, routinely sampled impoundments (median surface area of 45 ha), and agree with our regression models describing pelagic nutrients (Jones Citation2010).
Using historic vegetative surveys (circa 1815–1850), the proportion of native prairie in these catchments accounted for nearly half of cross-system variation in reservoir nutrients. Land conversion from prairie to cropland accounts for this finding; most arable soils were former prairies, which dominated the Plains sections. Adding historic cover to contemporary conditions, however, did little to reduce variation. This historic information stands as our best measure of baseline conditions in these catchments (Jones et al. Citation2009).
Consistent with lake modeling (Vollenweider Citation1975), hydrology has a strong influence on reservoir nutrient levels; among Plains reservoirs, TP effectively doubles between flushing rates of 0.25/yr and 2/yr when holding crop and basin depth constant. Rainfall influences temporal variation in nutrients within individual reservoirs; more than 90% of Plains reservoirs averaged about 40% greater TP in a year of high rainfall relative to low rainfall (Jones et al. Citation2008a). An extreme example was measured in a large reservoir where TP averaged 18 µg/L after a protracted drought but increased to 163 µg/L in response to wet conditions (Knowlton and Jones Citation2006a). Positive correlation between inflow and water quality variables in Lake of the Ozarks further quantifies the role of hydrology on temporal variation (Jones and Kaiser Citation1988, Perkins and Jones Citation2000). Likewise, hydrology accounts for variation in a rapidly flushed, tailwater reservoir, where conspicuous algal blooms developed during low flow (Knowlton and Jones Citation1990). Inflow volume and its timing influence temporal variation; spring inflows are more likely to mix within the water column, while summer inflows, particularly those associated with storms, often form density currents that have little effect on surface water quality (Knowlton and Jones Citation1995). These findings emphasize the importance of considering both hydrology and land cover when managing for nutrient reduction (Jones et al. Citation2008a).
Interannual variation in summer means is a distinctive feature of reservoir water quality (Knowlton et al. Citation1984, Knowlton and Jones Citation1995, Citation2006a, Citation2006b); statewide, many reservoirs show >3-fold range in mean summer trophic state metrics. Temporal variation of Chl within individual reservoirs is well documented; maximum values averaged 26 times the minimum, and the maximum can reasonably be estimated at 4 times the reservoir mean value (Jones et al. Citation2008b, Citation2011a). Some 700 daily samples collected from a mesotrophic lake over 6 summer seasons illustrate variation in Chl, with 20% of the samples at ≥1.5 times the mean and 12% double the mean (Jones and Knowlton Citation2005a). Without discernable changes in the watershed over this period, there was a ∼2-fold difference among seasonal mean Chl, providing incontrovertible evidence of temporal variation. To overcome the effects of interannual variation, long-term averages used to characterize the trophic state of individual Missouri impoundments are based on at least 4 sampling seasons (Knowlton and Jones Citation2006a).
An implication is that nutrient-driven changes in trophic state are not likely to stand out from the noise of ordinary variation unless they are large or rapid. Based on simulation, doubling Chl in a given lake over 20 years could be virtually undetectable with routine lake monitoring data, and it would require around a decade to detect similar changes in TP and TN (Knowlton and Jones Citation2006b). A study of temporal synchrony of water quality metrics, measured in 4 reservoirs located in adjacent watersheds over 6 years, showed greater influence of external conditions on nutrients than transparency or algal biomass (Knowlton and Jones Citation2007).
Fisheries management practices can alter water quality such that changes are apparent in survey data. In impoundments created for sport fisheries, grass carp and herbicides are used to control macrophytes, shifting these impoundments to plankton-dominated communities is consistent with the alternate stable state concept (Scheffer et al. Citation1993). In 2 reservoirs TP doubled in about 6 years, with Chl increasing by >6-fold in one system (Knowlton and Jones Citation2006b). Such practices result in dramatic changes that uncouple pelagic nutrients from the cross-system pattern determined by land cover, morphology, and hydrology and are a source of unquantified variation (Jones et al. Citation2004, Citation2008a).
Carbon dioxide and sediment organic carbon
The role of lakes and reservoirs in the global carbon budget is an active research topic. Our data show that net annual carbon dioxide flux from 15 Glacial Plains reservoirs was positively correlated with mean depth and flushing rate, with the smallest annual efflux measured in shallow, fertile impoundments (Jones et al. Citation2016). Efflux values fit within the lower range reported for temperate lakes worldwide (mean of 13 g/m2 C). There was a strong seasonal pattern in efflux, with an average of 70% occurring at the end of spring mixis; some 20% was reabsorbed during summer stratification and the remaining 50% was lost during autumnal mixing (Jones et al. Citation2016). Loss of carbon dioxide was modest relative to annual burial rates of sediment organic carbon. The average flux was ∼6% of the carbon buried in 4 small Glacial Plains impoundments (183 to 279 g/m2 yr C; Pittman et al. Citation2013). These sediment organic carbon values are in the mid range reported for lakes and reservoirs located elsewhere.
Suspended solids and transparency
Constructed in erosional valleys, many reservoirs have levels of suspended solids (SS) commonly found in shallow natural lakes (Hoyer and Jones Citation1983, Knowlton and Jones Citation2000, Jones and Knowlton Citation2005b, Jones et al. Citation2008b). The nonvolatile fraction (NVSS, ) is allochthonous material delivered from the catchment, particularly from agricultural watersheds, and inorganic tripton resuspended from sediments and shoreline by wave action and organisms. The volatile fraction (VSS, ) measures particulate organics. VSS is a surrogate and correlate of algal biomass but includes organic tripton and zooplankton in surface samples. Therefore, this measurement is influenced by edaphic factors affecting nutrient loading (Jones and Knowlton Citation2005b, Jones et al. Citation2008b). On average, the weight of these 2 fractions was similar among summer collections, but there was temporal change in their proportions. Between May and August NVSS declined by an average of 25%, presumably reflecting sedimentation of materials delivered by fluvial inputs in spring, but the dynamic balance with resuspension and turbid interflows during the summer is unknown, given the scale of our monitoring data. VSS increased by some 50% over the season, as mediated by algal growth. The statewide pattern for solids matches that of nutrients and Chl ().
Another measure of suspended material in these reservoirs is the filterable seston (fTSS, ), which are particles in filtrate of the SS analysis (Knowlton and Jones Citation2000, Jones et al. Citation2008b). These particles are missed by conventional determinations of SS and would include fine clay-size materials and small organics. Laser diffraction data showed a strong correlation between fTSS in filtrate and particles of 2.06 µm in the reservoir sample (r = 0.78, square root transformation, n = 272; Jones and Hubbart Citation2011). This measurement was included to improve estimates of total particulates in these reservoirs. Most fTSS measurements were <1.5 mg/L, but in 25% of samples fTSS was greater than NVSS. Nonalgal seston (NAS) is the sum of NVSS and fTSS and provides our best estimate of mineral seston (; Knowlton and Jones Citation2000). Both fTSS and NAS followed the regional pattern of particulate suspended solids ().
There is a wide range of optical conditions in Missouri reservoirs, with individual Secchi transparency readings ranging from <0.1 to 8.6 m (n = 9048). Analyses show that inorganic materials influence transparency in most impoundments (Hoyer and Jones Citation1983, Knowlton and Jones Citation2000, Jones et al. Citation2008b, Watanabe et al. Citation2009). The maximum observed Secchi has been quantified across the range of Chl values in these reservoirs, with NAS accounting for most of the deviation below maximum transparency (median of 45% of maximum transparency; Jones and Hubbart Citation2011). Similarly, among reservoirs, the vertical diffuse attenuation of photosynthetically available radiation was primarily determined by nonalgal suspended particles (82%) relative to algal particles (17%) and colored dissolved organic matter (<1%, Watanabe et al. Citation2009). Average light transmission in ∼80% of these reservoirs was between 5 and 35%/m, with over half <21%/m (Watanabe et al. Citation2009).
Chlorophyll response to nutrients and nonalgal seston
The quantitative relationship between Chl and TP in these reservoirs has been studied extensively (Hoyer and Jones Citation1983, Knowlton and Jones Citation1996, Citation2000, Jones and Knowlton Citation2005a, Jones et al. Citation2008b, Yuan and Jones Citation2020b). Among reservoir means in our dataset, TP explained some two-thirds of the variation in Chl, with nonalgal seston accounting for additional variation (negative coefficient), which resulted in a steeper slope coefficient for TP (Jones et al. Citation2008b). Nonalgal seston can cause light limitation of phytoplankton in the mixed layer (Knowlton and Jones Citation2000), but P bound to mineral seston would also reduce availability of the TP pool to phytoplankton; both factors would suppress Chl yields per unit of TP (Chl:TP). Reservoir-specific evidence comes from Lake of the Ozarks, where impoundment of an upstream reservoir (Truman Lake) reduced suspended solids and Chl:TP increased (Jones and Kaiser Citation1988).
Reservoir samples from early summer monitoring frequently include low Chl:TP values, which fall below the central distribution in the Chl-TP pattern (Jones and Knowlton Citation2005a). These collections coincide with inflows that deliver high NVSS and fTSS levels to impounded water; this feature is prominent in spring and early summer, when inflows often mix with the surface layer. Similar inflows during summer stratification typically form interflows, with less direct influence on the epilimnion. These low Chl:TP samples are ephemeral and episodic, being common in years of above-average runoff (Jones and Knowlton Citation2005a). On average, Chl:TP increases from 0.28 in May to 0.48 in August, coincident with a decline in mineral turbidity and increased temperature. Based on a Bayesian network model, components of the TP pool were partitioned into dissolved forms and the fractions associated with either sediment or phytoplankton. By identifying sources of variability in TP, this approach increased the association between Chl and TP in individual lakes (Yuan and Jones Citation2020b). Preliminary analysis shows remote sensing of Chl in these turbid systems is feasible (Lin et al. Citation2018).
Addition of the TN:TP ratio (positive coefficient) significantly reduced residual variation in the Chl and TP regression relations among individual observations and reservoir means (Jones et al. Citation2008b). The influence of TN is comparatively minor and is likely tied to depletion of available forms during stratification (Knowlton and Jones Citation2000). Experimental evidence indicates that N-limitation of phytoplankton occurs occasionally (Knowlton and Jones Citation1996, Perkins and Jones Citation2000). Low TN:TP ratios tend to co-occur with high mineral turbidity and low transparency, conditions favoring light rather than nutrient limitation of algal biomass (Jones et al. Citation2008b). Nitrogen limitation of algal biomass, however, was documented in a seasonally flooded wetland complex (Wylie and Jones Citation1986).
Averaging Chl and TP data into seasonal means or long-term means affects inferences from large-scale regression analyses (Jones et al. Citation1998). Regressions based on aggregated data are typically stronger than those based on unaggregated data because averaging reduces variation in the response of Chl to TP. The strong among-reservoir pattern found in lake means does not always reflect the relation in individual impoundments because of variation, but the recent Bayesian analysis addresses this shortcoming (Yuan and Jones Citation2020b).
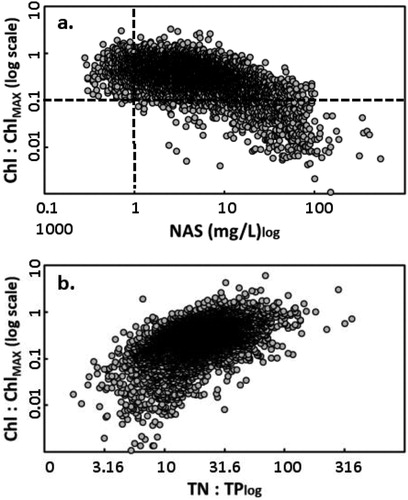
Quantifying peak algal biomass remains a goal in eutrophication research. To better determine such conditions, we identified an upper boundary delineating maximum Chl across the range of TP in individual samples. This boundary encompasses the envelope of data from our summer monitoring and has a median Chl:TP ratio of 1.2, which is about triple the median ratio in the dataset (Kaiser et al. Citation1994, Jones and Knowlton Citation2005a, Jones et al. Citation2011b). Half of the samples contained between 0.22 and 0.50 of maximum Chl and 8% contained <0.1 of this ratio (Chl:ChlMAX, n = 9361). Numerous factors can constrain Chl below the maximum, with a particularly apparent role of NAS (); at 1 mg/L NAS the largest observed ratio was 1.4, at 10 mg/L NAS it was 0.9, and at 100 mg/L NAS it was 0.1 No samples with <1 mg/L contained <0.1 Chl relative to the maximum (Chl:ChlMAX), but this low ratio was frequently measured as NAS increased (). Strong biotic control of Chl is unlikely because small-bodied taxa dominate summer zooplankton (Canfield and Jones Citation1996). Limited data indicate (Chl:ChlMAX) can be exceeded when large cyanobacteria are dominant (Jones et al. Citation2011b). There is also strong evidence that (Chl:ChlMAX) increases as the TN:TP ratio increases (). This response to TN:TP was also detected in Chl-TP regressions based on individual samples and long-term averages (Jones et al. Citation2008b).
Figure 2. (a) Log transformation of chlorophyll (Chl, µg/L) divided by the maximum Chl observed in individual Chl-TP pairs in the dataset (calculated with measured TP using Eq. 1 in Jones et al. Citation2011b) against the log transformation of nonalgal mineral seston (NAS mg/L) in this long-term dataset (n = 7586). Lines delineate a Chl:Chl-maximum ratio of 0.1 and an NAS value of 1 mg/L. (b) Log transformation of the Chl:Chl-maximum ratio against the log transformation of the total nitrogen:total phosphorus ratio in this long-term dataset (TN:TP, n = 8996 pairs).
Conditions favoring maximum Chl:TP in reservoirs may be short-lived, occurring in less than 10% of summer samples in one intensive study, and numerous reservoirs have never supported maximum Chl in our long-term record (Jones et al. Citation2011b). The frequency of Chl >10 µg/L, a breakpoint where nuisance conditions may start to occur, increases sharply across the mesotrophc range, and reservoirs near the meso–eutrophic boundary show this value in 50% of samples (Jones et al. Citation2008a). Limited data from unstratified periods suggest Chl:TP is highly variable, with nutrients assuming a less dominant role and light, grazing, and inflows exerting a greater influence on biomass than during summer (Knowlton and Jones Citation1995, Knowlton and Jones Citation2000, Perkins and Jones Citation2000).
Algal taxa and toxins
Most Chl in Missouri reservoirs is contained in small algae; 89% was <35 µm (nanoplankton, as µg/L), of which 72% was <11 µm (nanoplankton; Jones et al. Citation2008b). Based on limited taxonomic data the dominant division was Cyanophyta, followed by Bacillariophya, but each major division was dominant in at least one reservoir (Jones et al. Citation2008b). On average, the molar ratios of N:P and C:P in phytoplankton (19 and 170, respectively) were similar to global values (Yuan and Jones Citation2019).
Cyanobacterial toxins are a health and environmental risk in midcontinent reservoirs. The algal toxin microcystin has been detected in over half of inventoried reservoirs and was measurable in >20% of samples (Graham and Jones Citation2009). Most values were <1 µg/L; limited sampling shows small detectable levels of cylindropermopsin (Graham and Jones Citation2009). Microcystin was generally lower in Missouri reservoirs than in nearby states with a pattern of increasing values with latitude (Graham et al. Citation2004). In a regional study, microcystin in phytoplankton >100 μm averaged ∼40% of the total, while smaller size classes contributed 9–20% (Graham and Jones Citation2007). In one Missouri reservoir microcystin was detected year-round, showing a seasonal pattern with increasing levels in summer corresponding to algae >35 μm and cyanobacterial biovolume (Graham et al. Citation2006).
Large reservoirs and oxbow lakes
Large reservoirs exhibit complex variation in the distribution of nutrients, suspended solids and phytoplankton, with a longitudinal gradient between nutrient-rich, turbid riverine headwaters and the lacustrine zone near the dam of these impoundments (Jones and Novak Citation1981, Jones and Kaiser Citation1988, Knowlton and Jones Citation1989a, Knowlton and Jones Citation1995, Perkins and Jones Citation2000, Obrecht et al. Citation2005). The magnitude of gradients is determined by hydrology, dilution, nutrient uptake and sedimentation. These gradients vary over time and among different arms of the same lake. Declines of >80% the concentrations of TP, solids and Chl have been recorded, concurrent with increased transparency.
Naturally formed oxbow and scour lakes occur in rich bottomland soils along the Missouri and Mississippi rivers. Their shallow morphometry is conducive to internal cycling of mineral seston and nutrients, along with river inputs (Jones et al. Citation2008b). Limited data show these waterbodies have some 5 times the NVSS, 4 times the TP, Chl and VSS, 2 times the TN, and one-third the transparency as compared to the statewide average (Jones et al. Citation2008b). Scour lakes were formed in 1993 along the Missouri River when levees breached during a record flood. Consistent with the flood pulse concept (Junk et al. Citation1989), sites connected to riverine influence transition between high connectivity (high turbidity, dissolved and particulate nutrients, and light limitation of algal growth) and low connectivity (low turbidity, nutrients and nutrient limitation of phytoplankton), which accounted for enormous temporal variation. For protected scour basins, internal processes were important (Knowlton and Jones Citation1997, Citation2003).
Conclusion
Missouri reservoirs strongly reflect their edaphic location in the midcontinent ecotone between historic prairies and forests. These cover types, altered by current land use practices, determine non-point-source nutrient input, which is modified by morphology and hydrology. They are characterized by interannual variability in limnological metrics, with one reservoir showing an order of magnitude change in TP in response to extreme drought and rainfall. Analyses suggest an intensity of ecological processes in small impoundments, including carbon flux and burial, indicating they play a major role in global cycles (Downing Citation2010). Most Missouri reservoirs are comparatively small, making information on their limnological characteristics relevant beyond the region.
Daniel V. ObrechtSchool of Natural Resources, University of Missouri, Anheuser-Busch Natural Resources Building,
Columbia, MO 65211-7240
[email protected]
Acknowledgments
Sincere appreciation to Carol Pollard, Matthew Knowlton, Jennifer Graham, and scores of students over the decades who participated in the sampling campaign and processed collections in the laboratory. Drs. Alba Argerich and Rebecca North encouraged this essay.
Additional information
Funding
References
- Canfield TJ, Jones JR. 1996. Zooplankton abundance, biomass, and size-distribution in selected Midwestern waterbodies and relations with trophic state. J Freshwater Ecol. 11(2):171–181. doi:10.1080/02705060.1996.9663476.
- Downing JA. 2010. Emerging global role of small lakes and ponds: little things mean a lot. Limnetica. 29:9–24.
- Downing JA, Prairie YT, Cole JJ, Duarte CM, Tranvik LJ, Striegl RG, McDowell WH, Kortelainen P, Caraco NF, Melack JM, et al. 2006. The global abundance and size distribution of lakes, ponds, and impoundments. Limnol Oceaogr. 51:288–2397.
- Graham JL, Jones JL. 2007. Microcystin distribution in physical size class separations of natural plankton communities. Lake Reserv Manage. 23(2):161–168. doi:10.1080/07438140709353919.
- Graham JL, Jones JR. 2009. Microcystin in Missouri reservoirs. Lake Reserv Manage. 25(3):253–263. doi:10.1080/07438140903143239.
- Graham JL, Jones JR, Jones SB, Clevenger TE. 2006. Spatial and temporal dynamics of microcystin in a Missouri reservoir. Lake Reserv Manage. 22(1):59–68. doi:10.1080/07438140609353884.
- Graham JL, Jones JR, Jones SB, Downing JA, Clevenger TE. 2004. Environmental factors influencing microcystin distribution and concentration in the Midwestern United States. Water Res. 38(20):4395–4404. doi:10.1016/j.watres.2004.08.004.
- Hoyer MV, Jones JR. 1983. Factors affecting the relation between phosphorus and chlorophyll a in Midwestern reservoirs. Can J Fish Aquat Sci. 40(2):192–199. doi:10.1139/f83-029.
- Jones JR. 1977. Chemical characteristics of some Missouri reservoirs. Trans Mo Acad Sci. 10:58–71.
- Jones JR. 2010. Missouri reservoirs in the Glacial Plains: evaluating small impoundments. Verh Internat Verein Limnol. 30(10):1629–1633. doi:10.1080/03680770.2009.11902390.
- Jones JR, Hubbart JA. 2011. Empirical estimation of non-chlorophyll light attenuation in Missouri reservoirs using deviation from the maximum observed value in the Secchi–chlorophyll relationship. Lake Reserv Manage. 27(1):1–5. doi:10.1080/07438141.2011.554962.
- Jones JR, Kaiser MS. 1988. Limnological characteristics of Lake of the Ozarks, Missouri II: measurements following formation of a large reservoir upstream. Verh Internat Verein Limnol. 23(2):976–984. doi:10.1080/03680770.1987.11899753.
- Jones JR, Knowlton MF. 1993. Limnology of Missouri reservoirs: an analysis of regional patterns. Lake Reserv Manage. 8(1):17–30. doi:10.1080/07438149309354455.
- Jones JR, Knowlton MF. 2005a. Chlorophyll response to nutrients and non-algal seston in Missouri reservoirs and oxbow lakes. Lake Reserv Manage. 21(3):361–371. doi:10.1080/07438140509354441.
- Jones JR, Knowlton MF. 2005b. Suspended solids in Missouri reservoirs in relation to catchment features and internal processes. Water Res. 39(15):3629–3635. doi:10.1016/j.watres.2005.06.007.
- Jones JR, Knowlton MF, Kaiser MS. 1998. Effects of aggregation on chlorophyll-phosphorus relations in Missouri reservoirs. Lake Reserv Manage. 14(1):1–9. doi:10.1080/07438149809354104.
- Jones JR, Knowlton MF, Obrecht DV. 2008a. Role of land cover and hydrology in determining nutrients in mid-continent reservoirs: implications for nutrient criteria and management. Lake Reserv Manage. 24(1):1–9. doi:10.1080/07438140809354045.
- Jones JR, Knowlton MF, Obrecht DV, Cook EA. 2004. Importance of landscape variables and morphology on nutrients in Missouri reservoirs. Can J Fish Aquat Sci. 61(8):1503–1512. doi:10.1139/f04-088.
- Jones JR, Knowlton MF, Obrecht DV, Graham JL. 2011a. Temperature and oxygen in Missouri reservoirs. Lake Reserv Manage. 27(2):173–182. doi:10.1080/07438141.2011.583713.
- Jones JR, Knowlton MF, Obrecht DV, Thorpe AP, Harlan JD. 2009. Role of contemporary and historic vegetation on nutrients in Missouri reservoirs: implications for developing nutrient criteria. Lake Reserv Manage. 25(1):111–118. doi:10.1080/07438140902772079.
- Jones JR, Novak JR. 1981. Limnological characteristics of Lake of the Ozarks, Missouri. Verh Int Verein Limnol. 21(2):919–925. doi:10.1080/03680770.1980.11897111.
- Jones JR, Obrecht DV, Graham JL, Balmer MB, Filstrup CT, Downing JA. 2016. Seasonal patterns in carbon dioxide in 15 mid-continent (USA) reservoirs. Inland Waters. 6(2):265–272. doi:10.5268/IW-6.2.982.
- Jones JR, Obrecht DV, Perkins BD, Knowlton MF, Thorpe AP, Watanabe S, Bacon RR. 2008b. Nutrients, seston and transparency of Missouri reservoirs and oxbow lakes: an analysis of regional limnology. Lake Reserv Manage. 24(2):155–180. doi:10.1080/07438140809354058.
- Jones JR, Obrecht DV, Thorpe AP. 2011b. Chlorophyll maxima and chlorophyll: total phosphorus ratios in Missouri reservoirs. Lake Reserv Manage. 27(4):321–328. doi:10.1080/07438141.2011.627625.
- Junk WJ, Bayley PB, Sparks RE. 1989. The flood pulse concept in river-floodplain systems. In: Dodge DP, editor. Proceeding of the International Large River Symposium. Canadian Special Publication Fisheries Aquatic Sciences, vol. 106. Ottawa: Department of Fisheries and Oceans; p. 110–127.
- Kaiser MS, Speckman PL, Jones JR. 1994. Statistical models for limiting nutrient relations in inland waters. J Am Statist Assoc Appl Case Stud. 89(426):410–423. doi:10.1080/01621459.1994.10476763.
- Knowlton MF, Hoyer MV, Jones JR. 1984. Incorporating temporal variability in the sampling design for trophic state assessment. J Am Water Resources Assoc. 20(3):397–407. doi:10.1111/j.1752-1688.1984.tb04722.x.
- Knowlton MF, Jones JR. 1989a. Summer distribution of nutrients, phytoplankton and dissolved oxygen in relation to hydrology in Table Rock Lake, a large Midwestern reservoir. Archiv Hydrobiol/Suppl. 83:197–225.
- Knowlton MF, Jones JR. 1989b. Comparison of surfaces and depth integrated composite samples for estimating algal biomass and phosphorus values, and notes on the vertical distribution of autotrophs in midwestern lakes. Archiv Hydrobiol/Suppl. 83:175–196.
- Knowlton MF, Jones JR. 1990. Occurrence and prediction of algal blooms in Lake Taneycomo. Lake Reserv Manage. 6(2):143–152. doi:10.1080/07438149009354704.
- Knowlton MF, Jones JR. 1995. Temporal and spatial dynamics of suspended sediment, nutrients, and algal biomass in Mark Twain Lake, Missouri. Archiv Hydrobiol. 135:145–178.
- Knowlton MF, Jones JR. 1996. Experimental evidence of light and nutrient limitation of algal growth in a turbid midwest reservoir. Archiv Hydrobiol. 135:321–335.
- Knowlton MF, Jones JR. 1997. Trophic status of Missouri River floodplain lakes in relation to basin type and connectivity. Wetlands. 17(4):468–475. doi:10.1007/BF03161512.
- Knowlton MF, Jones JR. 2000. Non-algal seston, light, nutrients and chlorophyll in Missouri reservoirs. Lake Reserv Manage. 16(4):322–332. doi:10.1080/07438140009354239.
- Knowlton MF, Jones JR. 2003. Connectivity influences temporal variation of limnological conditions in Missouri River scour lakes. Lake Reserv Manage. 19(2):160–170. doi:10.1080/07438140309354082.
- Knowlton MF, Jones JR. 2006a. Natural variability in lakes and reservoirs should be recognized in setting nutrient criteria. Lake Reserv Manage. 22(2):161–166. doi:10.1080/07438140609353893.
- Knowlton MF, Jones JR. 2006b. Temporal variation and assessment of trophic state indicators in Missouri reservoirs: implication for lake monitoring. Lake Reserv Manage. 22(3):261–271. doi:10.1080/07438140609353904.
- Knowlton MF, Jones JR. 2007. Temporal coherence of water quality variables in a suite of Missouri reservoirs. Lake Reserv Manage. 23(1):49–58. doi:10.1080/07438140709353909.
- Knowlton MF, Jones JR, Perkins BD. 1989. A comment on “The measurement ofbacteriochlorophyll and algal chlorophyll a in natural waters” by Caraco and Puccoon. Limnol Oceanogr. 34(7):1381–1382. doi:10.4319/lo.1989.34.7.1381.
- Lin S, Qi J, Jones JR, Stevenson RJ. 2018. Effects of sediments and coloured dissolved organic matter on remote sensing of chlorophyll-a using Landsat TM/ETM + over turbid waters. Int J Remote Sens. 39(5):1421–1440. doi:10.1080/01431161.2017.1404164.
- Nigh TA, Schroeder WA. 2002. Atlas of Missouri ecoregions. Jefferson City (MO): Missouri Dept. of Conservation; 212p.
- Obrecht DV, Thorpe AP, Jones JR. 2005. Response in the James River Arm of Table Rock Lake to point source phosphorus reduction. Verh Int Verein Limnol. 29(2):1043–1048. doi:10.1080/03680770.2005.11902843.
- Perkins BD, Jones JR. 2000. Limnological characteristics of Lake of the Ozarks, Missouri III: seasonal patterns in nutrients, chlorophyll and algal bioassays. Verh Int Verein Limnol. 27(4):2218–2224. doi:10.1080/03680770.1998.11901633.
- Perkins BD, Lohman K, Van Nieuwenhuyse EE, Jones JR. 1998. An examination of land cover and stream water quality among physiographic provinces of Missouri, USA. Verh Int Verein Limnol. 26(3):940–947. doi:10.1080/03680770.1995.11900857.
- Pittman B, Jones JR, Millspaugh J, Kremer RJ, Downing JA. 2013. Sediment organic carbon distribution in 4 small northern Missouri impoundments: implications for sampling and carbon sequestration. Inland Water. 3(1):39–46. doi:10.5268/IW-3.1.507.
- Scheffer M, Hosper SH, Meijer M-L, Moss B, Jeppesen E. 1993. Alternative equilibria in shallow lakes. Trends Ecol Evol. 8(8):275–279. doi:10.1016/0169-5347(93)90254-M.
- Thorpe AP, Jones JR. 2005. Bacterial abundance in Missouri (USA) reservoirs in relation to trophic state and global patterns. Verh Int Verein Limnol. 29(1):239–245. doi:10.1080/03680770.2005.11902005.
- Watanabe S, Knowlton MF, Vincent WF, Jones JR. 2009. Optical properties of coloured dissolved organic matter in Missouri reservoirs. Verh Int Verein Limnol. 30(7):1117–1120. doi:10.1080/03680770.2009.11902314.
- Vollenweider RA. 1975. Input-output models: with special reference to the phosphorus loading concept in limnology. Schweiz Z Hydrologie. 37(1):53–84. doi:10.1007/BF02505178.
- Wylie GD, Jones JR. 1986. Limnology of wetland complex in the Mississippi alluvial valley of southeast Missouri. Arch Hydrobiol/Suppl. 74:288–314.
- Wylie GD, Jones JR. 1991. Diel and seasonal changes of dissolved oxygen and pH in relation to community metabolism of a shallow reservoir in southeast Missouri. J Freshwater Ecol. 6:431–437 doi:10.1080/02705060.1987.9665168.
- Wylie GD, Jones JR. 1991. Assessment of the sensitivity of Missouri reservoirs to acidification. J Freshwater Ecol. 4(1):115–126.
- Yuan L, Jones JR. 2019. A Bayesian network model for estimating stoichiometric ratios of Lake Seston components. J Inland Waters. 9(1):61–72. doi:10.1080/20442041.2019.1582957.
- Yuan L, Jones JR. 2020a. Modeling hypolimnetic dissolved oxygen depletion using monitoring data. Can J Fish Aquat Sci. 77(5):814–823. doi:10.1139/cjfas-2019-0294.
- Yuan L, Jones JR. Forthcoming 2020b. Rethinking phosphorus-chlorophyll relationships in lakes. Limnol Oceanogr. doi:10.1002/lno.11422.