
 ?Mathematical formulae have been encoded as MathML and are displayed in this HTML version using MathJax in order to improve their display. Uncheck the box to turn MathJax off. This feature requires Javascript. Click on a formula to zoom.
Abstract
Robertson DM, Diebel MW. 2020. Importance of accurately quantifying internal loading in developing phosphorus reduction strategies for a chain of shallow lakes. Lake Reserv Manage. 36:391–411.
The Winnebago Pool is a chain of 4 shallow lakes in Wisconsin. Because of high external phosphorus (P) inputs to the lakes, the lakes became highly eutrophic, with much P contained in their sediments. In developing a total maximum daily load (TMDL) for these lakes, it is important to determine how their phosphorus concentrations should respond to changes in external P loading. In many TMDLs, internal P loading is assumed to be negligible or it is estimated based on sediment release rates and dissolved oxygen conditions in the lake, and each lake is considered independently. To evaluate these assumptions, internal P loading and external P loading were quantified by developing detailed P budgets for the Winnebago Pool chain of lakes. This information was then inputted into 2 eutrophication models (BATHTUB and Jensen models), which were used to simulate the steady-state and transient effects of various P reduction strategies. The importance of internal P loading varied among lakes, from being a minor source to representing almost 60% of the summer P input. Model results indicate that each lake responds to external P reductions, but internal loading can delay the lake responses, especially in the most downstream lake, Lake Winnebago, where internal P loading was most important to its summer P budget. Accurately quantifying net internal P loading and using this information in lake models are important in evaluating how large shallow lakes should respond to P reduction strategies, setting realistic expectations from watershed P reductions, and guiding TMDL efforts.
Water quality in many lakes has declined because of excessive external nutrient loading from their watersheds (for most lakes this refers to phosphorus [P]; Schindler et al. Citation2016), and total maximum daily loads (TMDLs) are being developed. A TMDL is a regulatory term describing a plan for restoring impaired waters that identifies the maximum amount of a pollutant a waterbody can receive while still meeting a specified water quality standard (US Environmental Protection Agency [USEPA] Citation2019). To estimate the P load reductions needed to meet the specified standard, eutrophication models, which estimate inlake total phosphorus concentrations (TP) from external P loading and lake morphometry, are frequently used (USEPA Citation2019). Most of these models originated from basic Vollenweider (Citation1975) type models and are summarized in Cooke et al. (Citation1993).
External P loading drives inlake TP and productivity, and then the P is either exported out of the lake or deposited in its sediments. Not all P deposited in the sediments remains there, as some is released back into the water column, referred to as “internal P loading.” Internal P loading can be generically considered as all physical, chemical, and biological processes by which P is mobilized and translocated from the benthic environment (Steinman and Spears Citation2020). Some P from lake sediments is released by diffusion back into the water column when the water is oxic; however, when deep waters of productive lakes become thermally stratified, their sediment and bottom water often become anoxic and internal P loading from diffusion often increases dramatically (Mortimer Citation1941). Typically, P released from sediments in deep dimictic lakes is retained in the hypolimnion and primarily released to the epilimnion during spring and fall turnover; therefore, hypolimnetic TP increases while near-surface TP remains stable or decreases as summer progresses (Welch and Cooke Citation1995). Typically, internal P loading in deep stratified lakes is estimated based on the accumulation of P in the hypolimnion, or based on release rates from sediment cores collected from the lake and incubated under oxic and anoxic conditions in the laboratory and applied based on ambient dissolved oxygen (DO) conditions in the lake (Nurnberg Citation2009, Ogdahl et al. Citation2014, Matisoff et al. Citation2016).
In shallow polymictic lakes, internal P loading is more complicated than in deep stratified lakes. Similar to deep lakes, microzones of anoxia can develop at or just below the sediment interface and increase the local dissolved P concentrations. But in shallow lakes, frequent mixing events result in minimal anoxia and cause P released from the sediment to circulate throughout the lake, causing near-surface TP to increase during summer (Welch and Cooke Citation1995). In addition to this release, strong winds or biological activity in shallow lakes can resuspend bottom sediment and increase internal P loading (Søndergaard et al. Citation1992, Cyr et al. Citation2009, Huang et al. Citation2016, Huser et al. Citation2016). Søndergaard et al. (Citation1992) estimated that resuspension could enhance the P release rate by 20–30 times compared to undisturbed sediment. Because many factors affect internal P loading in shallow lakes, it is difficult to quantify (Nurnberg Citation2009). One approach to estimating internal loading in shallow lakes is to construct a complete P mass balance (Nurnberg Citation2009; Ogdahl et al. Citation2014); however, it is rare that sufficient input and export data are available to construct a complete P budget. Even when a P budget can be constructed, only net internal P loading (gross internal P loading from all sources minus P redeposited in the lake sediments) can typically be estimated. Lakes with high internal loading may respond more slowly to external P load reductions (Jeppesen et al. Citation2005, Meals et al. Citation2010, Huser et al. Citation2020).
TMDLs are often complicated by the short- and long-term effects of internal P loading. A few eutrophication models can incorporate inputs from internal P loading. Internal P loading can be included in the BATHTUB model as an additional P source (Walker Citation1996). Nurnberg (Citation2005, Citation2009) also developed an empirical model that relates inlake TP to external P loading, internal P loading based on an anoxic sediment release rate, and lake morphometry. Most eutrophication models also do not simulate the transient effects of internal P loading following changes in external P loading; however, Jensen et al. (Citation2006) developed a model that describes inlake TP following external load reductions that is a function of external P loading, P in the sediment, hydraulic residence time, and water temperature. However, in developing most TMDLs, even for shallow lakes, internal P loading is assumed to be negligible and is neglected or estimated based on oxic and anoxic P release rates (computed from sediment cores collected in the lake and incubated in the laboratory), and is applied based on DO conditions measured in the lake.
In developing TMDLs, lakes are typically considered as singular entities in the landscape (Forbes Citation1925) and modeled that way (e.g., Vollenweider Citation1975, Cooke et al. Citation1993). However, many lakes exist in a chain or series, in which actions upstream in the watershed can improve the water quality of all the lakes (Carpenter and Lathrop Citation2014), but the response in downstream lakes can be delayed, especially if internal P loading is important (Jeppesen et al. Citation2005, Jensen et al. Citation2006, Meals et al. Citation2010). Only a few models describe responses to external loading in a chain of lakes. The BATHTUB model (Walker Citation1996) has transport algorithms and can simulate changes in multibasin lakes or a chain of lakes. A few site-specific models have been developed to describe effects of external P reductions transferred down a chain of lakes, such as the Yahara chain of lakes, in Wisconsin (Carpenter and Lathrop Citation2014).
The Winnebago Pool is a chain of 4 large shallow highly eutrophic lakes (most upstream Poygan, Winneconne, Butte des Morts, and most downstream and largest Winnebago) fed by 2 large, agriculturally dominated rivers in Wisconsin ( and ). The Winnebago Pool drains more than 14,000 km2 in central Wisconsin prior to discharging into the Lower Fox River, which drains into Lake Michigan. Because of high TP in all Winnebago Pool lakes, a TMDL was developed (Wisconsin Department of Natural Resources [WDNR] Citation2020) to determine the external load reductions needed to reduce summer average (Jun–Sep) TP in each lake to below the 0.040 mg/L water quality criterion for shallow drainage lakes in Wisconsin (WDNR Citation2019).
Figure 1. Winnebago Pool lakes, Wisconsin, with their complete watersheds (with tributary monitoring sites identified) in the left panel, and with the area around the lakes enhanced to identify the morphometry and inlake sampling sites in the right panel.
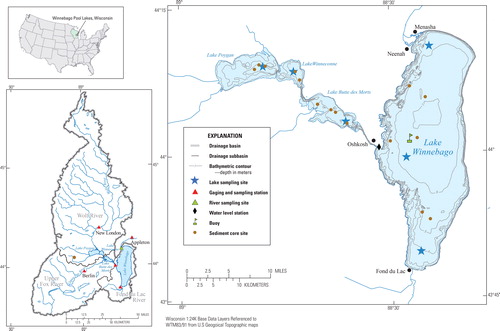
Table 1. Morphometric characteristics of the Winnebago Pool lakes (Robertson et al. Citation2018b).
To provide information needed for developing the TMDL, Robertson et al. (Citation2018b) described in detail the water quality in each Winnebago Pool lake, described complete P budgets for each lake, and determined how TP in each lake should respond to changes in external P loading. The goals of this article are to describe a few aspects of that study, specifically, (1) the importance of internal loading to the P budget of these shallow lakes, (2) how their TP should respond to changes in external P loading, (3) how common approaches used to develop TMDLs that neglect internal P loading or estimate it from sediment core release rates applied based on ambient DO in the lake may affect the anticipated short-term and transient inlake TP response to external P load changes, and (4) how internal loading affects how the TP response propagates down this chain of large shallow lakes.
Methods
Methods used for inlake and tributary monitoring and to estimate external P loading to the Winnebago Pool lakes are described in detail in Robertson et al. (Citation2018b); therefore, they are only briefly summarized here. However, the methods used to estimate internal loading and modeling the response of the lakes are described in more detail in the following.
Lake sampling
The Winnebago Pool lakes were sampled by the WDNR as part of its long-term trend monitoring program, using consistent sampling protocols (Wickman and Herman Citation2005). Lake Winnebago was sampled monthly from May through September during 2009–2014, whereas the upstream lakes were sampled only during 2009–2011. On each sampling date, vertical profiles of water temperature, DO, specific conductance, and pH were measured with a multiparameter meter. Near-surface water samples were collected and analyzed for TP and various other constituents. To better describe DO conditions in Lake Winnebago, including how long the water above the surficial sediment was oxic or anoxic, a buoy was installed near its deepest location from May 10 to October 20, 2012, with temperature and DO sensors (In-Situ RDO optical DO and temperature) placed at the sediment interface and approximately every 1 m to the surface and measured continuously (every 5 min).
Quantifying external phosphorus loading
To quantify P loading in the watershed, 5 sites () were instrumented to continuously monitor flow, and were sampled for TP during 2009–2014: Wolf River at New London (US Geological Survey [USGS] station number 04079000), Fox River at Berlin (04073500), Fond du Lac River at Fond du Lac (only monitored during 2009–2011; 04083545), Fox River at Oshkosh (just upstream of Lake Winnebago; 04082400) and Fox River at Appleton (7 km downstream of Lake Winnebago; 04084445; USGS Citation2018). Because TP had different relations to changing flow among sites, different approaches were used to compute the respective P loads at each site. TP in water entering and leaving Winnebago changed slowly and had little relation to flow but varied seasonally; therefore, linear interpolation was used to estimate daily TPs, which were then multiplied by the daily flows to quantify loads. Loads at the upstream Wolf River and Fox River at Berlin sites were computed using the Weighted Regressions on Time, Discharge, and Season program (WRTDS; Hirsch et al. Citation2010) using all available TP data for each site during 1977–2014. Loads at the small, flashy Fond du Lac River site were computed for 2009–2011 using the Graphical Constituent Loading Analysis System (GCLAS; Koltun et al. Citation2006).
The monitored loads were then used to quantify watershed P loading to each lake using results from a Soil and Water Assessment Tool model (SWAT, Arnold et al. Citation2012) constructed for the entire watershed (The Cadmus Group Citation2018) using 2 approaches, one for lake model calibration/validation and one for model simulations/predictions. For calibration/validation, monitored flows and loads were extrapolated to their complete respective part of the basin by multiplying the measured loads by either a drainage ratio (full basin area divided by the gaged area—Fond du Lac River) or a SWAT ratio (SWAT-simulated nonpoint load to an entire lake divided by the SWAT-simulated load at an upstream gaging station). Point-source contributions were then added to the SWAT-estimated nonpoint loads. Downstream extrapolation of the monitored loads was used to reduce potential temporal and spatial biases in the SWAT-simulated loads and to optimize lake model calibration. For Lake Winnebago, little downstream extrapolation was needed because monitored flow and loads represented about 96% of its nondirect inputs, and about 86% of its total external inputs. More downstream extrapolation was needed for Poygan (monitored flows and loads represented about 58% of the total inputs) and Butte des Mortes (monitored flows and loads represented about 83% of the total inputs, not including that entering from the upstream lakes). For BATHTUB calibration, flows and P loads were estimated for hydraulic years (HY, defined as Oct 1–Sep 30 of the year specified) 2009–2011 for all lakes (the only years with extensive data for all 4 lakes), and for Jensen model calibration, flow and loads were estimated for HY2009–2013 (years with extensive data in Lake Winnebago and downstream from the Upper Pool lakes). However, for all scenarios, full SWAT-estimated P loading for HY2009–2013 was used for both models to enable better comparisons between models and with current conditions (i.e., scenarios used all modeled data).
To estimate P transport from each upstream lake, the flow volume leaving the upstream lake and its TP are needed. These were directly measured for only Lake Winnebago. For upstream loading to Winneconne and Butte des Morts, incoming flow was assumed to equal its total tributary input plus its groundwater (GW) input, and the TP was set to that measured in the upstream lake.
Annual P loading from near-lake septic systems was estimated separately from background GW inflow using export coefficients (based on soil information) and the number of capita using septic systems (Reckhow et al. Citation1980). Natural GW P was computed from estimated flows from a regional GW-flow model for the Lake Michigan Basin (Feinstein et al. Citation2010) and an assumed TP concentration of 0.053 mg/L (obtained from 6 piezometers measured seasonally around Nagawicka Lake, ∼75 km from the Pool lakes; Robertson et al. Citation2007). Point-source P was obtained using annual data from the WDNR (Schmidt J, WDNR, 2014, pers. comm.). Atmospheric P inputs were determined from the volume of direct precipitation (PPT) on surface of each lake, assuming a constant P concentration of 0.036 mg/L (Panuska and Kreider Citation2003).
Quantifying internal phosphorus loading
Oxic and anoxic diffusive P release rates were estimated from sediment cores collected at 6 locations in Lake Winnebago (12 total cores for oxic conditions and 6 total cores for anoxic conditions), 4 locations in Butte des Morts (5 oxic and 5 anoxic), 2 locations in Winneconne (4 oxic and 1 anoxic), and 3 locations in Poygan (4 oxic) using a Wildco core sediment sampler (). In the laboratory, the cores were maintained in either oxic or anoxic environments by gently bubbling either air (oxic) or nitrogen (anoxic) through an air stone placed above the sediment interface. Samples for dissolved P analysis were collected daily for 9 d from above the sediment in each core and filtered through a 0.45 µm filter. The pH above each core was measured prior to and after the analysis: The pH values changed <0.5 units and were similar to those measured in the lake. P release rates were calculated as the linear change in P mass divided by the incubation time (James and Barko Citation2004) and combined to obtain average oxic and anoxic release rates in each lake. To estimate the total sediment P release from diffusion, the respective rates were applied depending on how long the water above the sediments in each lake was oxic or anoxic (Ogdahl et al. Citation2014, Matisoff et al. Citation2016).
Net internal P loading (diffusion plus other internal sources minus sedimentation) into Lake Winnebago was estimated from a daily P mass balance (Equationequation 1(1)
(1) ) constructed for HY2009–2014:
(1)
(1)
where ΔTP is the change in water column TP and V is lake volume, and is equal to the sum of P inputs minus the sum of P leaving the water column. Lake Winnebago’s volume was determined from continuously measured elevations and its morphometry, based on a contour map. Phosphorus enters the water column from surface-water inputs (SWPIn), precipitation (PPTP), groundwater (GWPIn), point sources (Pt), nearby septic systems (Septic), and bottom sediments (SedPIn), and leaves the water column to surface-water outputs (SWPOut), groundwater (GWPOut), and sedimentation or adsorption to the bottom sediments (SedPOut). Daily air temperature and PPT were obtained from the National Weather Service station at Oshkosh, Wisconsin (Midwest Regional Climate Center [MRCC] Citation2015). Total net P release (diffusion plus other sources) was computed by determining the additional internal P loading required to match measured and estimated inlake TP. For Lake Winnebago, each component in Equationequation 1
(1)
(1) was measured or required minor extrapolation, and could be estimated relatively accurately; therefore, it is believed its total net internal P loading (SedPIn – SedPOut) was relatively accurate.
All chemical analyses were done by the certified Wisconsin State Laboratory of Hygiene (WSLH) in accordance with standard analytical procedures (WSLH Citation1993). All stream and lake water quality data are available in the WDNR Surface Water Integrated Monitoring System (SWIMS) database at http://dnr.wi.gov/topic/surfacewater/swims.
Lake models
The steady-state BATHTUB model (Walker Citation1996) was used to describe the expected response in TP in each lake to changes in P loading. BATHTUB includes a hydrologic transport algorithm and is, therefore, capable of simulating changes in complex lakes (multibasin lakes or a chain of lakes like the Winnebago Pool lakes). Several empirical models that estimate TP from external P loading are contained within BATHTUB. Canfield and Bachmann’s (Citation1981) natural-lake model (Equationequation 2(2)
(2) ), which relates hydrology, morphometry, and P loading to near-surface TP (mg/L), was used in this study as follows:
(2)
(2)
where LA is P loading per unit area of the lake (mg/m2/yr), is mean lake depth (m), and τ is the residence time (years). This model has been shown to work well in simulating TP in several lakes across Wisconsin (e.g., Juckem and Robertson Citation2013, Robertson et al. Citation2018a).
Four types of data are required as input into BATHTUB: morphometry, hydrology (water input for each P source), average TP for each P source, and inlake TP to calibrate and verify the model (Supplement Table 1). The BATHTUB model was set up with 5 connected waterbodies: Poygan, Winneconne, Butte des Morts, Fox River, and Lake Winnebago. Because of lake-like conditions between Butte des Morts and Lake Winnebago, the Fox River segment was added. Lake Winnebago was treated as one well-mixed lake. BATHTUB simulates TP during the summer growing season; therefore, its output was validated by comparing the simulated TP with the average TP measured from June through September (similar to the period for the TMDL criterion). Because of the short residence times of the Winnebago Pool lakes (), flow and P loadings for May–September (2009–2011) were used as input to BATHTUB, which resulted in a P-turnover ratio (number of times P is displaced during the averaging period) of approximately 2, which is preferred for model calculations (Walker Citation1996). Seasonal flow rates are then extrapolated to the full year (the time period used in the model) within BATHTUB.
Internal P loading is not typically included as a source in BATHTUB, because most empirical models already indirectly incorporate this source. Internal loading is typically only added when a lake has abnormally high internal loading (Walker Citation1996). It was believed that all Winnebago Pool lakes had abnormally high internal loading because of their accumulation of P-rich sediment; therefore, additional internal P loading was considered for each lake. For all lakes except Lake Winnebago, net internal P loading was estimated using BATHTUB by adjusting the internal P loading rates until the simulated TP matched those measured during 2009–2011. For Lake Winnebago, total net internal loading was estimated from the full mass balance. Estimated net internal P loads were then compared with those from the sediment core analyses (diffusion only).
In applying BATHTUB, average seasonal inputs (from extrapolated measured loads) for May–September 2009–2011 (period with data available for all lakes) were first used to validate the model for Lake Winnebago and calibrate it for the other lakes by adjusting internal loading to match measured TP. Then 12 scenarios were simulated with the calibrated model using full SWAT-estimated watershed loads. Scenario B1 simulated base conditions with average annual watershed inputs for 2009–2013 using full SWAT-predicted loadings. Scenarios B2–B10 simulated the effects of changes in P loading from all controllable sources (all inputs except from PPT and GW) by −75, −50, −25, −10, +10, +25, +50, +75, and +100%. When BATHTUB is used to simulate the effects of changes in external loading, it is usually assumed that either internal P loading is unaffected, or it will eventually come to equilibrium with the new external P loading with a change directly proportional to the percentage change in all noninternal sources (Robertson et al. Citation2018b). In all simulations, net internal loading was changed by a percentage similar to the change in all external controllable P sources. Two scenarios were then used to show the importance of internal loading: Scenario B11 simulated the effects of removing all internal P loading, but keeping all external inputs unchanged; and Scenario B12 simulated the effects of reducing all P sources, except PPT and GW, by 75% but keeping internal P loading unchanged (representing conditions expected immediately after an external P reduction of 75%).
BATHTUB simulates changes in seasonal average TP at a new equilibrium condition; however, it does not describe within-year variability or transient changes in inlake TP following changes in P inputs. The Jensen model (Jensen et al. Citation2006) was used to estimate total internal P loading, sediment deposition of P, and net internal P loading in Lake Winnebago and to simulate the expected transient and equilibrium TP in the lakes. The Jensen model is an empirical model (Equationequation 3(3)
(3) ) that relates daily changes in lake TP (ΔTP, in g/m2/d or mg/L/d) to external P loading per unit lake area (LA, in g/m2), water column TP,
and water temperature (T, C) by combining changes in the recyclable P in the sediments (ΔPSed, in g/m2/d; Equationequation 4
(4)
(4) ), P release from the sediments (REL, in g/m2/d; Equationequation 5
(5)
(5) ), and P sedimentation (SED, in g/m2/d; Equationequation 6
(6)
(6) ):
(3)
(3)
(4)
(4)
(5)
(5)
(6)
(6)
where Q is inflow to the lake (in m3/d), V is lake volume (in m3), fd is a hydraulic retention time factor equal to 1/(1 +
), bR is a base sediment release constant (in 1/d) affected by T using a temperature dependence factor (tR) and PSed, and bS is a base sedimentation constant (in m/d) affected by T using a temperature dependence factor (tS) and TP in the lake. REL represents release from all internal P sources, including diffusion, resuspension, bioturbation, and so on, all of which are related to PSed. Six types of data are required for the Jensen models: morphometric data (V and
), initial recyclable (available) P accumulated in the lake sediments (PSed), daily lake temperatures, daily flows and P loading into the lake, and lake TP to calibrate the models. Daily water temperatures were estimated from the average air temperature over the previous 5 d, with temperatures less than 1 C set to 1 C. This resulted in a root mean square error (RMSE) between measured and predicted water temperatures of 2.6 C, based on data measured in Lake Winnebago from 1990 to 2013.
The Jensen model was coded into Excel and calibrated for October 1, 2008, through December 31, 2013, by finding “optimal” values for bR, tR, bS, tS, and PSed using measured daily flow, P loading (LA), and water temperatures as inputs. Optimal values were found using the Solver routine in Microsoft Excel, which was set to minimize the sum of square errors (SSE) between measured and predicted TP in the lake using a Generalized Reduced Gradient Nonlinear method (FrontlineSolvers Citation2017). To calibrate the model for Lake Winnebago, flows and P loads measured at the Fox River and Fond du Lac River sites extrapolated to full nearshore loads were used. To determine whether the resulting PSed value was reasonable, it was compared with an estimate based on sediment data collected at 30 locations in Lake Winnebago by Gustin (Citation1995). Gustin estimated the average active P recycling depth was 0.3 m; therefore, the volume of active sediment was 0.3 m3/m2. If the bulk density of wet lake sediment is assumed to be 100,000–200,000 g sediment/m3, then the mass of active sediment is 30,000–60,000 g sediment/m2. Gustin also estimated the average recyclable P content at the sediment surface was 0.00054 g P/g sediment. If it is assumed that there was no recyclable P at 0.3 m and there was a linear decline in recyclable P from 0 to 0.3 m, then average recyclable P was 0.00027 g P/g sediment, and total recyclable P in the sediment (PSed) would be 8 to 16 g/m2.
Jensen models could not be developed for each Upper Pool lake because inlake data were only available for May–September and data throughout the year are needed for calibration. Instead, 2 independent Jensen models were constructed: one for all 3 combined Upper Pool lakes using monthly TP data collected at their outlet (Fox River at Oshkosh) as its in-lake TP and one for Lake Winnebago using monthly or more frequent TP data collected in either Lake Winnebago or its outlet as its inlake TP. Output from the Upper Pool lakes model was then used as input to the Lake Winnebago model to create one fully linked Jensen model that used either total external loading estimated from measured flows and P loads and SWAT ratios (for calibration and evaluation) or complete SWAT-estimated flows and P loads (for scenario simulations). Calibrations were based on data from HY2009–2013 and only for the independent models; results are then shown for the fully linked Combined Upper Pool–Lake Winnebago model. For all simulations, the linked model was first used to simulate daily TPs during HY2009–2013 using full watershed loading from SWAT (The Cadmus Group Citation2018). Then, P inputs for those 5 yr were modified based on the changes in loading being simulated for HY2014–2018 (such as a 25% increase in P loading simulated as a 25% increase in inflow TP concentrations). These changes were applied to all P sources, except PPT and GW. Then, the HY2014–2018 inputs were repeated over and over in 5 yr replicates until 2045. Twelve P loading scenarios (with full SWAT-predicted loadings) were simulated with the linked model. Scenario J1 simulated with P loading during HY2009–2013 (base conditions). Scenarios J2–J10 simulated external P input changes of −75, −50, −25, −10, +10, +25, +50, +75, and +100%. Two scenarios then simulated the effects of Lake Winnebago being the most downstream lake in the chain by computing changes in its response to a 75% reduction in external P loading (J2), but with 2 changes: Scenario J11 simulated the beneficial effects to Lake Winnebago from P reductions applied only to the upstream lakes, with no changes immediately around it, and Scenario J12 simulated the detrimental effects of it being located downstream of other lakes (a delayed response to upstream P reductions). Scenario J12 showed the transient decreases in TP in Lake Winnebago occurring when the TP concentrations leaving the Upper Pool lakes were immediately set to the concentrations simulated 125 yr following a 75% reduction in export from their watersheds (using output from Scenario J2 for the Upper Pool lakes). Geometric mean TP concentrations were then computed for June 1–September 15 (the period for which the criterion was evaluated for the TMDL).
Results
Lake water quality
All 4 lakes were polymictic; surface and bottom temperatures were similar and only weak stratification was observed in the routine monitoring data. Because Lake Winnebago is deeper than the other lakes, it had stronger but still weak stratification. Surface DO was near or above saturation throughout most of the open-water period. DO in the deep areas of all lakes occasionally declined, but rarely dropped below 5 mg/L. In 2012, the continuous recording sensors showed minimal thermal stratification and that the near-bottom DO did drop below 5 mg/L during July through October, but DO rarely dropped below 2 mg/L. Hypoxic occurrences were short-lived because of frequent deep mixing. Because DO rarely dropped below 2 mg/L at the deepest sensor, which was very close to the bottom, anoxia was believed to be a very rare occurrence in Lake Winnebago or all of the other shallower Pool lakes.
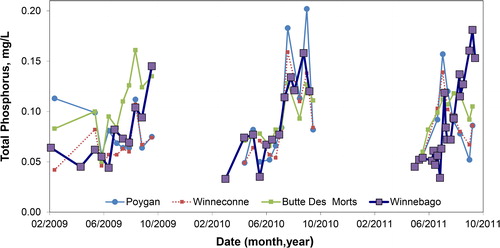
Near-surface TP in all 4 lakes was relatively similar and had distinct seasonality (): steady in May but increased dramatically from June through late September. During 2009–2011, average near-surface June–September TP, used in BATHTUB, was 0.097 mg/L in Lake Winnebago, 0.104 mg/L in Butte des Morts, 0.088 mg/L in Winneconne, and 0.094 mg/L in Poygan.
Figure 2. Near-surface total phosphorus concentration (TP) in the Winnebago Pool lakes, Wisconsin, in 2009–2011.
Sediment phosphorus release in relation to the phosphorus budget
Detailed water and P budgets (Equationequation 1(1)
(1) ) for Lake Winnebago were estimated for HY2009–2014, but only for HY2009–11 for the other lakes because data for some of their sources were not available for the entire period (Robertson et al. Citation2018b and summarized in Supplement Table 2). The only detailed information provided here is for internal P loading. Based on laboratory-incubated sediment cores, the average oxic release rate from diffusion for Lake Winnebago was 0.43 mg/m2/d and for all 4 lakes was 0.55 mg/m2/d. The average anoxic release rate for Lake Winnebago was 1.78 mg/m2/d and for all 4 lakes was 1.49 mg/m2/d, rates that were 3–4 times greater than the oxic release rates. Because anoxia was rarely observed at the sediment interface, the oxic release rates were applied to all sediment of >1 m depth (97% of the lake area) from May through September, which resulted in 33,900 kg of P released from diffusion from Lake Winnebago sediments. The P released from diffusion outside this period is expected to be low because rates decrease when water temperatures are cool (James and Barko Citation2004, James Citation2017); applying diffusion to the entire lake bottom, including areas <1 m, had little effect on the total estimated load.
Table 2. Parameters and coefficients used in the calibrated Jensen models for Lake Winnebago and the 3 Upper Pool lakes.
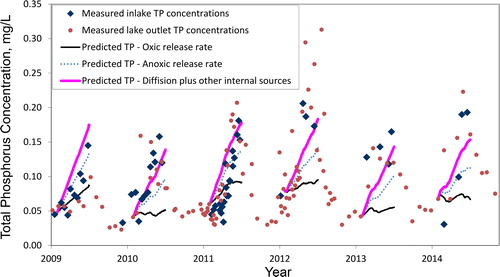
To determine if additional P sources might be missing from the budget (primarily from other internal sources), predicted TP in Lake Winnebago (computed with Equationequation 1(1)
(1) by dividing daily P mass changes by the corresponding daily lake volumes) were compared with measured TP during HY2009–2014 (). Because only limited sampling was conducted in 2012–2014, TP values for the outlet were also compared to the estimated concentrations. EquationEquation 1
(1)
(1) was applied starting on the closest date to April 15 of each year with measured inlake TP. Because all of the other terms in Equationequation 1
(1)
(1) could be relatively accurately estimated, especially major external P contributors (more than 85% of the total external inputs were directly measured at gaging stations), it is believed that discrepancies in measured and predicted TP were because the estimated P release from diffusion from the sediments was inadequate at describing total net internal P loading and most likely associated with additional internal P loading from other sources. If anoxic P release rates were considered, TP was still underestimated (). Internal loading was increased until TPs better matched those measured during 2009–2014; net internal P loading had to be increased from 0.43 mg/m2/d (diffusion alone) to 3.00 mg/m2/d (an increase of 2.57 mg/m2/d). Greater internal loading relative to that estimated from oxic P release from the sediment may have been caused by bottom sediment resuspension from wind and fish feeding and excretion. Therefore, net internal loading during May through September was 238,000 kg/yr, and could not be accounted for by oxic P release from the sediment (33,900 kg). It would even be underestimated if anoxic rates were used for the entire period (1.78 mg/m2/d or 141,000 kg/yr). Part of this additional P may be a result of errors in the other components of the P budgets; however, given that most of the P load was from monitored tributary loading (Fox and Fond du Lac Rivers, both near where they enter the lake) and input from PPT, this total net internal P load estimate likely is reliable.
Figure 3. Measured and predicted near-surface total phosphorus concentrations (TP) in Lake Winnebago during 2009–2014 based on Equationequation 1(1)
(1) , with internal loading estimated based on laboratory diffusion rates alone and increased to represent other internal sources including sediment resuspension and biological effects.
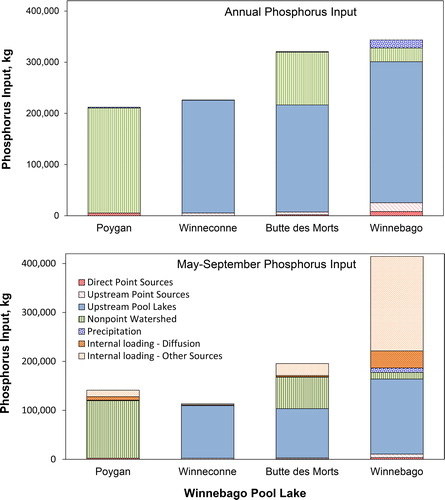
Inputs from all P sources for Lake Winnebago and external P sources for the other Upper Pool lakes are provided in and in Supplement Table 2 (internal loading in the other lakes is described in “BATHTUB model”). Inputs of P from atmospheric deposition, point sources, GW, and septic systems were relatively unimportant for all Winnebago Pool lakes. During HY2009–2011, average May–September P input to Lake Winnebago was 425,000 kg: 187,000 kg from external P sources (44%) and 228,000 kg from net internal P loading (56%). Net internal P loading was important only for May–September. During the rest of the year (described in detail in “Jensen model”) there was a net P deposition that was close to that released during May–September; therefore, internal loading was omitted from the annual inputs.
Figure 4. Average annual and average May–Sep phosphorus (P) inputs into the Winnebago Pool lakes, by source, for hydraulic years 2009–2011. Groundwater and septic inputs were small and not visible. (Net internal sources of P appeared to be negative on annual basis; therefore, they were not included in the annual budget.)
BATHTUB model
The BATHTUB-simulated summer average TP in each lake based on average May–September flow and TP concentrations for each source for 2009–2011 and net internal P loading based on the laboratory oxic diffusion rates (Supplement Table 1) were much lower than those measured in the lakes, as expected based on the P mass balance. Therefore, internal P loading rates for each lake were increased until simulated TPs matched those measured in 2009–2011. Net internal P loading rates were increased from 0.80 to 2.30 mg/m2/d in Poygan, 0.48 to 1.20 mg/m2/d in Winneconne, 0.50 to 5.00 mg/m2/d in Butte des Morts, and 0.43 to 2.80 mg/m2/d in Lake Winnebago. For Lake Winnebago, final estimated internal P loading was slightly less than that from the mass balance approach (3.0 mg/m2/d). With the refined internal P loading estimates, total summer P budgets could be completed for the Upper Pool lakes ( and Supplement Table 2). During May–September, net internal P loading varied from 3.1% of the P input to Winneconne, to 14.4% for Poygan and Butte des Morts, to about 55% to 56% for Lake Winnebago (based on BATHTUB and mass balance, respectively). Although internal P loading rates were relatively high in the Upper Pool lakes, their relative importance to their total P budgets was less than for Lake Winnebago because of the magnitude of the other sources, primarily high inputs from tributary loading and the adjacent upstream lakes.
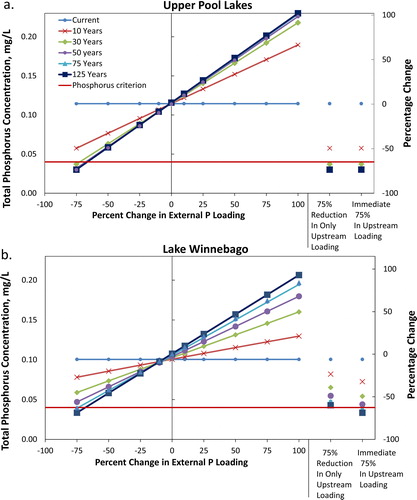
Based on results from scenarios B1–B10, using final estimated internal P loading, TP in each lake was predicted to have a relatively linear response to changes in P loading (, Supplement Table 3), but the percent changes in lake TP were smaller than the changes in external P loading. For Lake Winnebago, a 75% decrease in all potentially controllable P loading (72% in total loading) resulted in a 61% decrease in TP and a 75% increase (68% increase in total loading) resulted in a 45% increase in TP; similar changes were found for the other lakes. These response curves suggest that a 75% reduction in controllable P sources to Lake Winnebago is needed for it to reach its 0.040 mg/L P criterion, compared to a 60% reduction for the Upper Pool lakes.
Figure 5. BATHTUB results. Simulated average Jun–Sep near-surface total phosphorus concentrations (TP) in each of the Winnebago Pool lakes in response to changes in P loading (scenarios are described in Supplement Table 3).
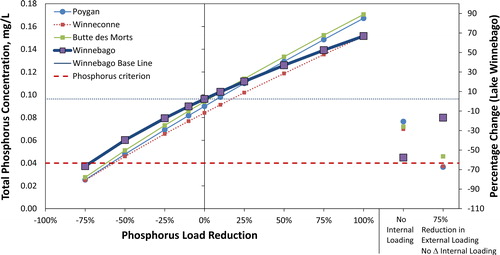
Scenario B11 was simulated to show what should occur with internal P loading eliminated but no changes in external loading. Model results indicate TP should decrease (), especially in Lake Winnebago, where internal P loading was its largest P source during summer (): TP decreased to 0.045 mg/L in Lake Winnebago (56% reduction) and to 0.070–0.077 mg/L in the Upper Pool lakes (25% reduction). Scenario B12, with final internal P loading estimated during calibration, was simulated to determine what should occur if all external P sources were reduced by 75% but internal P loading was left unchanged (i.e., internal loading did not have time to equilibrate with the external P reduction). Model results indicate that TP should decrease throughout the Winnebago Pool lakes, especially in the Upper Pool lakes where internal P loading was a relatively small source. Simulated TP decreased to 0.038 mg/L in Poygan and Winneconne (57–60% decrease), to 0.047 mg/L in Butte des Morts (55% decrease), and to 0.080 mg/L in Lake Winnebago (22% decrease). Therefore, large reductions in external P sources should almost immediately decrease TP, especially in lakes where internal P loading is a relatively small source, but in lakes where internal P loading is an important source, the full effects of the reductions will be delayed.
Jensen model
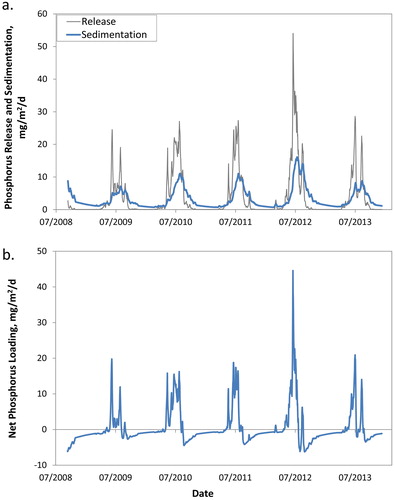
The dynamic Jensen model was then used to describe within-year changes and transient changes in inlake TP following P input changes. During calibration (results in ) for Lake Winnebago, the initial PSed was estimated to be 15.0 g/m2, and it varied <0.56 g/m2 throughout the 5 yr calibration period; the RMSE was 0.043 mg/L, based on 160 in-lake measurements. The PSed was in the range (8 to 16 g/m2) of that expected based on sediment cores collected in the lake by Gustin (Citation1995). The calibrated Lake Winnebago Jensen model separated the daily P released from the sediments and P sedimentation from the water column (); the Jensen model was the only approach capable of separating these components. During May–September 2009–2013, the average gross internal P loading rate was 9.0 mg/m2/d and the gross sedimentation rate was 5.5 mg/m2/d. The difference between these is net internal P loading to the water column (), which incorporates not only diffusion but also inputs from wind resuspension, settling, and other biological effects. The average net internal P load from May–September based on the Jensen model was 3.5 mg/m2/d, which was a little higher than the net internal P loads of 3.0 mg/m2/d and 2.8 mg/m2/d from mass balance and BATHTUB, respectively. All 3 approaches provided results higher than those from using laboratory-measured sediment core diffusion rates under oxic conditions. The Jensen model estimated that the net deposition of P into the sediments during October–April was close to that released during May–September.
Figure 6. Daily phosphorus release, sedimentation, and net internal phosphorus loading for Lake Winnebago, hydraulic years 2009–2013, based on Lake Winnebago Jensen model results.
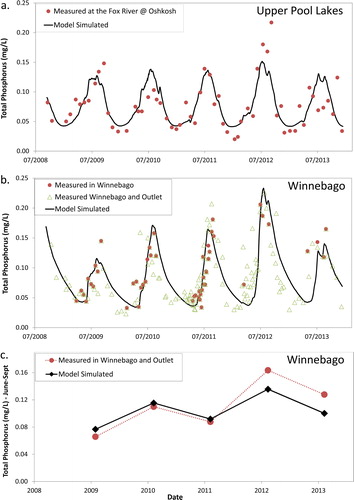
During initial calibration of the combined Upper Pool Jensen model, a sedimentation rate equal to 0 was found, which is unrealistic; therefore, this rate was set to that found for Lake Winnebago (0.0523 m/d) and optimal values for the other coefficients were determined (). The initial PSed was again estimated to be 15.0 g/m2, and varied <0.2 g/m2 throughout the 5 yr calibration period. Measured versus simulated TPs for the Upper Pool Jensen model () had an RMSE of 0.027 mg/L based on 60 measurements. Output from the calibrated Upper Pool lakes model was then used as input to the calibrated Lake Winnebago model to create one linked Jensen model using only external P loading as input. Measured versus simulated TP for Lake Winnebago for the linked model () had an RMSE value of 0.043 mg/L (similar to the independently calibrated Winnebago Jensen model). Measured versus simulated annual geometric mean TP for June 1–September 15 (the period for TMDL criterion evaluation) for only days with coinciding data () had a RMSE of 0.018 mg/L based on 5 yr of data. Model results provided reasonable fit to the 5 yr of measured data, suggesting the models should provide accurate P response curves.
Figure 7. Measured and simulated (with the linked Jensen model) near-surface total phosphorus concentrations (TP) in the Upper Pool lakes and Lake Winnebago, hydraulic years 2009–2013: (a) Upper Pool lakes; (b) Lake Winnebago; (c) Jun 1–Sep 15 geometric mean TP concentration in Lake Winnebago.
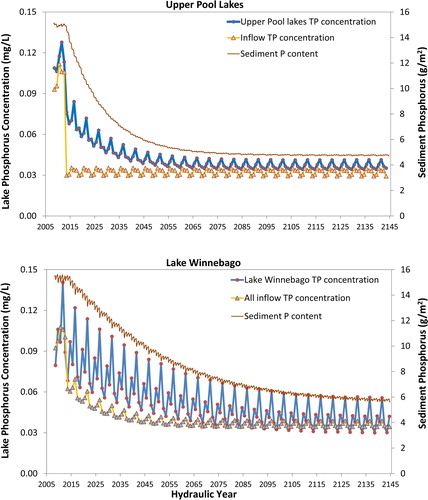
Because the Jensen model simulates transient changes in TP following external P changes, the expected future TP depends on how long after the P load change that is evaluated. The curvilinear response in summer average TP for the Upper Pool lakes and Lake Winnebago following a 75% reduction in external P loading is shown in . After about 60 yr, the declining Psed and inlake TP in the Upper Pool lakes approach a new equilibrium of about 4.5 g P/m2 and 0.030 mg/L, respectively. In contrast, Psed and TP in Lake Winnebago decreased more slowly and took more than 100 yr to approach a new equilibrium of about 6 g P/m2 and 0.035 mg/L, respectively. The delayed TP response in Lake Winnebago to reduced external P loading was due to the internal loading from the Upper lakes. Therefore, TP in Lake Winnebago responded more slowly to changes in external P loadings than in the Upper Pool lakes.
Figure 8. Simulated annual geometric mean Jun–Sep total phosphorus concentrations (TP) for the Upper Pool lakes and Lake Winnebago, during hydraulic years 2009–2145 after a 75-percent reduction in external P loading using the linked Jensen model. Also shown are average May–Sep TP concentrations of the inflow to Lake Winnebago and the daily changes in sediment phosphorus (P) content.
To describe the transitional changes in TP (response curves) for Scenarios J1–J10, geometric mean TP for June 1–September 15 for the 5 yr just prior to 10, 30, 50, 75, and 125 yr after the specific load changes were examined ( and Supplement Table 4). TP in the Upper Pool lakes and Lake Winnebago is predicted to have a linear response to P load changes, with the magnitude of the response depending on the number of years following the P load changes. Simulated changes in TP in the Upper Pool lakes approached a change similar to that of the external P loading on a percentage basis: At 10 yr after a P load reduction of 75% in external P loading (equating to 74% in total loading), there was a 50% drop in TP, but after about 50 yr, the 75% change caused a 72% drop in TP. Simulated changes in TP in Lake Winnebago also approached a change similar to that of external P loading, but it was more gradual: After 50 yr, a 75% decrease in external loading (70% in total loading) caused a 53% drop in TP; after 125 yr it caused a 66% drop.
Figure 9. Simulated changes in the geometric mean total phosphorus concentrations (TP) in (a) the Upper Pool lakes and (b) Lake Winnebago in response to various phosphorus (P)-loading scenarios using the linked Jensen model (scenarios are described in Supplement Table 4). Geometric mean TP concentrations were computed for Jun 1–Sep 15 for the 5 yr prior to each specified time after the P load changes.
Because of the transient changes in internal P loading, it is important to consider not only the final concentration when trying to reach a specific TP criterion (BATHTUB results), but also how long it may take to occur (Jensen results). For Lake Winnebago, 0.040 mg/L could only be reached after about a 70% reduction in external P loading from controllable sources and waiting about 100 yr, whereas with a 75% reduction, it could be reached in about 75 yr. For the Upper Pool lakes, with a 65% reduction in external loading, the 0.040 mg/L could be reached in about 100 yr, whereas with a 75% reduction, it could be reached in less than 30 yr.
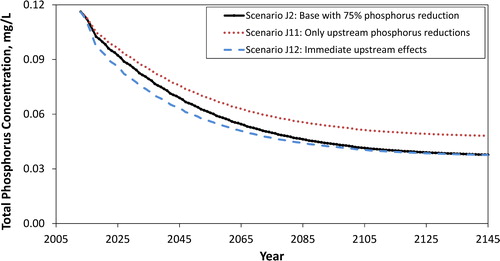
Results from Scenario J11 show the beneficial effects of Lake Winnebago being the downstream member in a chain of lakes by showing what would happen if a 75% reduction only occurred in watersheds of the upstream lakes, with no changes occurring directly around Lake Winnebago. Results of this simulation, compared to Scenario J2 in , show that there is still a large decrease in the 5 yr moving average TP in Lake Winnebago, from 0.116 to 0.048 mg/L. Thus, there is a beneficial, although delayed, effect of it being located downstream in a chain of lakes. Results of Scenario J12 show the negative effects of Lake Winnebago being in a chain of lakes, by showing what would happen if the full effects of a 75% reduction in upstream P inputs could be immediately input into Lake Winnebago. TP in Lake Winnebago declined more quickly, but ultimately reached the same TP after about 125 yr as Scenario J2. Following a 75% reduction, it should take about 25 yr for 50% of the effects to be observed in Lake Winnebago; however, if the reduction in external loading occurred immediately, it would only take about 20 yr for 50% of the effects to be observed. The delayed response in Lake Winnebago occurred because of its internal loading and also because much of P loading to Lake Winnebago comes from the Upper Pool lakes where TP takes several years to reach equilibrium because of their internal loading.
Figure 10. Simulated changes in the average Jun–Sep total phosphorus concentrations (TP) in Lake Winnebago, in response to various phosphorus (P)-loading scenarios using the linked Jensen model, demonstrating the beneficial (Scenario J11—only upstream load reductions) and detrimental (J12—if upstream load reductions could occur immediately) effects of it being in a chain of lakes. All concentrations are a simple moving average of the previous 5 yr, which differ slightly from the geometric mean concentrations in Supplement Table 4.
Discussion
Not all of the P deposited in lake sediments remains there; some is released back into the water column. Diffusion of P from the sediment, especially with anoxic conditions, has been well documented and can be an important component of the P budget of some lakes (Steinman and Spears Citation2020). In addition, other processes can lead to internal P loading in shallow lakes, such as sediment resuspension caused by strong winds (Søndergaard et al. Citation1992, Cyr et al. Citation2009, Huang et al. Citation2016), feeding behavior of aquatic animals (stirring up the sediments), excretion by fish (Lamarra Citation1975, Fischer et al. Citation2013, Huser et al. Citation2016), and decaying macrophytes (Wang et al. Citation2018). In this study, we have shown that internal P loading is an important component of the P budgets of the Winnebago Pool lakes, and the amount of P released from diffusion, estimated from diffusion rates from sediment cores incubated in the laboratory and applied based on measured DO conditions (only oxic rates were applied because continuous measurements at the sediment interface in Lake Winnebago were shown to be oxic), grossly underestimated their total net internal P loading. For Lake Winnebago, because of inputs of P from other internal sources, its net internal P loading for the entire summer (2.8–3.5 mg/m2/d, based on 3 different approaches) was 7–8 times more than that based on only using laboratory diffusion rates from oxic sediments and about 2 times more than the diffusion rate if anoxic sediment release rates were used for the entire summer. Therefore, water quality models that do not include these other internal P sources that are important in shallow lakes may underestimate the effects of internal P loading and overestimate the response of the lakes to P load reductions.
Even with high net internal P loading during summer, internal loading was an important P source for only a few Winnebago Pool lakes because of the magnitude of the other sources. Based on BATHTUB results, net internal P loading during May–September represented from 3% for Winneconne, to about 14% for Poygan and Butte des Morts, to 55% of the total P loading for Lake Winnebago ( and Supplement Table 1) of the total P loading. Although most external P inputs to Lake Winnebago could be accurately estimated, more assumptions were needed to estimate total external P inputs in the other lakes; therefore, their estimated net internal P loadings are considered less reliable. However, this did not affect the estimates for Lake Winnebago because it had stations monitoring most of its external P loading immediately upstream from the lake.
The steady-state (BATHTUB) and dynamic (Jensen) models produced similar conclusions on the role of internal P loading and the external P loading reductions needed for the lakes to meet their water quality criteria. Results from both models indicated that external P loading from controllable sources would need to be decreased by about 70–75% to Lake Winnebago and 60–65% to the Upper Pool lakes for them to reach their 0.040 mg/L designated TP criterion. The Jensen model, however, provided insight into how other factors affect internal loading. Differences in the temperature dependence of sediment P release between the Upper Pool lakes and Lake Winnebago (see the coefficients for tR in ) suggest that different processes may be driving internal loading. For example, the shallower depth and lower temperature dependence of sediment P release (tR = 0.1175) in the Upper Pool lakes point to wind-driven sediment resuspension, whereas the stronger temperature dependence of P release (tR = 0.3209) in Lake Winnebago may point to biological or chemical processes, possibly driven by redox conditions at the sediment–water interface. Sediment P release in the Jensen model is a function of only temperature and sediment P concentration, so if other factors, such as redox conditions or aquatic plant cover, change in a nonlinear manner, the model will not reflect those processes. Nevertheless, it is clear that the large mass of P in the sediments of the Winnebago Pool lakes plays a major role in their water quality and will continue to do so for some time in the future even if external loading is substantially reduced.
Shallow lakes with high internal P loading pose a challenge for water quality managers because they may respond more slowly to reductions in external P loading than lakes with relatively low internal P loading (Jeppesen et al. Citation2005, Jensen et al. Citation2006, Meals et al. Citation2010, Steinman and Spears Citation2020). This problem is further complicated if the lakes are part of a chain of lakes because although they benefit from actions taken anywhere in the upstream watershed, they can also experience a delayed response to these actions because of internal P loading in all the lakes. The Jensen model provided insight into how long it may take a lake to reach a specified criterion ( and ). Although changes in external P loading were simulated to occur immediately, it took several decades for the sediment P content () and its associated P release to reach equilibrium. After about 10–15 yr following an external P load reduction of 75%, summer average TP in the Upper Pool lakes was simulated to decrease by 50%, but for Lake Winnebago, TP only decreased by 22%. It took about 50 to 60 yr for TP to reach equilibrium in the Upper Pool lakes, but it took about 120 yr for TP in Lake Winnebago to reach its new equilibrium.
Typically, models used to simulate changes in lake water quality are validated by applying the calibrated model to additional years of data not used in calibration. This approach, however, may provide false confidence in the model results because a model supplied with relatively similar inputs often produces similar outputs. Alternative approaches were used in this study to validate the models that included constructing full mass P balances, showing the calibrated model was capable of simulating interannual variability in TP for years with a range in external loading (linked Jensen model, ), and showing the model could accurately simulate TP in several lakes with a range in external P loading (BATHTUB; e.g., Juckem and Robertson Citation2013, Robertson et al. Citation2018a), including Lake Winnebago when detailed P loading was used as input. In this study, a multiple-model approach (i.e., ensemble modeling; Scavia et al. Citation2017), using similar model inputs, provides multiple lines of evidence and increases the certainty in the predictions made from the individual models. The 2 modeling approaches used here provided similar conclusions on the external loading reductions needed to reach their specified criterion.
Conclusions
We have shown that (1) internal loading can be a very important component of the P budget of shallow lakes, (2) the typical approach used to quantify net internal loading (using P release rates computed from sediment cores collected in a lake and incubated in the laboratory and applied based on ambient DO conditions) may greatly underestimate net internal P loading in shallow lakes, (3) only by incorporating accurate net internal load estimates can we expect to obtain accurate load response curves for shallow lakes, (4) internal loading can delay the time frame for lakes to experience the full effects of any external P load reduction, and (5) individual lakes in a chain of lakes warrant consideration together rather than as singular entities. It is important to accurately quantify net internal P loading and for water quality managers to consider the effects of upstream lakes when developing P reduction strategies and establishing TMDLs for shallow lakes.
Supplemental Material
Download MS Excel (23.3 KB)Supplemental Material
Download MS Excel (22.9 KB)Supplemental Material
Download MS Excel (21.3 KB)Supplemental Material
Download MS Excel (22.3 KB)Acknowledgments
We acknowledge the US Environmental Protection Agency’s Great Lakes Restoration Initiative Program for funding this project, and Ben Siebers and Paul Reneau, US Geological Survey (USGS), for installing and operating the buoy on Lake Winnebago and collecting sediment cores. We also thank Hedeff Essaid from the USGS, Bill James from the University of Wisconsin–Stout, Alan Steinman from Grand Valley State University, and 2 anonymous reviewers for providing valuable comments on the article. Any use of trade, firm, or product names is for descriptive purposes only and does not imply endorsement by the US government. All input data used in the models and results from the models are available at https://doi.org/10.5066/P9Y8BE4H (Robertson and Kennedy Citation2018).
References
- Arnold JG, Moriasi DN, Gassman PW, Abbaspour KC, White MJ, Srinivasan R, Santhi C, Harmel RD, Van Griensven A, Van Liew MW. 2012. SWAT: model use, calibration, and validation. Trans Amer Soc Agric Biol Eng 15:1491–1508. doi:10.13031/2013.42256.
- Canfield DE, Jr., Bachmann RW. 1981. Prediction of total phosphorus concentrations, chlorophyll a, and Secchi depths in natural and artificial lakes. Can J Fish Aquat Sci. 38(4):414–423. doi:10.1139/f81-058.
- Carpenter SR, Lathrop RC. 2014. Phosphorus loading, transport and concentrations in a lake chain: a probabilistic model to compare management options. Aquat Sci. 76(1):145–154. doi:10.1007/s00027-013-0324-5.
- Cooke GD, Welch EB, Peterson SA, Newroth PR. 1993. Restoration and management of lakes and reservoirs. 2nd ed. Boca Raton, FL: Lewis Publishers; 548p.
- Cyr H, McCabe SK, Nurnberg GK. 2009. Phosphorus sorption experiments and the potential for internal phosphorus loading in littoral areas of a stratified lake. Water Res. 43(6):1654–1666. doi:10.1016/j.watres.2008.12.050.
- Feinstein DT, Hunt RJ, Reeves HW. 2010. Regional groundwater-flow model of the Michigan Basin in support of Great Lakes Basin water availability and use studies. USGS Scientific Invest Rep 2010–5109. USGS; 379p.
- Fischer JR, Krogman RM, Quist MC. 2013. Influences of native and non-native benthivorous fishes on aquatic ecosystem degradation. Hydrobiologia. 711(1):187–199. doi:10.1007/s10750-013-1483-z.
- Forbes SA. 1925. The lake as a microcosm. INHS Bull. 15(1–9):537–550. doi:10.21900/j.inhs.v15.303.
- FrontlineSolvers. 2017. Solver technology: smooth nonlinear optimization. https://www.solver.com/smooth-nonlinear-technology.
- Fry J, Xian G, JS, Dewitz J, Homer C, Yang L, Barnes C, Herold N, Wickham J. 2011. Completion of the 2006 National Land Cover Database for the conterminous United States. Photogram Eng Remote Sens. 77:858–864.
- Gustin MP. 1995. Sources, transport and fate of sediments and nutrients in the Winnebago pool system. PhD Thesis. Department of Biogeochemistry, University Wisconsin-Milwaukee.
- Hirsch RM, Moyer DL, Archfield SA. 2010. Weighted Regressions on Time, Discharge, and Season (WRTDS), with an application to Chesapeake Bay River inputs. J Am Water Res Assoc. 46(5):857–880. doi:10.1111/j.1752-1688.2010.00482.x.
- Huang L, Fang H, He G, Jiang H, Wang C. 2016. Effects of internal loading on phosphorus distribution in the Taihu Lake driven by wind waves and lake currents. Environ Pollut. 219:760–773. doi:10.1016/j.envpol.2016.07.049.
- Huser BJ, Bajer PG, Chizinski CJ, Sorensen PW. 2016. Effects of common carp (Cyprinus carpio) on sediment mixing depth and mobile phosphorus mass in the active sediment layer of a shallow lake. Hydrobiologia. 763(1):23–33. doi:10.1007/s10750-015-2356-4.
- Huser BJ, Malmaeus M, Witter E, Wilander A, Rydin E. 2020. Accumulation of legacy sediment phosphorus in Lake Hjalmaren, Sweden: consequences for lake restoration In: Steinman A, Spears B, editors. Internal phosphorus loading in lakes: Causes, case studies, and management. Fort Lauderdale, FL: J. Ross Publishing; p. 301–322.
- James WF. 2017. Diffusive phosphorus fluxes in relation to the sediment phosphorus profile in Big Traverse Bay, Lake of the Woods. Lake Reserv Manage. 33(4):360–368. doi:10.1080/10402381.2017.1346010.
- James WF, Barko JW. 2004. Diffusive fluxes and equilibrium processes in relation to phosphorus dynamics in the Upper Mississippi River. River Res Appl. 20:73–484.
- Jensen JP, Pedersen AR, Jeppesen E, Søndergaard M. 2006. An empirical model describing the seasonal dynamics of phosphorus in 16 shallow eutrophic lakes after external loading reduction. Limnol Oceanogr. 51(1 Part 2):791–800. doi:10.4319/lo.2006.51.1_part_2.0791.
- Jeppesen E, Sondergaard M, Jensen JP, Havens KE, Anneville O, Carvalho L, Coveney MF, Deneke R, Dokulil MT, Foy B, et al. 2005. Lake responses to reduced nutrient loading–an analysis of contemporary long-term data from 35 case studies. Freshwater Biol. 50(10):1747–1771. doi:10.1111/j.1365-2427.2005.01415.x.
- Juckem PJ, Robertson DM. 2013. Hydrology and water quality of Shell Lake, Washburn County, Wisconsin, with special emphasis on the effects of diversion and changes in water level on the water quality of a shallow terminal lake. USGS Scientific Invest Rep 2013-5181. USGS; 77 p.
- Koltun GF. Eberle CM Gray JR, Glysson GD. 2006. User’s manual for the Graphical Constituent Loading Analysis System (GCLAS). USGS Tech Meth, book 4, chap. C1, 51 p.
- Lamarra V. 1975. Digestive activities of carp as a major contributor of the nutrient loading of lakes. Verh Des Intern Verein Limnol. 19:2461–2468. doi:10.1080/03680770.1974.11896330.
- Matisoff G, Kaltenberg EM, Steely RL, Hummel SK, Seo J, Gibbons KJ, Bridgeman TB, Seo Y, Behbahani M, James WF, et al. 2016. Internal loading of phosphorus in western Lake Erie. J Great Lakes Res. 42(4):775–788. doi:10.1016/j.jglr.2016.04.004.
- Meals DW, Dressing SA, Davenport TE. 2010. Lag time in water quality response to best management practices: a review. J Environ Qual. 39(1):85–96. doi:10.2134/jeq2009.0108.
- Midwest Regional Climate Center (MRCC). 2015. MRCC application tools environment. http://mrcc.isws.illinois.edu/CLIMATE/Station/Daily/StnDyBTD2.jsp.
- Mortimer CH. 1941. The exchange of dissolved substances between mud and water in lakes. J Ecol. 29(2):280–329. doi:10.2307/2256395.
- Nurnberg GK. 2005. Quantification of internal phosphorus loading in polymictic lakes. Verh Int Verein Limnol. 29:623–626.
- Nurnberg GK. 2009. Assessing internal phosphorus load – problems to be solved. Lake Reserv Manage. 25:419–432.
- Ogdahl ME, Steinman AD, Weinert ME. 2014. Laboratory-determined phosphorus flux from lake sediments as a measure of internal phosphorus loading. J Visual. Exp. 85:51617. doi:10.3791/51617.
- Panuska JC, Kreider, JC. 2003. Wisconsin lake modeling suite program documentation and user’s manual: version 3.3 for Windows. PUBL-WR-363-94. Wisconsin Department of Natural Resources; 32 p.
- Reckhow KH. Beaulac MN, Simpson JT. 1980. Modeling phosphorus loading in lake response under uncertainty: a manual and compilation of export coefficients. USEPA EPA–440/5–80–011. USEPA.
- Robertson DM, Garn HS, Rose WJ. 2007. Response of calcareous Nagawicka Lake, Wisconsin, to changes in phosphorus loading. Lake Reserv Manage. 23(3):298–312. doi:10.1080/07438140709354018.
- Robertson DM, Juckem PF, Dantoin ED, Winslow LA. 2018a. Response in the hydrodynamics and water quality of Anvil Lake, Wisconsin, a shallow seepage lake, to changes in water level and climate. Lake Reserv Manage. 34(3):211–231. doi:10.1080/10402381.2017.1412374.
- Robertson DM, Kennedy JL. 2018. BATHTUB and Jensen model data sets used to evaluate changes in the water quality of the Winnebago Pool lakes, Wisconsin, in response to change in phosphorus loading: USGS data release, doi:10.5066/P9Y8BE4H.
- Robertson DM, Siebers BJ, Diebel MW, Somor AJ. 2018b. Water-quality response to changes in phosphorus loading of the Winnebago Pool lakes, Wisconsin, with special emphasis on the effects of internal loading in a chain of shallow lakes. USGS Scientific Invest Rep 2018–5099, USGS; 58 p. doi:10.3133/sir20185099.
- Scavia D, Kalcic M, Muenich RL, Aloysius N, Arnold J, Boles C, Confesor R, DePinto J, Gildow M, Martin J, et al. 2017. Multiple models guide strategies for agricultural nutrient reductions. Front Ecol Environ. 15(3):126–132. doi:10.1002/fee.1472.
- Schindler DW, Carpenter SR, Chapra SC, Hecky RE, Orihel DM. 2016. Reducing phosphorus to Curb Lake eutrophication is a success. Environ Sci Technol. 50(17):8923–8929. doi:10.1021/acs.est.6b02204.
- Søndergaard M, Kristensen P, Jeppesen E. 1992. Phosphorus release from resuspended sediment in the shallow and wind-exposed Lake Arresø, Denmark. Hydrobiologia. 228(1):91–99. doi:10.1007/BF00006480.
- Steinman A, Spears B, editors. 2020. Internal phosphorus loading in lakes: causes, case studies, and management. Fort Lauderdale, FL: J. Ross Publishing.
- The Cadmus Group. 2018. SWAT model setup, calibration, and validation for the Upper Fox-Wolf Basins TMDL. Cadmus Group LLC. https://dnr.wi.gov/topic/tmdls/foxwolf/.
- US Environmental Protection Agency (USEPA). 2019. Clean Water Act section 303(d): impaired waters and Total Maximum Daily Loads (TMDLs). https://www.epa.gov/tmdl.
- US Geological Survey (USGS). 2018. USGS water data for the nation: USGS database, digital data. doi:10.5066/F7P55KJN.
- Vollenweider RA. 1975. Input-output models with special reference to the phosphorus loading concept in limnology. Schweiz Z Hydrologie. 37(1):53–84. doi:10.1007/BF02505178.
- Walker WW. Jr. 1996. Simplified procedures for eutrophication assessment and prediction. Instruction Report W–96–2 [variously paginated]. US Army Corps of Engineers.
- Wang L, Liu Q, Hu C, Liang R, Qiu J, Wang Y. 2018. Phosphorus release during decomposition of the submerged macrophyte Potamogeton crispus. Limnology. 19(3):355–366. doi:10.1007/s10201-018-0538-2.
- Welch EB, Cooke GD. 1995. Internal phosphorus loading in shallow lakes: importance and control. Lake Reserv Manage. 11(3):273–281. doi:10.1080/07438149509354208.
- Wickman S, Herman L. 2005. Wisconsin citizen lake monitoring training manual. PUB-SS-1009. Wisconsin Department of Natural Resources; 54 pp.
- Wisconsin Department of Natural Resources (WDNR). 2019. Wisconsin 2020 Consolidated Assessment and Listing Methodology (WisCALM) for CWA Section 303(d) and 305(b) integrated reporting. Guidance#3200-2019-04. https://dnr.wi.gov/topic/SurfaceWater/Assessments.html.
- Wisconsin Department of Natural Resources (WDNR). 2020. Upper fox and wolf total maximum daily load (TMDL). https://dnr.wi.gov/topic/tmdls/foxwolf/.
- Wisconsin State Laboratory of Hygiene (WSLH). 1993. Environmental Sciences Section. Manual of analytical methods, inorganic chemistry unit. Revised Nov 1993 [variously paginated]. Wisconsin State Laboratory of Hygiene.