
Abstract
Johansson ML, Lavigne SY, Ramcharan CW, Heath DD, MacIsaac HJ. Detecting a spreading non-indigenous species using multiple methodologies. Lake Reserv Manage. 36:432–443.
Non-indigenous species (NIS) are often introduced to novel environments at very low population abundance. Detecting the presence of such an NIS can be very challenging, particularly as it spreads from the initial establishment site. This provides an opportunity to test detection limits using different approaches. This study tested the detection capability of 3 methods as zebra mussels (Dreissena polymorpha) spread from south to north through Lake Winnipeg, Manitoba, Canada. Zebra mussel veliger larvae were detected using cross-polarized light microscopy (CPLM), flow cytometry and microscopy (FlowCam), and conventional polymerase chain reaction (cPCR) analysis of environmental DNA (eDNA) on the same samples. Abundance generally declined from south to north in the lake but was lowest at Calder’s Dock (central). Although abundances could be quite low (i.e., <1 veliger/m3, Calder’s Dock) CPLM prevalence—the percentage of samples with at least one veliger—was high throughout the lake (99–100% of samples). Prevalence was lower for cPCR and FlowCam but was statistically associated with veliger abundance. Using standardized 3 mL subsamples (0.06–0.18 m3 of lake water sampled), all 3 methods had a high probability of veliger detection if large numbers of samples were processed. FlowCam was the most expensive method to process these 3 mL subsamples, while cPCR was least expensive and fastest. eDNA combined with intensive sampling is the most practical method for wide-scale monitoring programs for early detection. However, all 3 methods are complementary and could be deployed sequentially, with rapid initial sample processing using PCR, confirmation and density estimation with FlowCam, and detailed veliger counts using CPLM.
The rate of movement of non-indigenous species (NIS) across the globe is increasing due to human trade and travel (Hulme Citation2009). Many NIS exhibit a lag phase after introduction during which population size remains low and possibly below detection (Keitt et al. Citation2001, Adams et al. Citation2018, Coutts et al. Citation2018). Early detection of NIS and successful intervention programs may reduce unwanted impacts of harmful NIS (i.e., invasive species; e.g., Vander Zanden et al. Citation2010). Increasing sampling intensity can increase the probability of detection of these populations and reduce the occurrence of false negatives (Harvey et al. Citation2009, Hoffman et al. Citation2011, Citation2016, Counihan and Bollens Citation2017). Detection accuracy—the ability to successfully determine true presence or absence of a NIS—is important for rapid response programs.
Zebra mussels (Dreissena polymorpha) were first found in the Laurentian Great Lakes in the mid 1980s (Hebert et al. Citation1989). These bivalves profoundly alter invaded ecosystems, biofoul submerged structures, and clog pipes that draw water from infested waterways (Higgins and Vander Zanden Citation2010). Zebra mussels release gametes into the water when the temperature exceeds ∼12 C. After fertilization, larval veligers remain suspended in the water for 10 to 15 d or more—depending on temperature—before settling on hard substrates (Hebert et al. Citation1989, Reed et al. Citation1998). This planktotrophic stage allows dispersal via currents or movement in water transported by boaters (e.g., live wells). Veliger abundance is typically correlated with adult zebra mussel abundance, fecundity, and water temperature (Reed et al. Citation1998), and given that no native North American freshwater bivalves produce a veliger larvae (Thorpe and Rogers Citation2010), their presence can be used as an indicator of dreissenid mussels in the system (Johnson Citation1995, Frischer et al. Citation2005). While eradication of dreissenids from a large lake is not feasible (Nalepa Citation2014), early implementation of management strategies may help alleviate the downstream cost of dealing with the species (Hosler Citation2011).
Adult zebra mussels were first detected in 2009 in the Red River, North Dakota, which flows into Lake Winnipeg, Manitoba, Canada (Wassenaar and Rao Citation2012). In 2013, zebra mussels were found in the southernmost portion of Lake Winnipeg (Fisheries and Oceans Canada [DFO] Citation2014), likely introduced to the lake by advective flow from the Red River or by boaters moving contaminated vessels overland (L. Janusz, Manitoba Department of Sustainable Development, May/June 2015, pers. comm.). Following a failed eradication attempt in spring 2014, the Manitoba Aquatic Invasive Species Program reported that the species was present only in the south end of the lake during October 2015 (Conservation and Water Stewardship [CWS] Citation2015). The uneven distribution of the species is not surprising, as the lake is the ninth longest (416 km) in the world, the invasion took place in the extreme south part of the lake, and the invasion was seemingly discovered early on. The uneven distribution also afforded us an opportunity to test detection limits for the species using a variety of sampling methods.
Detection sensitivity—defined as the ability to detect a species at very low abundance—is directly related to sampling effort (Hoffman et al. Citation2016, Stanislawczyk et al. Citation2018). Intensive sampling can increase the probability of capturing an individual of a species present at low abundance. Sample processing methods may also affect detection sensitivity (Trebitz et al. Citation2017, Stanislawczyk et al. Citation2018). We explored effectiveness of 3 methods of sample analysis for zebra mussel detection, with a focus on veliger larvae.
The first method of analysis was cross-polarized light microscopy (CPLM). Birefringent properties of veligers’ shells (i.e., they have 2 different refractive indices due to their optical properties) cause them to stand out with a distinctive cross pattern against an otherwise dark background under cross-polarized light, allowing them to be efficiently enumerated (Johnson Citation1995). Prior to the advent of cross-polarized light microscopy, veligers were identified with transmitted light microscopy, which is more prone to false negatives (Marsden Citation1992). CPLM is widely used for veliger detection in monitoring and surveillance programs (see Hosler Citation2011), but like transmitted light microscopy it is labor-intensive and time-consuming.
The second method of analysis was a semi-automated particle visual analyzer, referred to as a flow cytometer and microscope (FlowCam) (Culverhouse et al. Citation2006, Fluid Imaging Technologies Inc. Citation2011, Hosler Citation2011). FlowCam captures images of microscopic particles as they pass through a flow cell (Fluid Imaging Technologies Inc. Citation2011). With a high image rate, FlowCam allows higher sample processing efficiency than CPLM or traditional microscopy (Wang et al. Citation2015). Images are stored and can be sorted by variables such as size and shape. With proper optimization, FlowCam can automatically classify zooplankton or phytoplankton, making the job of species identification easier and more efficient (Camoying and Yñiguez Citation2016). FlowCam has been widely used to assess changes in plankton community structure (Graham and Camp 2017), for identification of metazooplankton (Le Bourg et al. Citation2015), and to identify dinoflagellate cells (Buskey and Hyatt Citation2006) or cyanobacteria associated with harmful algal blooms (Graham et al. Citation2018). Fitted with a cross-polarizing filter (XPL attachment), FlowCam can be used for veliger detection (Spaulding Citation2009).
Finally, we used molecular detection by conventional polymerase chain reaction (cPCR), amplifying environmental DNA (eDNA; Egan et al. Citation2015), specifically in this case DNA from veliger larvae. Planktonic organisms or DNA shed by organisms into the environment can be collected, isolated, and analyzed (CitationTaberlet et al. 2012, Rees et al. Citation2014). Detection by eDNA makes use of species-specific primers to amplify segments of DNA of target species, allowing cross-referencing against online databases for rapid identification. eDNA has been used for identification of species ranging from microbes to mammals (Rees et al. Citation2014).
A previous study (Frischer et al. Citation2012) used a double-blind approach to test the reliability of the same 3 basic approaches (although that study’s FlowCam approach did not incorporate cross-polarizing lenses), finding that CPLM was most reliable, followed by FlowCam and then cPCR. By adding cross-polarizing lenses to the FlowCam, our approach promises easier identification of veligers, and improved reliability. We are also able to test a newer cPCR approach for eDNA (Egan et al. Citation2015) that was not available at the time of the previous study. In addition, while accuracy and reliability of the 3 methods of analysis are important and have been discussed (Frischer et al. Citation2012), feasibility, ease of use, and economics of using different methods have not been explored. Cost-effectiveness of these methods is important, as it may inform which detection method should be utilized in the future (Roos et al. Citation1998). Depending on budget, time constraints, and availability of equipment, one of these 3 methods may be better suited for the needs of a particular monitoring program (Chadès et al. Citation2017). NIS monitoring programs can benefit from lowering costs and increasing efficiency (Bogich et al. Citation2008, Hauser and McCarthy Citation2009). To that end, we examined the estimated cost and time required for each method to analyze 500 samples.
We hypothesized that detection of zebra mussels in the north basin of Lake Winnipeg where the species had not been reported would be more difficult than in the south basin where they were known to occur. We tested this hypothesis by establishing a proposed population density gradient from south to north and intensively sampling at 5 sites, with samples then analyzed using all 3 detection methods. Here we test improved versions of the FlowCam approach (adding cross-polarizing lenses) and cPCR (Egan et al. Citation2015), comparing the ability of each method to detect veligers in natural samples and additionally assessing the impact of sample number and veliger abundance on detection probability. Specifically, we hypothesized that the probability of detecting at least one veliger would increase with abundance of veligers at a site and with increasing numbers of samples examined. Finally, we assess the relative costs of the 3 methods to assess the cost-effectiveness of monitoring using each method.
Materials and methods
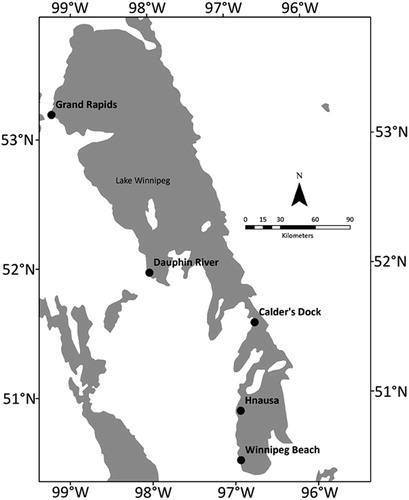
Our study location, Lake Winnipeg, is located in Manitoba, Canada. It has an area of 23,750 km2 and a watershed of 9,53,000 km2 (Brunskill et al. Citation1980). We intensively sampled 5 locations in Lake Winnipeg () to assess veliger presence after mussels were presumed to have spawned in relation to seasonal water temperature (Marsden Citation1992, Counihan and Bollens Citation2017). We selected the 5 sites to establish a clear south to north gradient, sampling them from 23 to 27 July 2015 in the following order: Winnipeg Beach, Grand Rapids, Dauphin River, Calder’s Dock, and Hnausa. Samples were collected with vertical hauls using plankton nets (63 µm mesh, 50 cm diameter mouth and 150 cm length). This approach means that we were collecting relatively large particles (i.e., whole veligers and other plankton) while sampling larger volumes of water than typically sampled for soluble or particulate eDNA (e.g., Egan et al. Citation2015). Thus, our method would be expected to increase the probability of sampling veligers, but would collect particulate or soluble eDNA poorly, if at all. New nets were used at each location to prevent cross-contamination. We collected 100 plankton tows at each location from a drifting boat, yielding a total of 500 samples. Global positioning system (GPS) coordinates of start and end points for each sampling location were recorded. Vertical hauls were collected from just above lake bottom (5.5 m to 15 m depths) and hauled up at a rate of approximately 0.5 m/s (Marsden Citation1992). The depth of each haul was recorded. Total sample volumes for each haul ranged between 1 and 3 m3. To prevent contamination, the boat bilge was drained and dried between sites. All samples were immediately concentrated in a 40 µm sieve, preserved in 95% ethanol, and stored at ambient temperature until processing in the laboratory.
Figure 1. Map of Lake Winnipeg, Manitoba. Black dots indicate sampling locations. Grand Rapids and Dauphin River are locations in the north basin of the lake. Calder’s Dock is in a channel connecting the north and south basins. Hnausa and Winnipeg Beach are in the south basin, where the mussel was first observed.
In the laboratory, complete samples were filtered through a 300 µm Nitex mesh sieve to remove larger particles. Dreissena veligers settle from the water column when animals are between 200 µm and 250 µm (Hebert et al. Citation1989), so filtering out the >300 µm fraction of plankton in the samples was not expected to affect veliger occurrence or abundance in samples while eliminating many interfering particles and thereby rendering detection of the species easier (Johnson Citation1995). Filtered samples were resuspended in 50 mL of 95% ethanol and subsequently analyzed using methods described in the following for veliger/mussel detection.
Following Johnson (Citation1995), we used cross-polarized lenses on a stereomicroscope to detect and enumerate veligers in samples. Filtered whole samples were processed under cross-polarized light on a Leica transmitted light stereomicroscope at 16× magnification. Polarizing lenses were custom-made by Joseph F.J. Zeman, A-Z Microscope Limited (291 Cheapside Street, London, Ontario, N6A 2A3). We identified and counted only Dreissena veligers, recording their abundance using laboratory tally counters. Among North American bivalves, only the introduced dreissenids produce 2-shelled veliger larvae (native veliger-producing snails have a single, spiraled shell), making identification straightforward (Thorpe and Rogers Citation2010). To compare the relative probability of detecting veligers in low abundance samples between our 3 methods, we additionally processed 100 subsamples of 3 mL each (representing between 0.06 and 0.18 m3 lake water sampled) from the Calder’s Dock site using CPLM and counted the number of subsamples with at least one veliger detected.
To assess the detection of veligers using FlowCam, the same samples that were used in CPLM were shaken vigorously by hand, and a 3 mL subsample (0.06–0.18 m3 water sampled) was removed using a disposable plastic pipette. We mixed each subsample with 3 mL of polyvinylpyrrolidone (PVP) solution to increase viscosity and to slow the movement of particles through the flow cell. A 4× objective was used on the FlowCam. We set the flow of plankton through the flow cell to the lowest setting to ensure that the maximum number of particles was captured. A cross-polarizing filter (XPL) was attached to the FlowCam to increase visibility of veligers. We imaged particles using the Image Management System (IMS) under autoimaging mode. We analyzed and manually enumerated captured images of plankton using Visual Spreadsheet software, since many of the images captured by FlowCam IMS software were not veligers (most images captured debris or other plankton), and many veligers were captured only as partial images. Because no native bivalves produce veliger larvae, we could easily confirm dreissenids from manual, visual inspection of saved images (Fluid Imaging Technologies Inc Citation2011). To assess the possibility that 3 mL subsamples created volume-based artifacts in our veliger counts, we also tested our FlowCam results using subsample volumes of 1 mL (representing 0.02–0.06 m3 lake water sampled), 5 mL (0.1–0.3 m3), 10 mL (0.2–0.6 m3), 15 mL (0.3–0.9 m3), and 25 mL (0.5–1.5 m3) from one high-abundance (southern site) sample and one low-abundance (northern site) sample.
Our eDNA approach consisted of extracting DNA from bulk plankton samples, rather than water samples (Peñarrubia et al. Citation2016, Ardura et al. Citation2017). By sampling a large volume of water, we increase the odds of collecting at least one veliger. However, we were unable to collect soluble or particulate DNA using this method. Another advantage of collecting whole, live planktonic organisms and preserving them immediately in 95% ethanol is that DNA degradation was unlikely to be a significant problem. Total genomic DNA was extracted from a 1 mL subsample of each filtered bulk plankton sample (the same samples as previously used for CPLM and FlowCam), representing between 0.02 and 0.06 m3 of lake water sampled (Zaiko et al. Citation2015, Ardura et al. Citation2017). We based our choice of conventional PCR (instead of real-time quantitative PCR, qPCR) on the low cost and ubiquity of the skills and equipment needed to deploy this technique (Xia et al. Citation2018). The trade-off with this decision is that cPCR is nonquantitative and less sensitive than qPCR (Xia et al. Citation2018). In addition, at the time of our analysis, no qPCR assays for dreissenids had been developed. An assay for zebra mussels is now available (Gingera et al. Citation2017), and qPCR could be used to increase sensitivity and add a quantitative element to an eDNA survey for zebra mussel presence. The cytochrome oxidase I (COI) gene was PCR amplified using species-specific primers, DpCOI-F (5'-GGGATTCGGAAATTGATTGGTAC-3') and DpCOI-R (5'-GAATCTGGTCACACCAATAGATGTGC-3') (Egan et al. Citation2015). All PCR reactions were performed in 11 μL reactions containing 1 μL of template DNA, 0.8 μL of Mg2SO4 (BioBasic), 0.2 μL dNTPs, 0.2 μL of each primer, 1 μL of 10× buffer, and 0.06 μL of Taq polymerase (BioBasic). Cycling conditions for PCR were an initial denaturation step of 95 C for 1 min, 30 cycles of 94 C for 30 sec, 59 C for 45 sec, and 72 C for 1 min, and a final extension at 72 C for 8 min. To assess positive detections, we visualized PCR products on a 2% agarose gel. We conducted a sensitivity test for our primer pair using individual zebra mussel veligers to determine the minimum number of veligers needed to amplify/detect DNA. By picking individual veligers from a single sample and placing them directly into the extraction buffer, we extracted and PCR amplified one, 3, 5, and 10 individual veligers using the same PCR protocol already described. We performed parallel extractions and PCR with and without phytoplankton included to assess the effects of PCR inhibition by phytoplankton and qualitatively assessed the results using a 2% agarose gel. Finally, we extracted and PCR amplified DNA from 100 subsamples of 3 mL each (0.06 and 0.18 m3 lake water) from the Calder’s Dock site to directly compare detection probabilities at a similar sample volume among our 3 methods.
To test whether abundances differed significantly between sample sites, we conducted a Kruskal–Wallis test followed by a Dunn test with Bonferroni correction for multiple comparisons on CPLM abundance estimates for the 5 sites sampled using the “FSA” package in R (Herberich et al. Citation2010, Ogle et al. Citation2020, R Development Core Team Citation2020). We conducted chi-squared tests with Yates’s correction on contingency tables on prevalence at different locations obtained by the 3 different methods (whole sample CPLM, 3 ml subsample FlowCam, and 1 mL subsample eDNA). We performed pairwise comparisons among our 3 sampling methods (eDNA, FlowCam, and CPLM) using a Kruskal–Wallis test followed by a Dunn test with Bonferroni correction for multiple comparisons to compare prevalence obtained from the lowest CPLM prevalence location (Calder’s Dock) using standardized 3 mL subsample volumes for each method (Ogle et al. Citation2020, R Development Core Team Citation2020). We then calculated prevalence data from Calder’s Dock samples to estimate the cumulative probability of detecting at least one veliger with increasing number of samples analyzed with basic R (R Development Core Team Citation2020). We did this by randomly sampling prevalence data 100 times with the corresponding number of samples to obtain the cumulative probability of detecting at least one veliger.
To assess the comparative cost-effectiveness of the 3 methods, we collected the startup cost of buying new equipment for each method, as well as that of all necessary paraphernalia for each method. Based on labor, time, and consumables, we calculated the cost needed to process each sample and the labor required (). We have also included the cost of using qPCR in our results, as it has gained popularity in eDNA analyses (Xia et al. Citation2018).
Table 1. Cost and labor comparison of 3 methods of analysis of 500 plankton samples collected from Lake Winnipeg for the detection of zebra mussels. Cost of equipment compiled from our own purchases and invoices. PCR costs are from Schlatter et al. (Citation2015). All costs are in American dollars (USD$).
Results
Veliger abundance estimates from CPLM varied widely across Lake Winnipeg. Abundances were highest in the south (Winnipeg Beach mean = 493.90 individuals [inds]/m3, SD = 212.69 inds/m3; Hnausa mean = 256.19 inds/m3, SD = 71.90 inds/m3), low in the north (Grand Rapids mean = 12.12 inds/m3, SD = 24.19 inds/m3; Dauphin River mean = 91.52 inds/m3, SD = 42.28 inds/m3), and, surprisingly, lowest in the channel between basins (Calder’s Dock mean = 0.47 inds/m3, SD = 0.66 inds/m3). There was a significant difference in CPLM abundances between locations (Kruskal–Wallis followed by Dunn test, p < 0.001 for all pairwise comparisons).
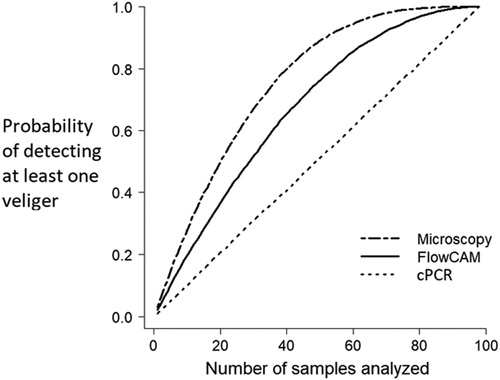
CPLM yielded high prevalence at both southern sites (100%) and both northern sites (99–100%), with lower prevalence (63%) at Calder’s Dock, in the channel between the north and south basins (). FlowCam returned moderate prevalence values (45–63%) in the south, and low to moderate prevalence values (2–34%) elsewhere (). eDNA gave high prevalence values (91–94%) only at the 2 southern locations, failed at the mid-lake Calder’s Dock (0%), and gave low prevalence at the northern locations (4–7%; ). A sensitivity test determined that a single veliger could be detected in a sample using the primer pair selected, demonstrating high sensitivity of the marker. Our PCR inhibition testing suggested that a high density of phytoplankton in the sample did result in PCR inhibition, although detection of small numbers of veligers was still possible (i.e., 2 or more veligers could be reliably detected even with phytoplankton present). Prevalence obtained by the 3 different methods were significantly different from each other in all pairwise comparisons (chi-squared tests with Yates’s corrections, p < 0.05), except between eDNA and FlowCam at Grand Rapids and Calder’s Dock. This first approach utilized different subsample fractions to assess prevalence, as subsample volumes represent practical limits related to sample processing for both FlowCam and cPCR. Using our second approach, comparing standardized 3 mL subsamples from our lowest prevalence and abundance site (Calder’s Dock), prevalence was again significantly higher with CPLM than with either FlowCam (Dunn test, p ≪ 0.05) or eDNA (Dunn test, p < 0.05; ). Prevalence also differed significantly between FlowCam and eDNA (Dunn test, p < 0.05). The cumulative probability of detecting at least one veliger was significantly related to the number of samples analyzed (). The probability of detecting at least one veliger with increasing number of samples analyzed increased significantly more quickly using CPLM than with either of the other methods (GLM, p < 0.001, for all pairwise comparisons).
Figure 2. Prevalence (proportion of samples with positive detections) of zebra mussels in samples analyzed using CPLM, FlowCam, and cPCR. Lake water volumes surveyed for a given subsample varied from 1 to 3 m3 (complete samples) for CPLM, from 0.06 to 0.18 m3 for FlowCam, and were 0.02 and 0.06 m3 for cPCR.
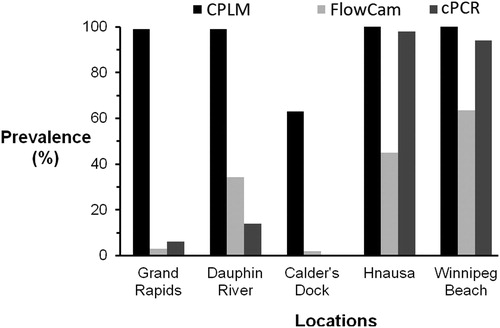
Figure 3. Probability of detecting at least one zebra mussel veliger with increasing number of 3 mL subsamples analyzed. Three different methods (FlowCam, eDNA, and CPLM) were tested using 3 mL subsamples (of 98 total) of plankton collected from Calder’s Dock in Lake Winnipeg. Prevalence was randomly sampled using R to determine detection probability with increasing number of samples analyzed.
In the test for volume-based artifacts in FlowCam abundances, we found no significant difference in the number of individual veligers detected per unit of lake volume sampled with increasing subsample volume for either the low-abundance location (analysis of variance [ANOVA], df =1,16, F = 0.54, p = 0.47) or the high-abundance location (ANOVA, df =1,16, F = 0.36, p = 0.56).
In our comparison of the economics of the 3 methods tested plus qPCR, CPLM had the highest sensitivity, second lowest overall cost (startup plus cost to run 500 samples, including labor and consumables) at $11,030, and intermediate processing time (, ). cPCR had the lowest overall costs for startup and running of 500 samples of any of the compared methods at $8962. qPCR had considerably higher startup costs and highest running cost, and therefore the second highest overall costs at $33,801, but promises higher sensitivity than cPCR (). FlowCam had intermediate sensitivity but the highest startup cost, intermediate running cost, and highest processing time, giving it the highest overall cost by far at $93,996 (, ).
Discussion
Increasing sampling effort in plankton sampling can increase the success of detection of zebra mussel veligers (Counihan and Bollens Citation2017). However, most monitoring programs are constrained by cost and time required for analysis. In this study, we demonstrated successful detection of zebra mussel veligers in a newly invaded system via intensive sampling and 3 different methods of analysis. Despite being only discovered in Lake Winnipeg in autumn 2013, veligers were detected at all 5 lake locations, suggesting long-distance dispersal (∼400 km) by summer 2015. Veliger abundance, as estimated by whole-sample (1–3 m3 of lake water sampled) CPLM assays, in the north basin and mid-lake channel was very low, universally lower than 300 individual/m3. The south basin, by contrast, had a higher mean abundance of 800 individual/m3. Overall, veliger abundance in the lake was very low, however, with a maximum observed density of only 1075 individual/m3. In contrast, Lake Erie had about 3000 individual/m3 in 1989 during the initial stages of invasion (Riessen et al. Citation1993), increasing to between 40,000 to 400,000 individuals/m3 during summer 1990 (MacIsaac et al. Citation1992). The very low observed veliger abundance in Lake Winnipeg could indicate the species was in the lag phase of invasion.
Veligers were present at very low but detectable abundance throughout the lake. Prevalence using CPLM at both southern locations was 100%, and nearly as high (99–100%) at northern ones (). Low abundance and high prevalence of veligers in Lake Winnipeg may indicate that there are small populations of adult zebra mussels throughout the lake, even in the north basin. Adult zebra mussels were detected by monitoring programs in the south basin long before detections in the north (CWS Citation2015). As expected, abundance of veligers was also higher in the south basin, where they seemingly established earlier. Samples from Calder’s Dock had the lowest abundance, possibly due to high flow rate through the narrow channel (Zhao et al. Citation2012). Veligers experience high mortality rates when exposed to turbulent water or hydrodynamic forces (Rehmann et al. Citation2003, Horvath and Crane Citation2010).
The seemingly high rate of spread over such a short time span suggests that undetected population(s) existed farther north in the lake during 2013, likely because humans or natural processes dispersed mussels to the northern basin shortly after initial colonization. Veligers could spread from south to north via prevailing water currents (Zhao et al. Citation2012), or postveligers or adults could spread attached to drifting macrophytes or debris (Johnson and Carlton Citation1996, Bobeldyk et al. Citation2005). The abundance of veligers may also vary widely in one season (Riessen et al. Citation1993). Our abundance and prevalence data were obtained from a single sampling event. Increasing the number and timing of sampling events can provide a better understanding of the dynamics in veliger abundance and prevalence and, possibly, of mechanism(s) of dispersal. Also, samples collected in previous years might shed light on the establishment date in the lake, as well as on spread dynamics.
Effective monitoring is needed for the early detection of invasive dreissenid mussels to prevent costly management efforts. While intensive sampling can increase the chance of detection, methods of analysis need to be quick, sensitive, and cost-effective. Ideally, methods should be suitable for efficient processing of large numbers of samples obtained from intensive sampling (i.e., with high sensitivity; Counihan and Bollens Citation2017). Most research has focused on optimization of a single method of detection. Even when comparing multiple methods, different samples may be analyzed (Frischer et al. Citation2012). In our study, all 3 methods were performed on the same samples, beginning with nondestructive sampling using CPLM, followed by nondestructive sampling using FlowCam, and finishing with partially destructive sampling using eDNA.
We observed significantly lower prevalence with FlowCam and eDNA as compared to CPLM, indicating that the former 2 approaches were more prone to detection failures. It is important to note that the high performance of CPLM in our study was facilitated, in part, by removal of large (>300 μm) plankton. Had we retained this matter in our sample, it is possible—indeed, likely—that some veligers would have been partially or fully covered and thus not observed, leading to false negatives. False negatives with FlowCam were seemingly caused by the IMS software not recognizing veligers. We noted that some veligers passed through the flow cell in the FlowCam but were not captured by the imaging software, causing FlowCam counts to be lower than microscopic ones even though both approaches used highly effective, cross-polarizing lenses. Visual inspection of captured FlowCam images revealed that many particles captured were not veligers, raising the possibility of false positives if images are not carefully vetted. These errors with the FlowCam could occur when the software captures images of birefringent sand particles or microplastics (Lusher et al. Citation2017). Newer software has been developed to better detect veligers (Fluid Imaging Technologies Inc Citation2017).
All locations had at least one positive cPCR result for the presence of zebra mussels except for the Calder’s Dock location. Our primer pair was determined to possess high sensitivity. As indicated by our inhibition testing, phytoplankton did make it less likely that we detected one veliger in our samples. Thus, it is possible that PCR inhibition occurred in some of the locations with prolific phytoplankton, which could result in false negatives. The use of optimized reagents for use with PCR inhibitors and the use of internal positive controls in PCRs would help to raise detection probabilities. However, veliger abundance at Calder’s Dock was very low (averaging 0.39 veligers/m3); 1 mL subsamples (0.02–0.06m3 lake volume sampled) at that location resulted in 0% prevalence using eDNA. Preliminary work determined that one veliger was enough to obtain a positive detection result, but our 1 mL subsamples likely failed to contain any veligers for this site. Supporting this hypothesis, tests with higher volume (3 mL) subsamples succeeded in detecting veligers more often. In situations where expected abundance of the target is low, it would be advisable to extract DNA from the whole plankton sample or from larger subsamples to increase the odds of capturing a rare veliger.
Using standardized subsample volumes (3 mL) and repetitively sampling a single location using the 3 different methods, we observed the highest detection probability using CPLM. However, all 3 methods had a high probability of detection when large numbers of samples were processed. As we intentionally selected a sample known to have very low veliger abundance, these results are highly relevant to workers who suspect their system may be newly invaded by Dreissena mussels, or as part of regular pre-invasion monitoring.
In this study we demonstrated that dispersal of zebra mussels across one of the world’s largest lakes seemingly occurred very quickly. Zebra mussel veligers can persist in the plankton for up to 90 d (Ackerman et al. Citation1994). If we estimate current velocities from Figure 8 in Zhao et al. (Citation2012) as between 1 and 2 cm/sec, veligers could potentially be transported up to 75 to 150 km in those 90 d, suggesting that current-driven spread would be sufficient to explain the presence of veligers throughout the lake within a few years of colonization. Boater traffic may simply supplement or enhance this natural spread. Detection of zebra mussel veligers was most successful using CLPM, owing to the animals’ unique birefringence property. Although labor-intensive, CPLM yielded the highest detection probability while also providing abundance estimates, with relatively low startup and running costs. cPCR was less sensitive than CPML, but has relatively low costs and could be useful for large-scale monitoring programs where rapid processing of large numbers of samples is desired, as many samples can be analyzed quickly and inexpensively. FlowCam has the advantage that it can process large numbers of samples and present candidate images to the operator for confirmation with significantly lower operator fatigue than CPLM, at a cost of lower sensitivity and relatively high startup costs. If a highly sensitive eDNA approach were desired, the researcher could use qPCR (at higher startup and running cost than cPCR), as qPCR is up to 10× more sensitive than cPCR (1 × 10⁻⁷ vs. 1 × 10⁻⁶ ng/µL; Xia et al. Citation2018), making detection more likely.
Depending on management priorities, managers may arrive at different detection solutions. However, all 3 methods studied are complementary and could be deployed in combination. Ongoing monitoring could be performed quickly and cheaply using cPCR on planktonic or water samples. FlowCam, with its ability to produce essentially unlimited images of potential species of interest, could be used to confirm the presence of a species of interest, to estimate abundance, or to assess the presence of other plankton species that might compromise detection with either CPLM or cDNA. Researchers or managers could then use CPLM to accurately assess abundance, size structure, or other visual characteristics of the species of interest.
Acknowledgments
We thank Colin Van Overdijk for assistance in the field, and Joelle Pecz, Jezel Gicole, Taylor Haludek, and Ian MacIsaac for their assistance in the lab. We also thank Laureen Janusz for invaluable information for this project, and Alice Grgicak-Mannion and Courtney Spencer for a map of Lake Winnipeg. This study was funded by NSERC CREATE Great Lakes to Dr. Paul Sibley, University of Guelph, NSERC Discovery grants to HJM and DDH, and Canada Research Chair in Aquatic Invasive Species to HJM.
References
- Ackerman JD, Sim B, Nichols SJ, Claudi R. 1994. A review of the early life history of zebra mussels (Dreissena polymorpha): comparisons with marine bivalves. Can J Zool. 72(7):1169–1179. doi:10.1139/z94-157.
- Adams AAY, Lardner B, Knox AJ, Reed RN. 2018. Inferring the absence of an incipient population during a rapid response for an invasive species. PLoS One. 13(9):e0204302. doi:10.1371/journal.pone.0204302.
- Ardura A, Zaiko A, Borrell Y, Samuiloviene A, Garcia-Vazquez E. 2017. Novel tools for early detection of a global aquatic invasive, the zebra mussel Dreissena polymorpha. Aquatic Conserv. 27(1):165–176. doi:10.1002/aqc.2655.
- Bobeldyk AM, Bossenbroek JM, Evans-White MA, Lodge DM, Lamberti GA. 2005. Secondary spread of zebra mussels (Dreissena polymorpha) in coupled lake-stream systems. Ecoscience. 12(3):339–346. doi:10.2980/i1195-6860-12-3-339.1.
- Bogich TL, Liebhold AM, Shea K. 2008. To sample or eradicate? A cost minimization model for monitoring and managing an invasive species. J Appl Ecol. 45(4):1134–1142. doi:10.1111/j.1365-2664.2008.01494.x.
- Brunskill GJ, Elliott SEM, Campbell P. 1980. Morphometry, hydrology, and watershed data pertinent to the limnology of Lake Winnipeg. Can Manuscr Rep Fish Aquat Sci. 1556:32.
- Buskey EJ, Hyatt CJ. 2006. Use of the FlowCam for semi-automated recognition and enumeration of red tide cells (Karenia brevis) in natural plankton samples. Harmful Algae. 5(6):685–692. doi:10.1016/j.hal.2006.02.003.
- Camoying MG, Yñiguez AT. 2016. FlowCAM optimization: attaining good quality images for higher taxonomic classification resolution of natural phytoplankton samples. Limnol Oceanogr Methods. 14(5):305–314. doi:10.1002/lom3.10090.
- Chadès I, Nicol S, Rout TM, Péron M, Dujardin Y, Pichancourt JB, Hastings A, Hauser CE. 2017. Optimization methods to solve adaptive management problems. Theor Ecol. 10(1):1–20. doi:10.1007/s12080-016-0313-0.
- Conservation and Water Stewardship (CWS). 2015. Manitoba conservation and water stewardship reports fall monitoring show zebra mussels are now present in the north basin of Lake Winnipeg. http://news.gov.mb.ca/news/?item=36496.
- Counihan TD, Bollens SM. 2017. Early detection monitoring for larval dreissenid mussels: how much plankton sampling is enough? Environ Monit Assess. 189(3):98. doi:10.1007/s10661-016-5737-x.
- Coutts SR, Helmstedt KJ, Bennett JR. 2018. Invasion lags: the stories we tell ourselves and our inability to infer process from pattern. Divers Distrib. 24(2):244–251. doi:10.1111/ddi.12669.
- Culverhouse PF, Williams R, Benfield M, Flood PR, Sell AF, Mazzocchi MG, Buttino I, Sieracki M. 2006. Automatic image analysis of plankton: future perspectives. Mar Ecol Prog Ser. 312:297–309. doi:10.3354/meps312297.
- Egan SP, Grey E, Olds B, Feder JL, Ruggiero ST, Tanner CE, Lodge DM. 2015. Rapid molecular detection of invasive species in ballast and harbor water by integrating environmental DNA and light transmission spectroscopy. Environ Sci Technol. 49(7):4113–4121. doi:10.1021/es5058659.
- Fisheries and Oceans Canada (DFO). 2014. Science response 2014/031 – Lake Winnipeg zebra mussel treatment. http://www.dfo-mpo.gc.ca/csas-sccs/publications/scr-rs/2014/2014_031-eng.html.
- Fluid Imaging Technologies Inc. 2011. FlowCam manual version 3.0. http://www.ihb.cas.cn/fxcszx/fxcs_xgxz/201203/P020120329576952031804.pdf.
- Fluid Imaging Technologies Inc. 2017. FlowCam application note. http://info.fluidimaging.com/hs-fs/hub/300163/file-1868360604-pdf/documents/Application_Notes/Invasive-Species-Birefringence-App-Note.pdf?t=1498652528613.
- Frischer ME, Kelly KL, Nierzwicki-Bauer S. 2012. Accuracy and reliability of Dreissena spp. larvae detection by cross-polarized light microscopy, imaging flow cytometry, and polymerase chain reaction assays. Lake Reserv Manag. 28(4):265–276. doi:10.1080/07438141.2012.731027.
- Frischer ME, McGrath BR, Hansen AS, Vescio PA, Wyllie JA, Wimbush J, Nierzwicki-Bauer SA. 2005. Introduction pathways, differential survival of adult and larval zebra mussels (Dreissena polymorpha), and possible management strategies, in an Adirondack lake, Lake George, NY. Lake Reserv Manag. 21(4):391–402. doi:10.1080/07438140509354444.
- Gingera TD, Bajno R, Docker MF, Reist JD. 2017. Environmental DNA as a detection tool for zebra mussels Dreissena polymorpha (Pallas, 1771) at the forefront of an invasion event in Lake Winnipeg, Manitoba, Canada. Management of Biological Invasions 8:287–300. doi: 10.3391/mbi.2017.8.3.03.
- Graham MD, Cook J, Graydon J, Kinniburgh D, Nelson H, Pilieci S, Vinebrooke RD. 2018. High-resolution imaging particle analysis of freshwater cyanobacterial blooms. Limnol Oceanogr Methods. 16(10):669–679. doi:10.1002/lom3.10274.
- Harvey CT, Qureshi SA, MacIsaac HJ. 2009. Detection of a colonizing, aquatic, non-indigenous species. Divers Distrib. 15(3):429–437. doi:10.1111/j.1472-4642.2008.00550.x.
- Hauser CE, McCarthy MA. 2009. Streamlining “search and destroy”: cost-effective surveillance for invasive species management. Ecol Lett. 12(7):683–692.
- Hebert PDN, Muncaster BW, Mackie GL. 1989. Ecological and genetic studies on Dreissena polymorpha (Pallas) a new mollusc in the Great Lakes. Can J Fish Aquat Sci. 46(9):1587–1591. doi:10.1139/f89-202.
- Herberich E, Sikorski J, Hothorn T. 2010. A robust procedure for comparing multiple means under heteroscedasticity in unbalanced designs. PLoS One. 5(3):e9788. doi:10.1371/journal.pone.0009788.
- Higgins SN, Vander Zanden MJ. 2010. What a difference a species makes: a meta-analysis of dreissenid mussel impacts on freshwater ecosystems. Ecol Monogr. 80(2):179–196. doi:10.1890/09-1249.1.
- Hoffman JC, Kelly JR, Trebitz AS, Peterson GS, West CW. 2011. Effort and potential efficiencies for aquatic non- native species early detection. Can J Fish Aquat Sci. 68:264–2079.
- Hoffman JC, Schloesser J, Trebitz AS, Peterson GS, Gutsch M, Quinlan H, Kelly JR. 2016. Sampling design for early detection of aquatic invasive species in Great Lakes ports. Fisheries. 41(1):26–37. doi:10.1080/03632415.2015.1114926.
- Horvath TG, Crane L. 2010. Hydrodynamic forces affect larval zebra mussel (Dreissena polymorpha) mortality in a laboratory setting. AI. 5(4):379–385. doi:10.3391/ai.2010.5.4.07.
- Hosler DM. 2011. Early detection of dreissenid species: Zebra/Quagga mussels in water systems. AI. 6(2):217–222. doi:10.3391/ai.2011.6.2.10.
- Hulme PE. 2009. Trade, transport and trouble: managing invasive species pathways in an era of globalization. J Appl Ecol. 46(1):10–18. doi:10.1111/j.1365-2664.2008.01600.x.
- Johnson LE. 1995. Enhanced early detection and enumeration of zebra mussel (Dreissena spp.) veligers using cross-polarized light microscopy. Hydrobiologia. 312(2):139–146. doi:10.1007/BF00020769.
- Johnson LE, Carlton JT. 1996. Post-establishment spread in large-scale invasions: dispersal mechanisms of the zebra mussel Dreissena polymorpha. Ecology. 77(6):1686–1690. doi:10.2307/2265774.
- Keitt KH, Lewis MA, Holt RD. 2001. Allee effects, invasion pinning, and species' borders. Am Nat. 157(2):203–216. doi:10.1086/318633.
- Le Bourg B, Cornet-Barthaux V, Pagano M, Blanchot J. 2015. FlowCam as a tool for studying small (80–1000 µm) metazooplankton communities. J Plankton Res. 37(4):666–670. doi:10.1093/plankt/fbv025.
- Lusher AL, Welden NA, Sobral P, Cole M. 2017. Sampling, isolating and identifying microplastics ingested by fish and invertebrates. Anal Methods. 9(9):1346–1360. doi:10.1039/C6AY02415G.
- MacIsaac HJ, Sprules G, Johannson OE, Leach JH. 1992. Filtering impacts of larval and sessile zebra mussels (Dreissena polymorpha) in western Lake Erie. Oecologia. 92(1):30–39. doi:10.1007/BF00317259.
- Marsden JE. 1992. Standard protocols for monitoring and sampling zebra mussels. Champaign (IL): Illinois Natural History Survey Biological Notes.
- Nalepa TF. 2014. Relative comparison and perspective on invasive species in the Laurentian and Swedish Great Lakes. Aquat Ecosyst Health Manag. 17(4):394–403. doi:10.1080/14634988.2014.972494.
- Ogle DH, Wheeler P, Dinno A. 2020. FSA: Fisheries Stock Analysis. R package version 0.8.30.9000. https://github.com/droglenc/FSA.
- Peñarrubia L, Alcaraz C, B, de Vaate A, Sanz N, Pla C, Vidal O, Viñas J. 2016. Validated methodology for quantifying infestation levels of dreissenid mussels in environmental DNA (eDNA) samples. Sci Rep. 6:39067. doi:10.1038/srep39067.
- R Development Core Team. 2020. R: a language and environment for statistical computing. R Foundation for Statistical Computing, Vienna, Austria. http://www.R-project.org.
- Reed DP, Herod JJ, Sickel JB. 1998. Variations in zebra mussel (Dreissena polymorpha) veliger densities throughout 1996 at Dam 52 on the lower Ohio River. J Freshw Ecol. 13(3):255–261. doi:10.1080/02705060.1998.9663617.
- Rees HC, Maddison BC, Middleditch DJ, Patmore JRM, Gough KC. 2014. The detection of aquatic animal species using environmental DNA—a review of eDNA as a survey tool in ecology. J Appl Ecol. 51(5):1450–1459. doi:10.1111/1365-2664.12306.
- Rehmann CR, Stoeckel J, Schneider DW. 2003. Effect of turbulence on the mortality of zebra mussel veligers. Can J Zool. 81(6):1063–1069. doi:10.1139/z03-090.
- Riessen HP, Ferro TA, Kamman A. 1993. Distribution of zebra mussel (Dreissena polymorpha) veligers in eastern Lake Erie during the first year of colonization In: Nalepa T, Schloesser D, editors. Zebra mussels: biology, impacts, and control. Boca Raton (FL): Lewis Publishers; p. 143–152.
- Roos BR, Van Cleeff MRA, Githui WA, Kivihya-Ndugga L, Odhiambo JA, Kibuga DK, Klatser PR. 1998. Cost-effectiveness of the polymerase chain reaction versus smear examination for the diagnosis of tuberculosis in Kenya: a theoretical model. Int J Tuberc Lung Dis. 2:235–241.
- Schlatter RP, Matte U, Polanczyk CA, Koehler-Santos P, Ashton-Prolla P. 2015. Costs of genetic testing: supporting Brazilian public policies for the incorporating of molecular diagnostic technologies. Genet Mol Biol. 38(3):332–337. doi:10.1590/S1415-475738320140204.
- Spaulding BW. 2009. Early detection can help eradicate invasive mussels. J Am Water Works Ass. 101(11):19–20. doi:10.1002/j.1551-8833.2009.tb09977.x.
- Stanislawczyk K, Johansson ML, MacIsaac HJ. 2018. Microscopy versus automated imaging flow cytometry for detecting and identifying rare zooplankton. Hydrobiologia. 807(1):53–65. doi:10.1007/s10750-017-3382-1.
- Taberlet P, Coissac E, Hajibabaei M, Rieseberg LH. 2012. Environmental DNA. Mol Ecol. 21(8):1789–1793. doi:10.1111/j.1365-294X.2012.05542.x.
- Thorpe JH, Rogers DC. 2010. Field guide to freshwater invertebrates of North America. Boca Raton, FL: Academic Press; 304p.
- Trebitz AS, Hoffman JC, Darling JA, Pilgrim EM, Kelly JR, Brown EA, Chadderton WL, Egan SP, Grey EK, Hashsham SA, et al. 2017. Early detection monitoring for aquatic non-indigenous species: optimizing surveillance, incorporating advanced technologies, and identifying research needs. J Environ Manage. 202(Pt 1):299–310. doi:10.1016/j.jenvman.2017.07.045.
- Vander Zanden MJ, Hansen GJA, Higgins SN, Kornis MS. 2010. A pound of prevention, plus a pound of cure: early detection and eradication of invasive species in the Laurentian Great Lakes. J Great Lakes Res. 36(1):199–205. doi:10.1016/j.jglr.2009.11.002.
- Wang C, Wu X, Tian C, Li Q, Tian Y, Feng B, Xiao B. 2015. A quantitative protocol for rapid analysis of cell density and size distribution of pelagic and benthic Microcystis colonies by FlowCam. J. Appl. Phycol. 27:711–720. doi:10.1007/s10811-014-0352-0.
- Wassenaar LI, Rao YR. 2012. Lake Winnipeg: the forgotten great lake. J Great Lakes Res. 38:1–5. doi:10.1016/j.jglr.2012.04.004.
- Xia Z, Johansson ML, Gao Y, Zhang L, Haffner GD, MacIsaac HJ, Zhan A. 2018. Conventional versus real-time quantitative PCR for rare species detection. Ecol Evol. 8(23):11799–11807. doi:10.1002/ece3.4636.
- Zaiko A, Martinez JL, Ardura A, Clusa L, Borrell YJ, Samuiloviene A, Roca A, Garcia-Vazquez E. 2015. Detecting nuisance species using NGST: methodology shortcomings and possible application in ballast water monitoring. Mar Environ Res. 112(Pt B):64–72. doi:10.1016/j.marenvres.2015.07.002.
- Zhao J, Rao YR, Wassenaar LI. 2012. Numerical modeling of hydrodynamics and tracer dispersion during ice-free period in Lake Winnipeg. J Great Lakes Res. 38:147–157. doi:10.1016/j.jglr.2011.02.005.