
 ?Mathematical formulae have been encoded as MathML and are displayed in this HTML version using MathJax in order to improve their display. Uncheck the box to turn MathJax off. This feature requires Javascript. Click on a formula to zoom.
Abstract
Faridmarandi S, Khare YP, Naja GM. 2020. Long-term regional nutrient contributions and in-lake water quality trends for Lake Okeechobee. Lake Reserv Manage. XX:XXX–XXX.
A long-term dataset was used to investigate the historical regional changes in Lake Okeechobee water quality from water year 1974 to 2018. During this period, the total phosphorus (TP) load from the northern region to the lake remained statistically stable while the in-lake TP concentrations showed a statistically significant increasing trend, despite decades of state plans to restore this ecosystem. During the investigated period of record, the inflow TP flow weighted mean concentration from the southern region had a slightly higher value of 0.191 mg/L (when compared to the northern region) with a statistically significant increasing trend. The average annual total nitrogen unit area inflow loading (678.6 kg/km2) and flow weighted mean concentration (4.35 mg/L) into Lake Okeechobee from the southern region had the highest levels when compared to other regions. Lake Okeechobee TP sedimentation rate showed a statistically significant decreasing trend indicating a reduction in the capacity of the lake sediments to assimilate phosphorus. Results showed that the lake sediments may become a continuous source of phosphorus in water year 2035. Sustained and long-term efforts on the scale of decades will be required for restoring the lake using a multipronged approach consisting of mainly the implementation of nutrient/fertilizer best management practices and the construction of ∼200 km2 of constructed wetlands for a total project cost of US$4.26 billion. Unless a proven cost-effective technology is developed to tackle the legacy TP problem in the lake sediments, a prioritization of state resources is required while focusing on Lake Okeechobee watershed.
Anthropogenic nitrogen and phosphorus inputs to aquatic ecosystems, mainly originating from agriculture and urban development, have been widely recognized as the main cause of eutrophication of waterbodies (Carpenter et al. Citation1998, Conley et al. Citation2009, Azevedo et al. Citation2015). In 2008–2009, approximately half of the rivers and streams in the United States were reported to be impaired due to excess nutrients and related biological growth (United States Environmental Protection Agency [USEPA] Citation2017). Lake Okeechobee in South Florida, one of many impaired aquatic ecosystems, has been heavily impacted by human actions for decades and it faces major issues, including excessive total phosphorus (TP) loads, extreme water-level fluctuations, and rapid spread of exotic and nuisance plants (Havens et al. Citation2005a). The natural hydrological function, water quality, and ecology of the lake have been dramatically altered, impacting entire ecosystems to the east and west (northern estuaries) and the south (the Everglades). Failure to effectively restore the lake adversely affects the environmental health of the lake, the downstream wetland systems, and the northern estuaries that either rely on or are affected by water deliveries from the lake. Since the 1970s, legislative actions and plans have been developed to improve Lake Okeechobee water quality, such as the Surface Water Improvement and Management Act in 1989, the Lake Okeechobee Protection Act in 2000, and the Basin Management Action Plan (BMAP) in 2014, but major challenges still exist (South Florida Water Management District [SFWMD] Citation2011, Khare et al. Citation2019). The external TP loadings to Lake Okeechobee (average of 633 Mg/yr for water year [WY] 2014–2018; megagram [Mg] unit is defined as 1000 kg) are greatly exceeding the TP total maximum daily load (TMDL) goal of 140 Mg/yr for sustaining a healthy ecosystem in the lake and for meeting the in-lake target TP concentration of 0.04 mg/L in the pelagic zone (SFWMD Citation2011).
Assessing the progress of any restoration program is essential to gain a clear understanding of the implementation successes and to continuously update the effectiveness of the projects (Khare et al. Citation2012). Such assessment would not be possible without an in-depth investigation of spatial and temporal data while identifying the major sources of nutrients for any aquatic ecosystem. Mechanistic and empirical modeling (Havens and Walker Citation2002, Jin et al. Citation2007, James and Pollman Citation2011) as well as monitoring data analysis (James et al. Citation1995, McCarthy et al. Citation2009, Beaver et al. Citation2013) approaches have been used to study Lake Okeechobee water quality and have greatly contributed to our understanding of underlying biogeochemical processes and relationships. While modeling is a useful tool for plan formulation, temporal data analyses enable managers to assess progress and impacts of implemented projects. Several earlier studies have conducted nutrient mass balance for Lake Okeechobee and analyzed water quality temporal trends (Janus et al. Citation1990, James et al. Citation1995, Havens and Gawlik Citation2005, Havens and James Citation2005, James et al. Citation2011, Zhang et al. Citation2011). However, these studies used relatively shorter temporal records and no analysis was conducted after WY2007. Moreover, none of these studies attempted to explore the directional/regional aspect (north–east–south–west) of inflows and outflows, thus ignoring the impacts of regional water management and implemented projects on Lake Okeechobee water quality. Because this is a dynamic ecosystem, a comprehensive and up-to-date study is necessary for Lake Okeechobee restoration management progress assessment. Combining lake mass balance and temporal trend analyses approaches with a spatial dimension would provide an accurate assessment of the progress toward meeting the Lake Okeechobee water quality target and for identifying the nutrient loading sources.
The objectives of this study are to develop water and nutrient budgets for Lake Okeechobee considering inflow–outflow directions, that is, north, south, east, and west, for a long period of record (POR) from 1973 to 2018. The annual and seasonal variations in water, nutrient loads, and nutrient concentrations of the inflows and outflows by regions within the watershed were evaluated. Long-term trend analysis of nutrient loadings and concentrations flowing into and from the lake considering inflow–outflow directions was also conducted. Moreover, an in-lake water quality assessment including evaluating a long-term nutrient concentrations trend was conducted to determine the classification of the lake trophic state. These analyses may enable decision makers to assess the impacts and progress of the restoration programs that have been implemented to restore the lake since 1989. Lake Okeechobee is one of many shallow and culturally eutrophic lakes facing environmental and socioeconomic challenges common to waterbodies around the world. As such, the present approach serves as a model to assess restoration success for similar systems threatened by excessive nutrient loadings.
Study site
Lake Okeechobee is located at 27°N and 81°W with a surface area of 1730 km2 () and has been classified as shallow with mean and maximum depths of 2.7 m and 5 m, respectively (Havens et al. Citation2005b). The lake is critical for flood control during the wet seasons and provides water supply to urban areas, agriculture, and downstream ecosystems during the dry seasons (Havens and James Citation2005). The lake also supports sport fisheries and various recreational activities, and provides habitat for a large population of wildlife. The subtropical climate in this region has a distinct wet season (June through October) with higher rainfall (75 cm/yr) and a dry season (November through May) with lower rainfall (41 cm/yr; Abtew and Ciuca Citation2018). The hydrology of the lake is mainly human regulated (Schelske Citation1989) and groundwater components are known to be negligible (Kirby et al. Citation1994).
Figure 1. The state of Florida, Lake Okeechobee, and Lake Okeechobee watershed maps. The northern region includes the Upper and Lower Kissimmee, Taylor Creek/Nubbin Slough, Lake Istokpoga, Indian Prairie, and Fisheating Creek basins. The eastern region includes the eastern Lake Okeechobee and L8 basins. The western region includes Nicodemus Slough and the East Caloosahatchee basin. The southern region includes the S4 basin and the northern basin of the Everglades Agricultural Area (EAA).
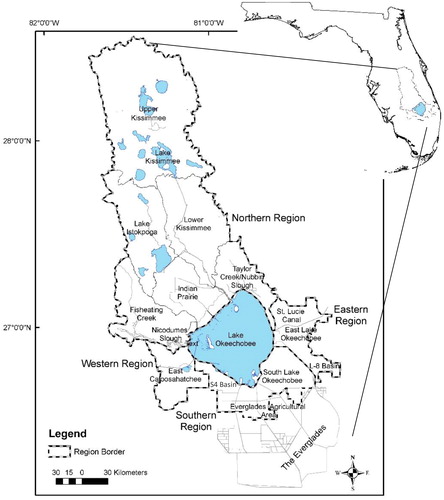
Lake Okeechobee inflows from the northern region of the lake originate from 6 tributaries, including Lake Kissimmee and Lake Istokpoga. Inflows from the eastern region are from the L-8 basin and from the reverse flow from St. Lucie Canal. Inflows from the western region originate from the Nicodemus Slough and reverse flows from the Caloosahatchee River. Inflows from the southern region include reverse flows and back-pumping (referred to in the rest of the article as back-pumping) mainly from the Everglades Agricultural Area (EAA) and from the S4 basin (, SFWMD Citation2018). Currently, back-pumping from the southern region is still occurring for flood control during extreme weather events. In the past 5 yr (WY2014–WY2018), reverse flows from the southern watershed ranged from 28 to 252 million m3/yr.
Nutrients (dissolved and suspended) enter the lake via different pathways, including surface water runoff from the surrounding watersheds, atmospheric deposition, and internal nutrient releases (i.e., decomposing plant material and sediment resuspension). The nutrient levels in surface water runoff reaching the lake are directly linked to land use and land management practices within its watershed (Boggess et al. Citation1995, He et al. Citation2014). Agricultural land use (mainly improved pastures, sugarcane, and citrus groves) accounts for 50% of the lake watershed area, followed by natural areas including wetlands, forests, and waterbodies occupying 37% of the watershed (SFWMD Citation2018). Improved pastures have a relatively low TP load per area but are the largest land use (20% of the area) and thus are the highest TP load contributor in the watershed. On the other hand, dairies and row crops occupy only 4% of the watershed area but they represent a considerable source of TP to the lake (Hiscock et al. Citation2003). As a result of the high nutrient loading to the lake and throughout the last decades, the lake transitioned from a sandy bottom and macrophyte-dominated meso-eutrophic waterbody to a phytoplankton-dominated, eutrophic lake overlain by organic mud (Stoermer et al. Citation1992, Brezonik and Engstrom Citation1998). This long-term high TP loading has resulted in phosphorus accumulation in the lake sediments (Havens and Gawlik Citation2005).
Materials and methods
Data
The analyses in our study were based on a water year (WY) time period, commonly used in South Florida to cover the annual distinct wet and dry seasons (May 1 to April 30 of every year; Hagerthey et al. Citation2014). Lake Okeechobee long-term water quality, inflows into the lake, and outflows from the lake were evaluated for the last 45 WYs (WY1974–WY2018). The Lake Okeechobee watershed was divided into 4 regions based on their locations and flow directions (Florida Department of Environmental Protection [FDEP] Citation2014): North, East, West, and South (). Flow and nutrient concentration data from 38 stations around the lake and from 8 in-lake monitoring stations (Table S-1) were downloaded from DBHYDRO, the South Florida Water Management District (SFWMD) environmental database (SFWMD Citation2018). Daily measurements of water flow into or out from Lake Okeechobee and monthly or biweekly grab and time-composite autosampler measurements of TP and total nitrogen (TN) concentrations were obtained for all the monitoring stations. At each Lake Okeechobee inflow and outflow structure, daily nutrient loads were calculated by multiplying daily flows and corresponding concentrations. Concentrations for dates between measured samples were estimated using a linear interpolation. Grab and autosampler data were used in the calculations, with autosampler data used preferentially on dates when both grab and autosampler data are available (Havens and James Citation2005).
Measurements of lake stages (NGVD 1929), color, chlorophyll a, and total alkalinity were also obtained from DBHYDRO for the 8 in-lake stations. Detailed record of hydro-meteorological data of rainfall and evapotranspiration were accessed from the National Climatic Data Center (NCDC) of National Oceanic and Atmospheric Administration (NOAA; Citation2018) and DBHYDRO. Daily rainfall data from 18 weather stations (Figure S-1) surrounding the lake were summed to obtain annual values and were then averaged spatially using the Thiessen polygon method to yield average annual rainfall values across the lake. Lake area and water volume were determined from the stage-area-capacity curves developed by the United States Army Corps of Engineers (USACE; Citation1978). Atmospheric TP and TN deposition were estimated as constant annual rates of 35 Mg/yr and 1233 Mg/yr, respectively (Pollman et al. Citation2002, Havens and James Citation2005, James et al. Citation2006).
Water budget
The water budget was calculated as
(1)
(1)
where
is the net change in lake water volume observed during 1 WY, Rain is the spatially averaged precipitation over the lake during 1 WY, ET is the evapotranspiration averaged over the lake during 1 WY, ΣSurface Inflow is the sum of surface water flowing into the lake via the monitored structures during 1 WY, and ΣSurface Outflow is the sum of the water discharged from the lake via the monitored structures during 1 WY. The units of all water budget terms in Equationequation 1
(1)
(1) were expressed in million m3/yr. Error is the net error for each WY and represents uncertainty due to measurement errors, temporal and spatial sampling resolution, seepage, and missing values (Franceschini and Tsai Citation2010). The proportional error in the water budget was also calculated by dividing the net error by the mean lake volume.
In the present article, ET of the open water (permanently submerged) area of the lake was calculated as the potential ET. The ET of the lake littoral zone (marshes to the west and south of the lake) was estimated by multiplying the computed potential ET by the crop coefficient (kc) using the single crop coefficient approach. Indeed, when the lake stages fall below 3.4 m, the entire littoral zone becomes dry (Havens and Gawlik Citation2005) and in that case, moisture availability becomes a limiting factor and the area has a reduced ET. The estimated value of kc for wetlands with no frost condition was 0.6 (Allen et al. Citation1998). The stage-area-capacity curves for the lake were used to determine the extent of the dry and submerged areas (SFWMD Citation2007).
Nutrient budget
The lake TP and TN budgets were determined following the methodology described in James et al. (Citation1995) and Havens et al. (Citation2005a). The net sedimentation coefficient (σ, 1/yr) for TP was calculated following Equationequation 2(2)
(2) :
(2)
(2)
where Min is the yearly mass of TP entering the lake at the inflow structures and from atmospheric deposition, and Mout is the yearly mass leaving the lake at the outflow structures. The average annual lake mass (Mlake) was calculated from the interpolated daily in-lake TP concentrations multiplied by the lake volume. Year-to-year changes in lake mass (ΔMlake) were based on the first and last day water year values. All nutrient budget terms were expressed in Mg/yr.
Equations S-1 to S-9 in the Supplement report the approach used to calculate the Trophic State Index (TSI), applicable to Florida conditions (Carlson Citation1977, Paulic et al. Citation1996).
Trend analysis
The nonparametric Mann–Kendall test, which is independent of variable distribution (Helsel and Hirsch Citation2002), was used to assess the trend in Lake Okeechobee nutrient loadings and flow weighted mean concentrations (FWMCs). Because of the long dataset (45 yr) and the presence of 2 seasons, an annual scale Mann–Kendall test was preferred over the seasonal Kendall trend test (Yu et al. Citation1993, Sicard et al. Citation2011, Kisi and Ay Citation2014). The same statistical test was used to determine the trend in the in-lake nutrient concentrations and net TP sedimentation rate. Sen’s slope estimator is a nonparametric procedure to estimate the slope of a trend (Gocic and Trajkovic Citation2013). Considering the distinct climatic seasonality (dry–wet) and its impact on Lake Okeechobee management, trends were also assessed separately for the dry and wet seasons.
The change point detection algorithm developed by Sullivan and Woodall (Citation2000) and based on the likelihood ratio statistic testing was used to determine breakpoints and changes in flows, nutrient concentrations, and loads to the lake. One-way analysis of variance (ANOVA) was employed to test for a significant variation in values (following a normal distribution after log transforming the data) between periods of pre and post abrupt change. This analysis was mainly conducted to detect breakpoints in back-pumping data from the southern region. Indeed, prior to 1979, runoff from almost one-third of the southern region (mainly from the EAA) was back-pumped into Lake Okeechobee. In the early 1980s, in an effort to reduce TN and TP loadings to the lake, the decision was made to divert the southern region runoff southward to the Everglades under the Interim Action Plan (SFWMD Citation2002). Under this plan, this runoff could be discharged into the lake under emergency conditions for water supply and flood control purposes. Back-pumping water from the southern region to the lake to meet water supply demands continued to occur during the dry periods, when the lake stages dropped by the end of the wet season, to guarantee water for the EAA in the spring (SFWMD Citation2002, Faridmarandi and Naja Citation2014). This practice of back-pumping for water supply was discontinued by SFWMD in 2006–2007 (SFWMD Citation2016). However, back-pumping for flood control is still occurring during extreme wet years/events when rain south of the lake threatens to flood the southern watershed.
All statistical tests were performed at a 5% significance level (α = 0.05) except for the Mann–Kendall test, where significance was also evaluated at 2 additional levels (α = 0.1 and α = 0.01) to classify trends into not significant (–), weakly significant (*), moderately significant (**), and strongly significant (***; Chang Citation2008, Khare et al. Citation2012, Anghileri et al. Citation2014). All statistical analyses were performed in R using the Trend package developed by Pohlert (Citation2015) and SAS software (www.sas.com).
Results
Water budget
The average annual inflow (surface flow and rainfall) to Lake Okeechobee (WY1974–2018) was ∼4606.7 ± 235.1 (±1 standard error) million m3/yr, while the average outflow was ∼4201.5 ± 193.2 million m3/yr (Table S-2). The average proportional error term was 0.1 with a statistically significant decreasing trend over time (***, Sen’s slope of −0.0015) attributed to improvement in the accuracy and precision of flow measurements and rating curves (James et al. Citation1995). During the investigated POR, the long-term water budget analysis of the lake indicated that the average annual surface inflow (2671.2 ± 200.1 million m3/yr) was higher than the surface outflow (1846.6 ± 164.6 million m3/yr; Table S-2). Rainfall averaged 42.0% of the total annual water input. ET averaged 56.0% of the total annual water output and represented 51.0% of the total annual input (Table S-2). Thus, about half of the water flowing into the lake was lost to ET. While the ET value (2355.0 ± 28.6 million m3/yr) was higher than rainfall (1935.5 ± 53.0 million m3/yr), a higher surface inflow value resulted in an estimated net volume difference of 405.2 ± 170.0 million m3/yr, with an average annual stage of 4.3 m NGVD (during the investigated POR).
During the POR, the northern region contributed 86.4% of surface inflows to the lake, while 7.7% and 4.9% of inflows were attributed to the southern and eastern regions, respectively (Figure S-2A). The change-point detection test identified WY1986 as a breakpoint in the back-pumping flow data from the southern region. Before WY1986, surface inflows from the southern region accounted for more than 15.0% of the total inflows to the lake. During the POR, the western, southern, and eastern regions received approximately 41.1% (759.7 ± 103.9 million m3/yr), 36.3% (670.3 ± 48.1 million m3/yr), and 22.1% (409.0 ± 54.1 million m3/yr) of the total surface outflows from Lake Okeechobee, respectively (Figure S-2B).
Nutrient budget
The surface inflow and outflow TP loadings followed the same pattern (Figures S-2C and S-2D), with 87.4% and 7.8% of the total TP loadings into the lake originating from the northern and southern regions during the POR. The contributions from the northern and southern regions to the TN loadings to the lake were 73.0% and 20.9%, respectively (Figure S-2E). Before 1986, surface TP and TN inflow loadings into the lake from the southern region accounted for more than 12.0% and 37.0% of the total TP and TN inflow loadings to Lake Okeechobee, respectively. The eastern and western regions received 65.0% and 63.0% of the total TP and TN surface loadings from the lake, respectively (Figures S-2D and S-2F). The remaining TP and TN loadings were discharged to the south.
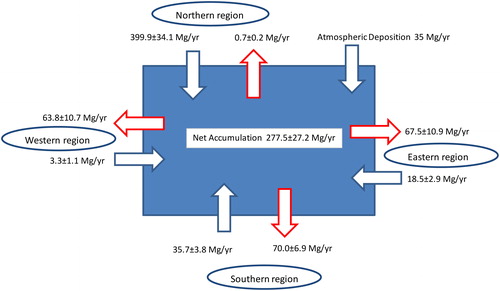
A 45-yr TP mass balance revealed an average annual lake mass of 493.4 ± 29.9 Mg/yr and mean annual input and output values of 495.5 ± 35.2 Mg/yr (from surface inflows and atmospheric deposition) and 202.1 ± 24.6 Mg/yr, respectively (Table S-3). Those values are in agreement with Havens and James (Citation2005), reporting average annual lake mass, input, and output values of 415, 499, and 174 Mg/yr, respectively, based on the mass balance conducted from 1973 to 2002. In the present study, the lake average net TP sink was 277.5 ± 27.5 Mg/yr (, 56% of input), in agreement with the 297 Mg/yr value reported by Havens and James (Citation2005) as the average annual TP loading accumulation in the sediments when examining the lake mass balance from 1973 to 2002. When quantifying the average annual TP accumulation in the sediments before WY1986, this value was 405.9 Mg/yr, to be compared to Janus et al. (Citation1990) reporting a total of 428 Mg/yr as the average annual TP loading accumulation in the sediments when examining the lake mass balance from 1974 to 1987.
Figure 2. Lake Okeechobee average annual TP budget (Mg/yr) with the (±) standard error. The blue and red arrows represent the TP inflow and outflow loadings to the lake from the different regions, respectively.
Water quality trend analysis
Total phosphorus: Inflows and outflows
The TP inflow loadings from the western region were relatively small (not exceeding 1% of the total TP inflow loading to the lake) when compared to the other watersheds with no considerable year-to-year change except a high value in WY2012, mainly driven by very wet events in the western region during the summer of 2011 (Figure S-3A). TP inflow loadings from the eastern region increased from WY1980 with a spike in WY2008. The TP inflow loadings from the southern region remained relatively stable and high from WY1974 to WY1986 (Figure S-3A), while the overall trend from WY1974 to WY2018 was significantly decreasing (, ***, Sen’s slope of −0.86 Mg/yr). The decline in inflow TP loading from the southern region coincided with a similar statistically significant decline in surface inflow (***, Sen’s slope of −7.6 million m3/yr) and an increasing statistically significant trend in TP inflow FWMC from the southern region (, ***, Sen’s slope of +0.002 mg/L/yr).
Table 1. Mann–Kendall trend test results for the annual (water year) and seasonal (wet and dry seasons) trend analysis of inflow, outflow, TN and TP loads, TN and TP flow weighted mean concentrations, and in-lake TN and TP concentrations for WYs1974–2018 (–: not significant, *: weakly significant, **: significant, ***: strongly significant).
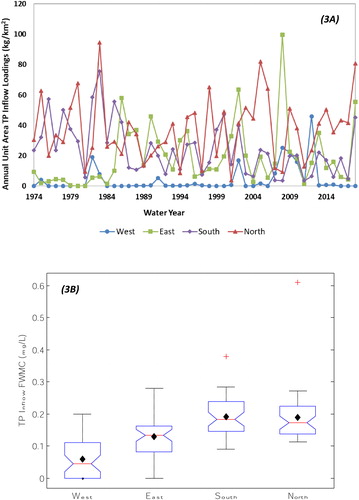
In order to take into account the area of the watershed, the average annual TP unit area inflow loadings (UAILs) are plotted in . UAILs were calculated by dividing the surface TP inflow loading from a region by its corresponding area (826 km2, 10,701 km2, 967 km2, and 1469 km2 for the western, northern, eastern, and southern regions, respectively). Year-to-year changes in TP UAIL from the northern region (average of 35.1 ± 3.7 kg/km2) were comparable in magnitude to those for the southern region (average of 29.1 ± 3.3 kg/km2) from WY1974 to WY2003. After WY2003, the TP UAIL from the northern region (average of 42.1 ± 5.7 kg/km2) reached higher values than that for the southern region (average of 14.8 ± 2.9 kg/km2). The decrease in the UAIL from the southern region after WY2003 was probably due to decrease in back-pumping flows. UAIL from the western watershed of the lake remained low when compared to other regions (average of 4.0 ± 0.7 kg/km2). UAIL from the eastern watershed (average of 19.2 ± 2.6 kg/km2) gradually increased from WY1974 to WY2018 with a statistically significant trend (; *, Sen’s slope of +0.0003 kg/km2/yr).
Figure 3. (A) Average annual TP unit area inflow loadings to the lake by region calculated by dividing the surface TP inflow loading from a region by its corresponding area. (B) Box plots showing the mean (designated by a diamond), median, minimum, maximum, and 25th and 75th percentiles of the POR average TP inflow flow weighted mean concentration (FWMC) by region. The (+) signs indicate statistical outliers.
TP outflow loadings (to the eastern, western, and southern regions) showed a significant increasing trend (Figure S-3B and ) during the POR (***, Sen’s slope of +5.4 Mg/yr). The TP outflow loading during the dry season was significantly higher than during the wet season southward (ANOVA analysis: F(1, 88) = 10.24, P < 0.002), attributed to significantly higher surface outflow (ANOVA analysis: F(1, 88) = 10.75, P < 0.002) during the dry season for agricultural irrigation.
The inflow TP FWMC from the southern region had a slightly higher average value during the POR (; average value of 0.191 ± 0.009 mg/L) compared to the northern region (; average value of 0.189 ± 0.012 mg/L). However, TP inflow FWMC from the southern region showed a statistically significant increasing trend (Figure S-3C and , ***, Sen’s slope of +0.002 mg/L/yr).
Total nitrogen: Inflows and outflows
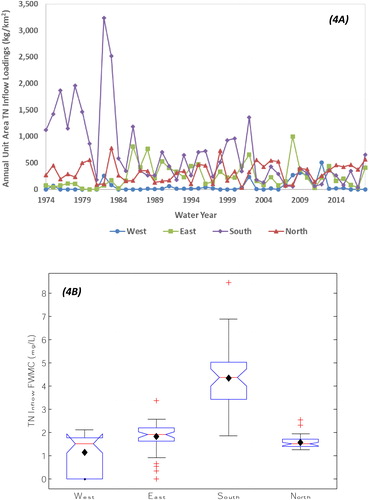
During the POR, the average annual TN UAIL and FWMC into Lake Okeechobee from the southern region were the highest when compared to other regions ( and S-3D). The TN UAIL from the southern region averaged 1378.0 ± 250.0 kg/km2 from WY1974 to WY1986, whereas the TN loading averaged 312.9 ± 60.0 kg/km2 from the northern region for this period. From WY1987 to WY2018, the TN UAIL from the southern region averaged 394.4 ± 60.0 kg/km2, whereas the loading averaged 330.7 ± 30.0 kg/km2 from the northern region for the same period (). TN inflow loadings from the south during the POR exhibited a statistically significant decreasing trend (, ***, Sen’s slope of −40.3 Mg/yr), whereas the TN inflow loadings from the northern region did not show any statistically significant trend (–, Sen’s slope of +24.6 Mg/yr). During the investigated POR, the TN FWMC inflow from the south had the highest level (averaging 4.35 ± 0.20 mg/L) when compared to other regions (), with a significant decreasing trend (, ***, Sen’s slope of −0.05 mg/L/yr). TN inflow FWMC from the northern region showed a weakly significant decreasing trend (*, Sen’s slope of −0.08 mg/L/yr).
Figure 4. (A) Average annual TN unit area inflow loadings by region. (B) Box plots showing the mean (designated by a diamond), median, minimum, maximum, and 25th and 75th percentiles of the POR average TN inflow flow weighted mean concentration (FWMC) by region. The (+) signs indicate statistical outliers.
In-lake water quality
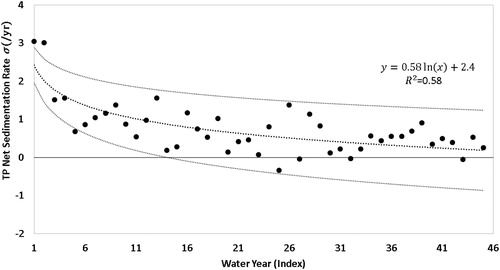
The Lake Okeechobee TP net sedimentation coefficient (rate) during the POR showed a strongly significant decreasing trend (, ***, Sen’s slope of −0.02/yr2). TP accumulated in the sediments at a higher rate before WY1986 and then the accumulation slowed down (). WYs 1998, 2000, 2005, and 2016 with a negative net sedimentation indicated that the lake sediments were a net source of TP during these years, coinciding with years when major hurricanes happened (October 1999, August–September 2004, October 2005 and 2016). Based on the fitted logarithmic trend line (R2 = 0.58), the lake sediments would become a permanent source of P in WY2035, when the trend line would cut the horizontal axis. A detailed characterization of the lake sediments is required to more accurately represent the time to P saturation based on the overall lake conditions and to determine the impact of reducing the TP inflow levels on delaying time to saturation.
Figure 5. Net sedimentation rate calculated from the TP budget with the logarithmic trend line and its 95% confidence intervals. X-axis represents water years, with 1 corresponding to WY1974.
The Florida Department of Environmental Protection (FDEP) established the 0.04 mg/L in-lake concentration geometric mean target for TP in the pelagic zone of the lake during the TMDL development process to meet the lake designated use (Federico Citation1981, Havens and Walker Citation2002). Because of the high nutrient levels in water reaching the lake, the average annual geometric mean TP concentration in the water column increased (***, Sen’s slope of +0.002 mg/L/yr) from ∼0.04 mg/L in WY1974 to ∼0.18 mg/L in WY2018 (). During the investigated POR, the TP concentration of the lake water had a monotonic increase, implying that the system has not attained a steady state ().
Figure 6. WY annual geometric mean of TP and TN concentrations in the pelagic region of Lake Okeechobee. Data are based on values from 8 monitoring stations in the lake. The upper and lower limits for TN concentrations are also represented according to Rule 62-302 F.A.C.
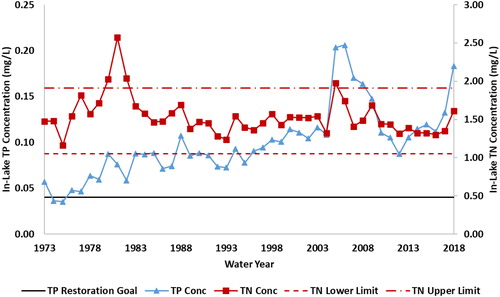
Regarding TN, according to Rule 62-302 F.A.C. (State of Florida Citation2018) for lakes with a long-term geometric mean color ≤40 PCU and CaCO3 levels ≥20 mg/L, the lower and upper limits of the annual geometric mean of TN are set at 1.05 mg/L and 1.91 mg/L, respectively. The annual geometric mean of ambient TN concentration remained mainly within those criteria bounds except for WYs 1980 to 1982 (very wet years) and hurricane Wilma in 2005 ().
The TSI results indicate an increased rate of Lake Okeechobee eutrophication from WY1974 to the present, with TSI values above 60 for 37 yr since 1975 (Figure S-4B). Indications of this eutrophication include (1) a statistically significant increase in the in-lake TP concentration ( and , ***, Sen’s slope of +0.002 mg/L/yr) and (2) an increase in the dominance of cyanobacteria following shifts in the TN:TP ratio (Figure S-4A).
Water back-pumped into the lake from the southern region
Back-pumping water from the southern region discharged water into the lake with different physicochemical characteristics when compared to lake water. The long-term average annual TP FWMC of back-pumped water was 0.191 ± 0.009 mg/L (; minimum of 0.09 mg/L and maximum of 0.38 mg/L), while the long-term average annual in-lake TP concentration was ∼0.10 ± 0.01 mg/L () and the TP FWMC of surface outflow from the lake southward was 0.11 ± 0.01 mg/L. The long-term average annual TN FWMC of back-pumping water averaged ∼4.35 ± 0.20 mg/L (; minimum of 1.84 mg/L and maximum of 8.45 mg/L), while the long-term average annual in-lake TN concentration was ∼1.54 ± 0.04 mg/L () and TN FWMC of surface outflow southward was ∼1.76 ± 0.06 mg/L during the investigated POR.
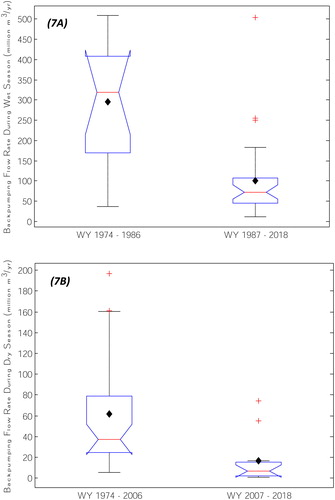
A change-point detection test was performed to determine breakpoints in the back-pumping flow data from the southern region. The differences between the 2 group means (pre and post) were statistically significant by using ANOVA during both dry and wet seasons. WY1986 was detected as a breakpoint year during the analysis of back-pumping flow during the wet season, resulting in 2 periods (): pre-1986 and post-1986 (ANOVA analysis: F(1, 43) = 22.71, P < 0.0001). This first decline followed the Interim Action Plan (SFWMD Citation2002). WY2006 was detected as a second breakpoint year during the analysis of back-pumping flow data during the dry season, resulting in 2 periods (): pre-2006 and post-2006 (ANOVA analysis: F(1, 43) = 27.36, P < 0.0001). This decline happened after the practice of back-pumping for water supply was discontinued by SFWMD in 2006–2007 (SFWMD Citation2016). Back-pumping for flood control is still occurring during extreme wet years/events. During WY2018, 66.4 Mg of TP and 958.1 Mg of TN were back-pumped into the lake. During the investigated POR and on average, back-pumped volumes during the dry season accounted for ∼31% of the wet season back-pumping volumes and had a positive correlation with rainfall during the dry season (R2 = 0.71). After WY2006, this correlation increased to 0.93, indicating that back-pumping was limited to rain events.
Figure 7. Box plots showing the mean (designated by a diamond), median, minium, maximum, and 25th and 75th percentiles comparing the back-pumping flow rates (A) during the wet seasons pre and post WY1986, and (B) during the dry seasons pre and post WY2006. The (+) signs indicate statistical outliers.
Assuming the lake as a control volume with a perfectly mixed system, the Lake Okeechobee watershed contribution to the accumulated TP in the lake sediments was calculated and estimated at ∼37,750 Mg (ranging from 30,600 to 44,900 Mg) from WY1950 to 2018. Based on the present mass balance, the TP loading accumulated in the lake sediments from WY1974 to 2018 was ∼12,000 Mg. In order to estimate the anthropogenic contribution to the lake sediments from WY1950 to 1974, Brezonik and Engstrom (Citation1998), Fisher et al. (Citation2001), and Yan et al. (Citation2014) were used to assess the TP content in the lake sediments in 1988 (ranging from 28,600 to 42,900 Mg) and in 1950 (∼5000 Mg). A perfectly mixed system assumption implied that each region’s contribution to the TP content in the sediments is similar to the region’s relative contribution to inflow TP loading. A curve fitting analysis of the relative TP loading from the southern region resulted in an exponential decay type curve (0.6394/e0.0316x, where x = WY − 1925; R2 = 0.33). With extrapolated (WY1950–1973) and measurement-based (WY1974–2018) TP contribution ratios the total contribution of the southern region back-pumping to the TP accumulated in lake sediments (WY1950–2018) was estimated at 6500 Mg (5000 to 8000 Mg), representing 17.1% (16.4 to 17.8%) of the total TP accumulated in the lake sediments in that period. With a similar approach, contributions from the northern subwatersheds Taylor Creek and Nubbin Slough, Fisheating Creek, Upper and Lower Kissimmee, and Indian Prairie were 43%, 7%, 20%, and 13%, respectively, of the total TP accumulated in the lake sediments from WY1950–2018.
Discussion
The earliest reports of algae blooms in Lake Okeechobee were in early 1970s, with scientists observing a shift in phytoplankton population from a green alga to cyanobacteria typical of eutrophic lakes. Since these early reports and throughout the years, legislature directed the state agencies to develop and implement plans aimed at decreasing the TP inputs to the lake. Despite several decades of actions and plans, a significant increasing trend was observed in the TP outflow loading from the lake while the TP inflow loading to the lake remained relatively stable. The high TP inflow loading had a direct impact on the in-lake water quality throughout the years. In the early 1970s, when the in-lake TP concentrations were about 0.04 mg/L, the lake water TN:TP mass ratios were above 30 (Janus et al. Citation1990) and the lake’s algal community was P-limited and dominated by diatoms (Havens and Schelske Citation2001, Havens et al. Citation2003). However, high phosphorus-laden discharge to the lake reduced the TN:TP ratios and created a situation of co-limitation in the late 1970s and early 1980s with TN:TP ratio between 10 and 30 (Paulic et al. Citation1996). When excessive P loading created a surplus supply of TP, TN became relatively limiting in supply (Havens et al. Citation2003). There has been a general decrease in TN:TP ratio over the past 45 yr, and TN:TP ratio decreased to below 10 in recent years, creating a system that is fluctuating between co-limited and N-limited states (Havens Citation1995). The gradual decline in the lake TN:TP ratio was attributed to a decreased TN:TP ratio in the inflow water (Havens et al. Citation2003) caused by the increase in TP inflow loadings. This situation favored the dominance of cyanobacteria that continue to proliferate and periodically result in surface blooms (James et al. Citation1995). P enrichment throughout the years was substantial, to such a level that phytoplankton growth is now limited by TN (Aldridge et al. Citation1995).
Nutrient inputs from the watershed are still the primary source driving the high TP levels in the lake, exacerbated by internal TP sources from the lake sediments. Lake Okeechobee watershed has been extensively altered. Throughout the last 100 yr, natural areas in Lake Okeechobee watershed have been drained for agricultural and urban development leading to an increase in the TP levels flowing into the lake from 0.03–0.04 mg/L to ∼0.20 mg/L (Soil and Water Engineering Technology [SWET] Citation2018). The last 5-yr (WY2014–2018) average TP inflow loadings are higher than the levels observed in WY1990s and 5.5 times higher than the TMDL goal, with no signs of decrease. The TP legacy built up in the soils of the watershed is an additional long-term TP source to inflow loadings to the lake. Reddy et al. (Citation2011) estimated that the TP legacy in the northern region is enough to sustain a 500 Mg/yr of TP loading to the lake for at least 22 to 55 yr even after complete curtailment of all other TP input sources to the watershed.
Lake Okeechobee internal TP sources are also contributing to the problem. Owing to the shallowness of the lake, major storm events are stirring the thick layer of lake sediments, creating a turbidity problem, and releasing some of the TP retained in the upper layer (Havens et al. Citation2001). During WYs 2005 and 2006, 4 major hurricanes (Charley, Francis, Jeanne, and Wilma) impacted Lake Okeechobee and released TP from the sediments into the water column, leading to high in-lake TP levels (). Long-term investigations have shown that if external TP loading to Lake Okeechobee decreased, the internal TP loading would last over a period of years to decades (Ahlgren Citation1978, Søndergaard et al. Citation2000, Jeppesen et al. Citation2005, Schelske et al. Citation2006).
TP net sedimentation coefficient decreased during the POR and we project that the lake sediments would become a permanent source of P in WY2035. We are already observing a negative net TP sedimentation rate during hurricane years, indicating that the lake sediments were a net source of TP during these years. This is not unique to Lake Okeechobee. Belmont et al. (Citation2009) showed that the sediments in Lake Istokpoga and the upper chain of lakes that drain into Lake Okeechobee were approximately 50 to 62% saturated with TP. The same authors (Belmont et al. Citation2009) also showed that Lake Istokpoga and the upper chain of lakes would become sources of TP in 7 to 25 yr under 0 to 25% inflow TP loading reductions. This additional internal TP source from the sediments will delay Lake Okeechobee restoration efforts by 12–31 yr from the point when inflow TP concentration reaches 0.04 mg/L (Reddy et al. Citation2011). Blasland Bouck and Lee Inc. (BBL; Citation2003), conducted a Lake Okeechobee sediment management feasibility study that screened and evaluated 36 sediment management options, including chemical treatment and dredging. With a cost of $3 billion and a 15 yr time frame for completion, dredging was deemed not effective, as this technology will not remove the upper flocculant layer of the sediments that will continue to release TP in the water column. Chemical treatment using alum was estimated at $493 million, would take 3 yr to complete, and would need to be repeated every 15 yr. Unless a proven cost-effective technology is developed to tackle the legacy P problem in the lake sediments (Reddy et al. Citation2011), a prioritization of state resources is required while focusing on the Lake Okeechobee watershed.
Sustained and long-term efforts on the scale of decades will be required for restoring the lake using a multipronged approach, mainly focusing on curbing the TP loadings from the watershed. Knowing that the TP legacy in the Lake Okeechobee watershed and in Lake Okeechobee sediments can become an additional TP source to the lake in the decades to come, a feasible watershed-based restoration plan should be implemented soon to curb the trend. Efforts to reduce TP loadings from the watershed will also increase the time for the lake sediments to reach the maximum saturation. Belmont el al. (Citation2009) demonstrated that if external loads of P are curtailed by 25, 50, or 75% in Lake Istokpoga, the sediments could theoretically act as sinks for P for a significantly longer period of time before complete saturation. A comprehensive sampling, testing, and analysis of the Lake Okeechobee sediments is needed to determine their sorption capacity and the impacts of TP inflow reduction on delaying their saturation.
From a management perspective, restoration success is mainly dependent on regional projects such as constructed wetlands during the first years of any restoration plan. The constructed wetlands should be located near Lake Okeechobee inflows to capture TP from the watershed before reaching the lake. Monitoring for changes in legacy TP in watershed soils is also essential to assess the success of the implementation of regulatory programs. Recently, Khare et al. (Citation2019) detailed a cost-effective approach to deal with the high nutrient loading flowing into Lake Okeechobee. In the watershed, a permit-based regulatory framework has to be implemented on farms along with innovative practices on specific hot spot areas. Furthermore, regional projects and constructed wetlands (∼200 km2) must be constructed to filter nutrients before reaching the lake. Those programs and technologies have been implemented in other South Florida regions and have been proven successful to decrease the TP loadings to sensitive ecosystems. Indeed, this restoration strategy using a combination of an enforceable regulatory program and constructed wetlands is currently being implemented successfully south of Lake Okeechobee to filter TP before reaching the remaining Everglades. At an overall cost of $1.8 billion, the state of Florida built 230 km2 of constructed wetlands to filter an average of 1413 million m3 of water while achieving a TP FWMC level of 0.024 mg/L at the outflow, based on WY2014–2018 values (SFWMD Citation2019). Using the same strategy north of the lake, Khare et al. (Citation2019) quantified the total cost of the most cost-effective plan to be around US $4.26 billion. The cost breakdown indicated that the 200 km2 constructed wetlands will be responsible for 94.8% (US $4.04 billion) of the total project cost, with a total TP removal of 267 Mg/yr. The total cost estimate is substantially greater than the state of Florida agencies funding appropriations and expenditures in this watershed. From October 1 2000 to September 30 2014, the state spent a total of around US$200 million for the Lake Okeechobee Watershed Protection Program (SFWMD Citation2014). A realistic estimate of the long-term total costs for reaching the Lake Okeechobee TMDL should be developed, appropriately discussed, documented, and presented to the legislature. Without adequate funding and regional projects to curb TP levels in the watershed, cyanobacterial bloom events will continue to be a problem. Once the TMDL reaching the lake is met by implementing constructed wetlands and a regulatory program in the watershed, it may take an additional 12–31 yr to reach the 0.04 mg/L in-lake restoration target (Reddy et al. Citation2011).
Supplemental Material
Download MS Word (836 KB)Acknowledgments
Any opinions, findings, conclusions, or recommendations expressed in this material are those of the authors and do not necessarily reflect the views of The Everglades Foundation.
References
- Abtew W, Ciuca V. 2018. South Florida hydrology and water management Chapter 2 South Florida environmental report. South Florida Water Management District, West Palm Beach, FL.
- Ahlgren I. 1978. Response of Lake Norrviken to reduced nutrient loading. Int Vereinigung theoretische angewandte Limnol. 20(2):846–850. doi:10.1080/03680770.1977.11896608.
- Aldridge FJ, Phlips EJ, Schelske CL. 1995. The use of nutrient enrichment bioassays to test for spatial and temporal distribution of limiting factors affecting phytoplankton dynamics in Lake Okeechobee, Florida. Ergebnisse der Limnologie. 45:177–190.
- Allen RG, Pereira LS, Raes D, Smith M. 1998. Crop evapotranspiration-Guidelines for computing crop water requirements-FAO Irrigation and drainage paper 56. FAO (Rome). 300(9):D05109.
- Anghileri D, Pianosi F, Soncini-Sessa R. 2014. Trend detection in seasonal data: from hydrology to water resources. J Hydrol. 511:171–179. doi:10.1016/j.jhydrol.2014.01.022.
- Azevedo LB, van Zelm R, Leuven R, Hendriks AJ, Huijbregts MAJ. 2015. Combined ecological risks of nitrogen and phosphorus in European freshwaters. Environ Pollut. 200:85–92. doi:10.1016/j.envpol.2015.02.011.
- Beaver JR, Casamatta DA, East TL, Havens KE, Rodusky AJ, James RT, Tausz CE, Buccier KM. 2013. Extreme weather events influence the phytoplankton community structure in a large lowland subtropical lake (Lake Okeechobee, Florida, USA). Hydrobiologia. 709(1):213–226. doi:10.1007/s10750-013-1451-7.
- Belmont MA, White JR, Reddy KR. 2009. Phosphorus sorption and potential phosphorus storage in sediments of Lake Istokpoga and the Upper Chain of Lakes, Florida, USA. J Environ Qual. 38(3):987–996. doi:10.2134/jeq2007.0532.
- Blasland Bouck and Lee Inc (BBL). 2003. Lake Okeechobee sediment management feasibility study. South Florida Water Management District, West Palm Beach, FL.
- Boggess CF, Flaig EG, Fluck RC. 1995. Phosphorus budget-basin relationships for Lake Okeechobee tributary basins. Ecol Eng. 5(2–3):143–162. doi:10.1016/0925-8574(95)00022-4.
- Brezonik PL, Engstrom DR. 1998. Modern and historic accumulation rates of phosphorus in Lake Okeechobee, Florida. J Paleolimnol. 20(1):31–46. doi:10.1023/A:1007939714301.
- Carlson RE. 1977. A trophic state index for lakes. Limnol Oceanogr. 22(2):361–369. doi:10.4319/lo.1977.22.2.0361.
- Carpenter SR, Caraco NF, Correll DL, Howarth RW, Sharpley AN, Smith VH. 1998. Nonpoint pollution of surface waters with phosphorus and nitrogen. Ecol Appl. 8(3):559–568. doi:10.1890/1051-0761(1998)008[0559:NPOSWW]2.0.CO;2.
- Chang H. 2008. Spatial analysis of water quality trends in the Han River basin, South Korea. Water Res. 42(13):3285–3304. doi:10.1016/j.watres.2008.04.006.
- Conley DJ, Paerl HW, Howarth RW, Boesch DF, Seitzinger SP, Havens KE, Lancelot C, Likens GE. 2009. Ecology. Controlling eutrophication: nitrogen and phosphorus. Science. 323(5917):1014–1015. doi:10.1126/science.1167755.
- Faridmarandi S, Naja GM. 2014. Phosphorus and water budgets in an agricultural basin. Environ Sci Technol. 48(15):8481–8490. doi:10.1021/es500738v.
- Federico AC. 1981. Lake Okeechobee water quality studies and eutrophication assessment. South Florida Water Management District, West Palm Beach, FL.
- Fisher MM, Reddy KR, James RT. 2001. Long-term changes in the sediment chemistry of a large shallow subtropical lake. Lake Reserv Manage. 17(3):217–232. doi:10.1080/07438140109354132.
- Florida Department of Environmental Protection (FDEP). 2014. Basin management action plan for the implementation of total maximum daily loads for total phosphorus by the Florida Department of Environmental Protection in Lake Okeechobee. Tallahassee, FL: Florida Department of Environmental Protection.
- Franceschini S, Tsai CW. 2010. Assessment of uncertainty sources in water quality modeling in the Niagara River. Adv Water Resour. 33(4):493–503. doi:10.1016/j.advwatres.2010.02.001.
- Gocic M, Trajkovic S. 2013. Analysis of changes in meteorological variables using Mann-Kendall and Sen’s Slope estimator statistical tests in Serbia. Global Planet Change. 100:172–182. doi:10.1016/j.gloplacha.2012.10.014.
- Hagerthey SE, Cook MI, Mac Kobza R, Newman S, Bellinger BJ. 2014. Aquatic faunal responses to an induced regime shift in the phosphorus-impacted Everglades. Freshw Biol. 59(7):1389–1405. doi:10.1111/fwb.12353.
- Havens KE. 1995. Secondary nitrogen limitation in a subtropical lake impacted by non-point source agricultural pollution. Environ Pollut. 89(3):241–246. doi:10.1016/0269-7491(94)00076-P.
- Havens KE, Brady M, Colborn E, Gornak S, Gray S, James Rt JK-R, Mo C, O’Dell K, Patino J. 2005a. SFER Chapter 10: Lake Okeechobee Protection Program – State of the Lake and Watershed South Florida Environmental Report. South Florida Water Management District, West Palm Beach, FL.
- Havens KE, Fox D, Gornak S, Hanlon C. 2005b. Aquatic vegetation and largemouth bass population responses to water-level variations in Lake Okeechobee, Florida (USA). Hydrobiologia. 539(1):225–237. doi:10.1007/s10750-004-4876-1.
- Havens KE, Fukushima T, Xie P, Iwakuma T, James RT, Takamura N, Hanazato T, Yamamoto T. 2001. Nutrient dynamics and the eutrophication of shallow lakes Kasumigaura (Japan), Donghu (PR China), and Okeechobee (USA). Environ Pollut. 111(2):263–272. doi:10.1016/S0269-7491(00)00074-9.
- Havens KE, Gawlik DE. 2005. Lake Okeechobee conceptual ecological model. Wetlands. 25(4):908–925. doi:10.1672/0277-5212(2005)025[0908:LOCEM]2.0.CO;2.
- Havens KE, James RT. 2005. The phosphorus mass balance of Lake Okeechobee, Florida: implications for eutrophication management. Lake Reserv Manage. 21(2):139–148. doi:10.1080/07438140509354423.
- Havens KE, James RT, East TL, Smith VH. 2003. N: P ratios, light limitation, and cyanobacterial dominance in a subtropical lake impacted by non-point source nutrient pollution. Environ Pollut. 122(3):379–390. doi:10.1016/S0269-7491(02)00304-4.
- Havens K, Schelske C. 2001. The importance of considering biological processes when setting total maximum daily loads (TMDL) for phosphorus in shallow lakes and reservoirs. Environ Pollut. 113(1):1–9. doi:10.1016/s0269-7491(00)00235-9.
- Havens KE, Walker WW, Jr. 2002. Development of a total phosphorus concentration goal in the TMDL process for Lake Okeechobee, Florida (USA). Lake Reserv Manage. 18(3):227–238. doi:10.1080/07438140209354151.
- He ZL, Hiscock JG, Merlin A, Hornung L, Liu YL, Zhang J. 2014. Phosphorus budget and land use relationships for the Lake Okeechobee Watershed, Florida. Ecol Eng. 64:325–336. doi:10.1016/j.ecoleng.2013.12.043.
- Helsel DR, Hirsch RM. 2002. Statistical methods in water resources techniques of water resources investigations. U.S. Geological Survey. Available from https://pubs.usgs.gov/twri/twri4a3/twri4a3.pdf.
- Hiscock JG, Thourot CS, Zhang J. 2003. Phosphorus budget—land use relationships for the northern Lake Okeechobee watershed, Florida. Ecol Eng. 21(1):63–74. doi:10.1016/j.ecoleng.2003.09.005.
- James RT, Havens KE, McOrmick P, Jones B, Ford C. 2011. Water quality trends in shallow South Florida lakes and assessment of regional versus local forcing functions. Critic Rev Environ Sci Technol. 41(Suppl 1):576–607. doi:10.1080/10643389.2010.530581.
- James RT, Jones BL, Smith V. 1995. Historical trends in the Lake Okeechobee ecosystem. 2. Nutrient budgets. Arch Hydrobiol (Suppl). 107(1):25–47.
- James RT, Pollman CD. 2011. Sediment and nutrient management solutions to improve the water quality of Lake Okeechobee. Lake Reserv Manage. 27(1):28–40. doi:10.1080/07438141.2010.536618.
- James RT, Zhang J, Gornak S, Gray S, Ritter G, Sharfstein B. 2006. Lake Okeechobee protection program ― state of the Lake and Watershed South Florida Environmental Report. South Florida Water Management Distrist, West Palm Beach, FL.
- Janus LL, Soballe DM, Jones BL. 1990. Nutrient budget analyses and phosphorus loading goal for Lake Okeechobee, Florida. Int Vereinigung theoretische angewandte Limnol Verhandlungen. 24(1):538–546. doi:10.1080/03680770.1989.11898795.
- Jeppesen ERIK, Sondergaard M, Jensen JP, Havens KE, Anneville O, Carvalho L, Coveney MF, Deneke R, Dokulil MT, Foy BOB, et al. 2005. Lake responses to reduced nutrient loading–an analysis of contemporary long‐term data from 35 case studies. Freshwater Biol. 50(10):1747–1771. doi:10.1111/j.1365-2427.2005.01415.x.
- Jin KR, Ji ZG, James RT. 2007. Three-dimensional water quality and SAV modeling of a large shallow lake. J Great Lakes Res. 33(1):28–45. doi:10.3394/0380-1330(2007)33[28:TWQASM]2.0.CO;2.
- Khare YP, Martinez CJ, Toor GS. 2012. Water quality and land use changes in the Alafia and Hillsborough River watersheds, Florida, USA. J Am Water Resources Assoc. 48(6):1276–1293. doi:10.1111/j.1752-1688.2012.00686.x.
- Khare YP, Naja GM, Stainback GA, Martinez CJ, Paudel R, Van Lent T. 2019. A phased assessment of restoration alternatives to achieve phosphorus water quality targets for Lake Okeechobee, Florida, USA. Water. 11(2):327. doi:10.3390/w11020327.
- Kirby R, Hobbs CH, Mehta AJ. 1994. Shallow stratigraphy of Lake Okeechobee, Florida: a preliminary reconnaissance. J Coastal Res. 10(2):339–350.
- Kisi O, Ay M. 2014. Comparison of Mann-Kendall and innovative trend method for water quality parameters of the Kizilirmak River, Turkey. J Hydrol. 513:362–375. doi:10.1016/j.jhydrol.2014.03.005.
- McCarthy MJ, James RT, Chen YW, East TL, Gardner WS. 2009. Nutrient ratios and phytoplankton community structure in the large, shallow, eutrophic, subtropical Lakes Okeechobee (Florida, USA) and Taihu (China). Limnology. 10(3):215–227. doi:10.1007/s10201-009-0277-5.
- National Oceanic and Atmospheric Administration (NOAA). 2018. NCDC; [cited 20 July 2018]. Available from https://www.ncdc.noaa.gov/.
- Paulic M, Hand J, Lord L. 1996. Water quality assessment for the State of Florida Section 305(B) Main Report. Tallahassee, FL: Florida Department of Environmental Protection; p. 317.
- Pohlert T. 2015. Non-parametric trend tests and change-point detection. p. 8. Available from https://cran.r-project.org/web/packages/trend/vignettes/trend.pdf.
- Pollman C, Landing W, Perry J, Jr., Fitzpatrick T. 2002. Wet deposition of phosphorus in Florida. Atmos Environ. 36(14):2309–2318. doi:10.1016/S1352-2310(02)00199-1.
- Reddy KR, Newman S, Osborne T, White J, Fitz H. 2011. Phosphorous cycling in the greater Everglades ecosystem: legacy phosphorous implications for management and restoration. Critic Rev Environ Sci Technol. 41(sup1):149–186. doi:10.1080/10643389.2010.530932.
- Schelske CL. 1989. Assessment of nutrient effects and nutrient limitation in Lake Okeechobee 1. J Am Water Resources Assoc. 25(6):1119–1130. doi:10.1111/j.1752-1688.1989.tb01325.x.
- Schelske CL, Stoermer EF, Kenney WF. 2006. Historic low-level phosphorus enrichment in the Great Lakes inferred from biogenic silica accumulation in sediments. Limnol Oceanogr. 51(1part2):728–748. doi:10.4319/lo.2006.51.1_part_2.0728.
- Sicard P, Dalstein-Richier L, Vas N. 2011. Annual and seasonal trends of ambient ozone concentration and its impact on forest vegetation in Mercantour National Park (South-eastern France) over the 2000-2008 period. Environ Pollut. 159(2):351–362. doi:10.1016/j.envpol.2010.10.027.
- Soil and Water Engineering Technology (SWET). 2018. Evaluation of effectiveness of abatement strategies compared compared against pre-drainage and existing conditions in the Lake Okeechobee watershed deliverable 2.2: final pre-drainage characterization report. South Florida Water Management District, West Palm Beach, FL.
- Søndergaard M, Jeppesen E, Jensen JP, Lauridsen T. 2000. Lake restoration in Denmark. Lakes Reserv Res Manage. 5(3):151–159. doi:10.1046/j.1440-1770.2000.00110.x.
- South Florida Water Management District (SFWMD). 2002. Surface water improvement and management [SWIM] plan update for Lake Okeechobee. South Florida Water Management District, West Palm Beach, FL.
- South Florida Water Management District (SFWMD). 2007. South Florida environmental report. Appendix 2-2. West Palm Beach, FL. Available from http://my.sfwmd.gov/gisapps/losac/sfwmd.asp.
- South Florida Water Management District (SFWMD). 2011. Lake Okeechobee protection plan update. South Florida Water Management District, Florida Department of Environmental Protection, and Florida Department of Agricultural and Consumer Services. Available from https://www.sfwmd.gov/sites/default/files/documents/ne_lakeo_wrac_20090930.pdf.
- South Florida Water Management District (SFWMD). 2014. South Florida Environmental Report, Chapter 8: Lake Okeechobee Watershed Protection Program Annual and Three-Year Update. South Florida Water Management District, West Palm Beach, FL. Available from http://apps.sfwmd.gov/sfwmd/SFER/2014_SFER/v1/chapters/v1_ch8.pdf.
- South Florida Water Management District (SFWMD). 2016. Get the facts. West Palm Beach, FL: South Florida Water Management District.
- South Florida Water Management District (SFWMD). 2017. DBHYDRO; [cited 15 July 2018]. Available from https://www.sfwmd.gov/science-data/dbhydro.
- South Florida Water Management District (SFWMD). 2018. Lake Okeechobee stage-area-capacity lookup. West Palm Beach, FL. Available from http://my.sfwmd.gov/gisapps/losac/sfwmd.asp.
- South Florida Water Management District (SFWMD). 2019. South Florida Environmental Report, Chapter 5B: Performance and Operation of the Everglades Stormwater Treatment Areas. South Florida Water Management District, West Palm Beach, FL. Available from https://apps.sfwmd.gov/sfwmd/SFER/2019_sfer_final/v1/chapters/v1_ch5b.pdf.
- State of Florida. 2018. Florida administrative code surface water quality standard. Available from https://floridadep.gov/dear/water-quality-standards.
- Stoermer E, Andresen N, Schelske C. 1992. Diatom succession in the recent sediments of Lake Okeechobee, Florida, USA. Diatom Res. 7(2):367–386. doi:10.1080/0269249X.1992.9705225.
- Sullivan JH, Woodall WH. 2000. Change-point detection of mean vector or covariance matrix shifts using multivariate individual observations. IIE Trans. 32(6):537–549. doi:10.1080/07408170008963929.
- United States Army Corps of Engineers (USACE). 1978. Area capacity curve for Lake Okeechobee. Central and Southern Florida Project for flood control and other purposes. Part I. Rule curves and key operating criteria, master regulation manual. Jacksonville, FL: United States Army Corps of Engineers.
- United States Environmental Protection Agency (USEPA). 2017. National water quality inventory: report to congress. Washington, DC: U.S. Environmental Protection Agency; p. 21.
- Yan YY, James RT, Miralles-Wilhelm F, Tang W. 2014. Geographically weighted spatial modelling of sediment quality in Lake Okeechobee, Florida. GISci Remote Sens. 51(4):366–389. doi:10.1080/15481603.2014.929258.
- Yu YS, Zou SM, Whittemore D. 1993. Nonparametric trend analysis of water-quality data of rivers in Kansas. J Hydrol. 150(1):61–80. doi:10.1016/0022-1694(93)90156-4.
- Zhang J, Burke P, Iricanin N, Hill S, Gray S, Budell R. 2011. Long-term water quality trends in the Lake Okeechobee watershed, Florida. Critic Rev Environ Sci Technol. 41(sup1):548–575. doi:10.1080/10643389.2010.530577.