
 ?Mathematical formulae have been encoded as MathML and are displayed in this HTML version using MathJax in order to improve their display. Uncheck the box to turn MathJax off. This feature requires Javascript. Click on a formula to zoom.
Abstract
Weber MA, Wainger LA, Harms NE, Nesslage GM. 2020. The economic value of research in managing invasive hydrilla in Florida public lakes. Lake Reserv Manage. XX:XX–XX.
Decisions on how to allocate research funds can be informed by evaluating the benefits of research, yet past spending is rarely analyzed to gain insights for effective research allocation. We used a case study to evaluate whether research into nonnative invasive plants improved management of herbicide-resistant hydrilla (Hydrilla verticillata) in the Kissimmee Chain of Lakes (KCOL), Florida, USA. We applied a retrospective benefit–cost analysis to quantify the net economic benefits of invasive control informed by government-supported research, relative to a scenario without research funding. Using conservative assumptions, we estimated net benefits of 11 yr of research (1999–2009) and 5 yr of improved hydrilla management as $19.5 million (2017 dollars) with a benefit–cost ratio of 3.8, including avoided ecosystem service losses to angler and nonangler lake users. These benefits were about 2.2 times the annual value of recreational fishing in the KCOL. Sensitivity analysis indicated that positive net benefits were generally robust to uncertainty regarding the hydrilla intrinsic growth rate and treatment costs in the absence of research-informed protocols. We have likely underestimated research benefits because we lumped costs from multiple programs and did not measure benefits accruing to nonusers of lakes. To enable future retrospective economic analyses, we suggest some improvements in record keeping. Our findings of positive net benefits of research may be representative of cases where relatively modest research investment in invasive species control is likely to protect widely appreciated ecosystem services.
In an environment where federal and state budgets are limited for managing invasive species, decisions on how to allocate public resources for research can be aided by examining their associated benefits. Nonnative invasive species present a difficult management challenge due to many factors, including the need to sustain programs over the long term to achieve goals (Hussner et al. Citation2017). Further, management programs need monetary research support to enable innovation and support adaptation to changing conditions, because invasive species respond to dynamic socioecological systems that may facilitate their spread (De Ventura et al. Citation2016).
Economic research has identified numerous cases where managing invasive species has created net benefits (Lovell et al. Citation2006, Olson Citation2006, Wainger et al. Citation2018a). Other research has informed cost-effective methods of prevention, monitoring, control, and posttreatment restoration (recent reviews include Finnoff et al. Citation2010, Kettenring and Adams Citation2011, Epanchin-Niell et al. Citation2012, Marbuah et al. Citation2014, Hussner et al. Citation2017). However, few economic studies have empirically quantified the contribution of research to the net benefits of invasive species management (for exceptions see D’Evelyn et al. Citation2008 and Finnoff et al. Citation2010).
The value of research that has already been conducted can be evaluated similarly to any type of spending by applying retrospective benefit–cost analysis (BCA), a methodical calculation of net benefits (benefits minus costs), to support choosing actions that maximize public benefits (e.g., Kopits et al. Citation2014). However, retrospective BCA remains an underused tool for learning from past decisions. Conducting retrospective BCA contributes to understanding of transferable cause and effect relationships that can be used to project future conditions under management alternatives, for sites with limited data. For example, evidence from multiple case studies could be combined to quantify the probability that investments in research will improve cost efficiency of management protocols, in order to support forward-looking analysis of management options, such as value of information studies (e.g., D’Evelyn et al. Citation2008).
To explore what could be learned through hindsight, we applied a retrospective BCA to a case study of management of the nonnative invasive aquatic species hydrilla (Hydrilla verticillata) in Florida lakes, under conditions of an unexpected decline in herbicide efficacy. Hydrilla is controlled in Florida lakes for protection of ecosystem service benefits that include recreational uses, navigation, and habitat protection, among others. For the BCA, we asked the following question: how did invasive control research modify the economic values of ecosystem services, relative to a counterfactual scenario that represented lake conditions and use levels without the research investment? To test effects of research on management outcomes, we built a linked ecological and economic model, using extensive historic data, to estimate hydrilla growth over time under alternative management, and then used hydrilla cover to estimate net economic benefits over time.
Research to be valued
Hydrilla is an aquatic invasive species with a long management history in the United States (see Haller Citation2014). The research being valued in this analysis is limited to studies on adapting hydrilla management to the development of reduced effectiveness of fluridone, the herbicide that was commonly used to control hydrilla. Although resistance to repeated herbicide applications is common in terrestrial weed management, its development in Florida lakes in the late 1990s to early 2000s was somewhat unexpected because hydrilla in this region reproduces asexually (Getsinger et al. Citation2008). Fluridone-resistant hydrilla (FRH) posed such a problem that a conference was held in 2004 to discuss alternatives (Hoyer et al. Citation2005). Because resistance was unexpected, research was used to confirm that FRH was the cause of reduced efficacy of fluridone (MacDonald et al. Citation2001, Michel et al. Citation2004). Simultaneously, enhanced microbial degradation (EMD) of fluridone by bacteria was observed in some lakes (Mossler et al. Citation1991, Hoyer et al. Citation2005, Koschnick et al. Citation2007), also reducing its efficacy.
Managers initially responded to FRH by increasing the concentration of fluridone applied. Although hydrilla remained sensitive to such treatments, this led to increased chemical costs and negative impacts to nontarget native plants (Jones D, University of Florida, Biological Scientist, Feb 2018, pers. comm., Phillips M, Florida Fish and Wildlife Conservation Commission [FWC], Biological Administrator, Aug 2018, pers. comm.). Furthermore, after FRH was confirmed, managers wanted to limit fluridone use to avoid triggering incidence of FRH in other waterways (Getsinger K, US Army Corps of Engineers [USACE], Research Biologist, Aug 2018, pers. comm.). Without a clear alternative to the highly cost-effective fluridone treatment, it was postulated that the era of large-scale (whole lake) treatments might be coming to an end (Hoyer et al. Citation2005).
With the verification of resistance, research was conducted to adapt the control methods that were in use at the time (Hetrick and Langeland Citation2012, Netherland and Jones Citation2012, Citation2015). Research goals included finding a treatment that increased effectiveness, reduced costs, and avoided harm to desirable, nontarget plants. The herbicide endothall had already been found to provide local control of hydrilla, without causing significant harm to nontarget plants (Skoegerboe and Getsinger Citation2001, Citation2002). However, large-scale application (i.e., hundreds to thousands of hectares at a time) was considered costly (Netherland and Jones Citation2012), as well as risky, because treating many hectares of plants could create severe and widespread water column oxygen depletion due to the rapid decay of substantial biomass, potentially killing fish or harming other aquatic organisms (Hoyer et al. Citation2005, Getsinger K, USACE, Research Biologist, Aug 2018, pers. comm.).
After investigating numerous alternatives, a large-scale treatment protocol for endothall was successfully developed and became the new standard (Hetrick and Langeland Citation2012, Netherland and Jones Citation2012). The protocol largely relied on endothall but reduced chemical concentrations (and associated cost) compared to prior protocols. The new protocol also altered application timing to cooler temperature periods outside the most intensive growing season, in order to mitigate potential negative impacts on water quality and nontarget plant communities, as well as to reduce herbicide breakdown, thereby increasing hydrilla exposure to the herbicide.
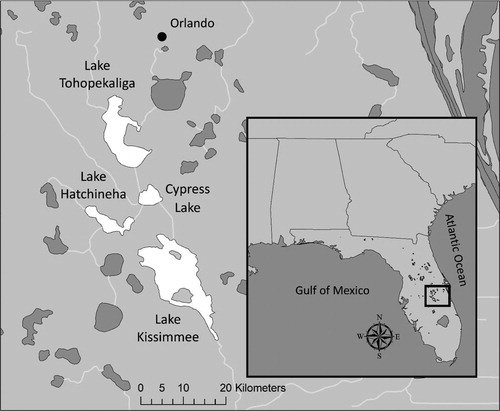
The area of interest for evaluating the benefits of the new treatment protocol was the Kissimmee Chain of Lakes (KCOL; ) in central Florida, even though hydrilla is controlled across a much broader area in Florida and beyond. The analysis was limited to the KCOL because of the quality of data and because of clearly documented evidence of herbicide resistance (Netherland and Jones Citation2015). The KCOL is a system of hydrologically connected lakes and waterways in central Florida () that includes Lake Kissimmee (14,143 ha), Lake Tohopekaliga (7612 ha), Lake Hatchineha (2697 ha), and Cypress Lake (1658 ha) and that is prized for angling and other types of recreation. The KCOL lakes were closely monitored for hydrilla control effectiveness and recreational use, thereby providing a data-rich case study.
Figure 1. Kissimmee Chain of Lakes site map.
Materials and methods
We estimated the net benefits of hydrilla management research with biological and economic models to compare the costs and benefits of 2 scenarios representing conditions with and without research. The actual scenario represented observed outcomes that occurred as a result of the research-informed treatment protocol, and the counterfactual scenario represented alternative modeled outcomes, had research not been conducted. The net benefits of the research (NBR) are the difference in annual net benefits of the actual and counterfactual scenarios, summed over all years of the analysis, as shown in Equationequation 1(1)
(1) ,
(1)
(1)
where B = sum of all benefits (including disbenefits such as reductions to ecosystem service values), C = all costs (treatment costs [Cm] + research costs [Cr]), a and c denote the actual and counterfactual scenarios, and t is year, t = (1, …T). T is 5 yr, representing the period in which different management was applied, but research costs are summed over an 11 yr period ending in the last year of the treatment comparison (t = T).
The actual scenario represented inputs and outcomes of the new research-informed endothall large-scale treatment protocol that began in fiscal year (FY) 2005–2006. In this scenario, pre-FRH levels of hydrilla control and ecosystem service values of lake users were maintained. The actual scenario included research and documented treatment costs associated with the research-informed management approach.
In contrast, the counterfactual scenario represented an alternative treatment protocol, developed in consultation with experts and using data on historic treatments prior to the adoption of fluridone and excluding outputs of the new research. Consistent with historic evidence, this scenario did not maintain the same level of hydrilla control and therefore resulted in reduced boat access and created other harms to lake users, relative to the actual scenario.
We evaluated benefits and costs, other than research, over a period of 5 yr, starting in FY2005–2006 and ending in FY2009–2010. The initial year, FY2005–2006, was the first year in which the former treatment protocol of large-scale fluridone application ceased (Netherland and Jones Citation2015). We assumed that beyond 5 yr, managers would be likely to find a more efficient solution than the one specified in the counterfactual scenario, through trial and error. A 5 yr time span is likely to be a conservative assumption, because a practical treatment solution could have taken much longer to develop without research.
To reflect the perspective of a decision maker choosing to invest in research in 1999, we calculated net benefits of research (Equationequation 1(1)
(1) ) and discounted the future stream of benefits and costs to represent present values. We used a 3% discount rate, an approximate average of recent rates used by the USACE for federal project planning (USACE Citation2017). Prior to discounting, all values were adjusted to a common base year of 2017 dollars with the CPI inflation calculator (Bureau of Labor Statistics Citation2018). Further analysis details are shown in .
Table 1. Actual and counterfactual scenario comparison.
Actual scenario
Treatment costs
Hydrilla is a long-term management issue in Florida lakes. The FWC reports spending approximately $5 to $15 million per year statewide between 2015 and 2019 (FWC Citation2019). During our study period, most of the treatment was conducted by the South Florida Water Management District (SFWMD) but funded by the FWC.
Using FWC data, we calculated a median treatment cost per lake from 11 years of reports, FY2005–2006 through FY2015–2016, and applied it consistently over the 5 yr scenario analysis period. The treatment costs include labor, equipment, materials, and overhead costs of operating and maintaining equipment and deploying personnel. We used a median cost rather than a time series of costs to moderate the high variability of cost per area treated, which appeared to vary as a result of accounting differences, small variations in chemical mix, and other unknown factors. Lake-specific costs were used because lake depth, surface area, and other site characteristics influenced the amount of chemical used and thus cost.
We modified the cost database before calculating the median by omitting years FY2005–2006 to FY2006–2007 from the 11 years of data. These years were omitted because treatment costs were uncharacteristically low due to hydrilla suppression resulting from a series of hurricanes in late 2004. The hurricanes uprooted hundreds of hectares of hydrilla and lowered water clarity, which dramatically reduced hydrilla growth and the need for management actions (Hoyer et al. Citation2005, Schardt Citation2005, Florida Department of Environmental Protection Citation2007) until 2007 (Florida Department of Environmental Protection Citation2007, Netherland and Jones Citation2012, Citation2015).
Research costs
We used all available data to calculate FRH-related research expenses incurred to develop new treatment protocols for hydrilla. Research funding spanned 1999 to 2009, and included the following activities: improved technology for monitoring submerged aquatic vegetation (Netherland and Jones Citation2012); efforts supporting registration of additional herbicides for hydrilla control, such as penoxsulam (Netherland and Jones Citation2012); testing of a large-scale treatment protocol for endothall or penoxsulam, or both in combination (Netherland and Jones Citation2012); testing for the continuance and spatial extent of FRH (Netherland and Jones Citation2012, Citation2015); improved mechanical (harvesting) control (Haller and Jones Citation2012); and biological control options (Hetrick and Langeland Citation2012). At least some of the funding we included was for outreach to citizens and aquatic managers (Hetrick and Richard Citation2012).
Counterfactual scenario
Treatment protocol
Through discussions with experts and our review of historic treatment approaches (Getsinger K, Netherland M, USACE, Research Biologists, Aug 2018, pers. comm.), we narrowed the likely type of treatment, in the absence of research, to spot treatment with the herbicide endothall. Spot treatment had been used historically (Hoyer et al. Citation2005) and would allow continued boat access, without incurring large application costs or extensive damage to nontarget organisms. We further assumed that approximately 4% of each lake area would be treated annually to maintain boating access (based on historic treatments described in Colle et al. Citation1987). We tested the sensitivity of the assumption that only 4% of the lake was treated by evaluating 1%, 8%, and 12% area treated, to represent ranges that could occur if growth were slow, treatment resources were limited, or larger areas were treated to maintain water flow as a means of flood control.
Treatment costs
We estimated costs per unit area for spot treatment by increasing the endothall concentration by a factor of 2, relative to the modern, research-informed large-scale treatment protocol, to recreate typical spot treatment concentrations. This multiplier was developed from evidence that endothall concentrations of 3 ppm were used historically versus 1 to 2 ppm post research (Hoyer et al. Citation2005, Netherland and Jones Citation2012, Netherland M, USACE, Research Biologist, Aug 2018, pers. comm.). We estimated a single cost of spot treatment per unit area for all lakes, because most of the treatment would likely have been shallow water boat access zones that are similar across lakes. Counterfactual treatment costs were considered to be the sum of estimated chemical costs, nonchemical costs, and an additional cost to account for managerial overhead, all multiplied by area spot treated. Treatment cost in the counterfactual scenario in year t (Ccmt) is calculated as shown in Equationequation 2(2)
(2) ,
(2)
(2)
where H is chemical costs per unit area (post research) and is multiplied by 2 to represent costs without research; L represents nonchemical costs per unit area; O is overhead cost per unit area; and A represents area spot treated.
We did not have direct data on H, so we estimated it by subtracting all other costs from total costs. We first calculated a median total cost of modern treatment per unit area from the aggregated costs reported by FWC for FY2007–2008 to FY2015–2016. We then subtracted average L (labor and equipment costs) per unit area treated, based on SFWMD data records for the matching timespan, plus a 15% overhead rate (per Johnson D, SFWMD, Scientist, Aug 2018, pers. comm.). Although H is multiplied by 2, to represent unit treatment costs for the counterfactual scenario, the L and O unit costs were assumed to remain the same as the modern costs of applying endothall, which may be an underestimate of treatments costs per unit area, due to the relative inefficiency of treating small areas.
Hydrilla growth model
We used a logistic growth model to predict how hydrilla would respond to reduced treatment in the counterfactual, following methods for aquatic invasive species from prior studies (Bianchini et al. Citation2010, Nesslage et al. Citation2016). Following Verhulst (Citation1838), Equationequation 3(3)
(3) was used to represent the hydrilla population (cover) after t years, P(t):
(3)
(3)
where Po is the initial population level, r is the population intrinsic growth rate of hydrilla by lake, and K is carrying capacity, set to lake area.
We estimated r annually for each lake by fitting Equationequation 3(3)
(3) to vegetation survey data during the initial infestation to best represent conditions under minimal or no treatment. We estimated r for years 1983 (when FWC hydrilla survey records begin) through 1995 (when FWC hydrilla unit areas treated records begin). We then averaged the top 3 rates found and used that average to project the area covered by hydrilla under the counterfactual scenario of no research (Table S1). Our calculated growth rates were likely conservative, as we expect growth rates to increase with age of the infestation due to higher propagule pressure.
Our resulting intrinsic growth rates ranged from 2.29 (Lake Tohopekaliga) to 3.58 (Cypress Lake). Our estimates were similar to that of another Florida lake that contained (largely) untreated hydrilla, Orange Lake, for which we estimated an intrinsic growth rate of 2.57 using a time series of hydrilla infestation from 1974 to 1982 available from Colle et al. (Citation1987).
To model hydrilla cover in the counterfactual, we used Equationequation 3(3)
(3) and our 3 yr average estimates of r for each lake to project yearly growth, while also subtracting area spot treated annually with an assumed treatment efficacy of 85% (Poovey and Getsinger Citation2010). For the first year, Po was set to the FWC hydrilla cover recorded for FY2004–2005. Calculated net growth in FY2004–2005 was then carried forward to supply the initial population (P0) for FY2005–2006. Calculations for subsequent years proceeded in the same manner to model cumulative growth over all 5 yr.
Ecosystem service losses
Hydrilla is a highly invasive aquatic plant that has the potential to adversely impact ecosystem service values. Hydrilla forms dense mats that can inhibit boating and recreational swimming, clog navigation, block flood control canals, and impact biota (Colle and Shireman Citation1980, Colle et al. Citation1987, Slipke et al. Citation1998). Mats interfere with agricultural operations by blocking irrigation channels or pumps (Langeland Citation1996, Arias et al. Citation2005). Aquatic invasive plants can also alter the characteristic look of waterways in ways that landowners may find undesirable, resulting in decreased lakeside property values (Zhang and Boyle Citation2010).
Hydrilla effects on wildlife are mixed, according to the literature. Changes in water quality due to dense infestations include altered pH, modified nutrient cycles, and reduced dissolved oxygen levels, which can be deleterious to some species (Carpenter and Lodge Citation1986, Colon-Gaud et al. Citation2004, Arias et al. Citation2005). Sammons et al. (Citation2005) found some positive impact on largemouth bass (Micropterus salmoides) from reducing hydrilla; however, a broader study suggests that hydrilla’s impacts on plant, fish, and aquatic community measures in Florida lakes are minimal (Hoyer et al. Citation2008), except, possibly, in dense infestations. Hydrilla has also been associated with the toxin-producing cyanobacteria that causes avian vacuolar myelinopathy disease (Wilde et al. Citation2005, Netherland and Wilde Citation2017), a potential concern for birds, including the federally endangered snail kite (Rostrhamus sociabilis plumbeus).
Despite the broad range of harms associated with hydrilla, our analysis of ecosystem service losses due to reduced hydrilla treatment in the counterfactual is limited to impacts on lake users because data were insufficient to quantify other harms with either biophysical units or values. We included 2 categories of recreational users: anglers and nonanglers (e.g., lakeside wading, boating without fishing, picnicking, trail use). We limited the angling analysis to boat fishing, because the littoral zone of the lakes is typically too broad for effective bank fishing (Johnson K, FWC, Freshwater Fisheries Biologist, Feb 2018, pers. comm.). Multiple published studies were available, including studies specific to the KCOL area, to estimate lake user impacts due to hydrilla and to value changes using benefit transfer. Benefit transfer is a technique to estimate value of a change in a case study site, using valuation results from existing studies conducted elsewhere (Johnston et al. Citation2015).
For anglers, after reviewing multiple sources of information, we modeled hydrilla effects using 80% hydrilla cover as a tipping point for any impact. This choice was based on a creel survey by Colle et al. (Citation1987), who found an 85% reduction in angler effort when hydrilla cover exceeded 80%. This precipitous decline in effort occurred despite the spot treatment of 4% of the lake area that was intended to allow boat access. We used this estimate of reduction in effort to be conservative and minimize projected harms, although other more recent information indicates impacts to anglers may occur at lower levels. Data showing that harm may occur at lower levels of cover come from documented bass fisherman input preferring 30–50% cover for Florida lakes (Holland Citation2006, Milligan Citation2012), and judgment that black crappie (Pomoxis nigromaculatus) might feel harm at much lower levels, such as 30% to 40% (Johnson K, FWC, Freshwater Fisheries Biologist, Feb 2018, pers. comm., Sawyers E, FWC, Biological Scientist, Feb 2018, pers. comm.). Bonvechio and Bonvechio (Citation2006) recommended hydrilla levels between 20% and 40% for Lake Tohopekaliga, to balance needs of diverse angling groups.
The 2004 (baseline) fishing effort for all KCOL lakes (Table S2) was available directly from survey-based estimates (Bell Citation2006, Table 1.2). Total angler days were 181,067, or about 500 anglers per day on average. To value angler days, we estimated consumer surplus per angler day (defined in Freeman et al. Citation2014) as $58.70, using a benefit transfer of inland angling from boats in the US southeast (Wainger et al. Citation2018a), converted to 2017 dollars (Bureau of Labor Statistics Citation2018). The impact on angler benefits was calculated by multiplying the 85% reduction in angler days by the unit value for all years in which hydrilla exceeded the 80% threshold.
Table 2. Estimated lake recreational user losses per year due to hydrilla (2017 dollars).
Calculating losses to recreational fishing required us to establish how many boating visits would be impacted by hydrilla in the counterfactual. We projected hydrilla cover in response to counterfactual spot treatments, and found that cover reached the 80% threshold for impacting recreational angling within year 1 or year 2 of growth (EquationEquation 3(3)
(3) ), depending on the lake. This result was insensitive to the extent of spot treatments applied in the counterfactual (1% to 12% lake area), as all treatment areas were well below annual growth potential. With the hydrilla growth model being limited to yearly data, we estimated that the threshold would be reached in year 2 for the entire KCOL. This estimate is consistent with Florida Department of Environmental Protection (Citation2007) observations that hydrilla can completely cover a waterbody within 1 to 2 yr after introduction, and we also tested a range up to 5 yr in the sensitivity analysis.
The second type of recreational user evaluated was the nonangling fraction of KCOL visitation, those who visit the lakes or lakeside areas but do not fish. Overall, nonangler visitor days comprised a substantial 39% of total recreation days at KCOL lakes (Table S2), more than a third of the estimated 299,000 total yearly visitor days (Bell Citation2006, Table 1.3). We assumed annual visits were constant over the 5 yr scenario because we lacked data to calculate a trend. Nonangler lake visitors have expressed willingness to pay for control of hydrilla and all aquatic invasive plants in Florida lakes, thereby revealing that they experience harm from infestations (Bell Citation2006, Adams et al. Citation2010). These surveys did not ask people to describe the harm, but we expect effects to include both use and nonuse (intangible) values (defined in Wainger et al. Citation2018b), as both would be captured with the survey methods employed. Use values changes could be due to esthetic or logistical changes associated with wading, pleasure boating, picnicking, or using adjacent trails; nonuse values could be due to simply disliking invasive species, which some people feel “don’t belong.” We derived a per visit value of hydrilla control for nonanglers using results from Bell (Citation2006) of an average willingness to pay of $6.43 per visit (converted to 2017 dollars) among KCOL visitors to sustain control of hydrilla in the KCOL, if state funding were discontinued. This value was consistent with an average willingness to pay of $6.15 per visit to reduce aquatic invasive plants (2007 dollars) for Florida residents likely to visit Florida lakes (Adams et al. Citation2010).
Table 3. Sensitivity analysis of the value of research, discounted to present value at 3% (2017 dollars).
To generate total nonangler losses in the counterfactual, the willingness to pay per visit was multiplied by the nonangler visits per year summed over all 5 years, because maintenance control of hydrilla would be absent for the entire comparison time frame. Due to data limitations, we did not include benefits to nonusers, although these are commonly investigated in situations of ecosystem change (e.g., Bishop et al. Citation2017). Nor did we have data to include user benefits beyond recreational, such as any flood control advantage treatment might yield.
Results
Our analysis demonstrated that investment in research to develop alternative hydrilla treatment strategies resulted in substantial economic benefits in the KCOL. We estimated the benefits of research as a net present value of $19.5M (2017 dollars). Angler losses were the dominant economic (or ecosystem service) loss that occurred without the research-informed treatment and resulted from loss of boat access (). Angler losses in the counterfactual scenario (conditions without research) were proportional to reductions in angler days, and ranged from $4.26M per year for Kissimmee to $898,000 per year for Cypress (). Angler losses occurred in the 4 years in which the 80% hydrilla cover threshold was exceeded, but other recreational losses, which were an order of magnitude lower than angling losses, occurred in all years.
Treatment costs in the actual scenario totaled $3.74M per year (Table S3), somewhat higher ($1.15M) than the total annual treatment costs of $2.58M in the counterfactual (Table S4, 4% level). Total treatment costs were similar in the 2 scenarios despite very different amounts of area treated, because the doubling of herbicide concentration makes treatment costs per unit area much higher in the counterfactual. On a per area basis, spot treatment cost in the counterfactual is $2474/ha, compared to $1394/ha for modern treatment (Table S5).
Research efforts across 3 federal and local government agencies were estimated to cost $7.0M from 1999 to 2009. The majority of research investments were made by the FWC, with additional funding from the US Environmental Protection Agency and USACE (Table S6), for verifying FRH in hydrilla, developing field tests for resistant strains of plants, and testing alternative herbicide treatment regimes. Data were insufficient to separate costs by research task, but testing the new treatment protocol for endothall was reported to be a substantial undertaking, with “thousands of water samples, water quality parameters, and man hours spent on multiple lakes over multiple years to verify this use pattern” (Netherland M, USACE, Research Biologist, Aug 2018, pers. comm.). Industry was also engaged in research (Hoyer et al. Citation2005), but the level of effort was not clear.
The value of research varied considerably within the sensitivity analysis, but was almost always a substantial positive value (). At the 8% and 12% levels of spot treatment, the annual cost of spot treatment became higher than modern large-scale endothall treatments; $5.17M and $7.75M, respectively (Table S4), as compared with $3.74M in the actual scenario (Table S3).
Lengthening the time to reach the 80% threshold of hydrilla cover by 1 yr reduced the net benefits substantially from our best estimate, from $19.5M to $12.2M. When it took 5 yr or more to reach 80% cover, all angler losses were eliminated, and net benefits were negative. On the other hand, shortening the time to 1 yr increased the net benefits to $27.1M ().
Varying these 2 dimensions of the sensitivity analysis simultaneously, the net benefits ranged from a high of $47.5M to a low of –$16.2M (). Negative net benefits, indicating net costs of research, occurred only in a few extreme cases where hydrilla took many years to regrow, combined with a low percentage of lake area spot treated. In most cases, the difference in benefits between the actual and counterfactual (avoided ecosystem service losses) far outweighed the difference in costs.
Due to chemical costs in the counterfactual being uncertain, we also examined sensitivity of net benefits to our estimate of chemical costs differences between scenarios. For our best estimate, we multiplied modern chemical costs by 2 (Equationequation 2(2)
(2) ) to represent a 3 ppm endothall concentration in the counterfactual, double the modern concentrations of 1.5 ppm, which is the midpoint of the 1–2 ppm range for research-informed treatment provided by Netherland and Jones (Citation2012). Using the 1–2 ppm range for modern treatment in a sensitivity analysis showed that if modern application is closer to 1 ppm, and historic concentrations stay at 3 ppm, net benefits increase to $24.0M, or $4.5M higher than our best estimate of $19.5M. On the other hand, if modern treatment were 2.0 ppm, the treatment cost difference between scenarios narrows and net benefits would fall to $17.3M.
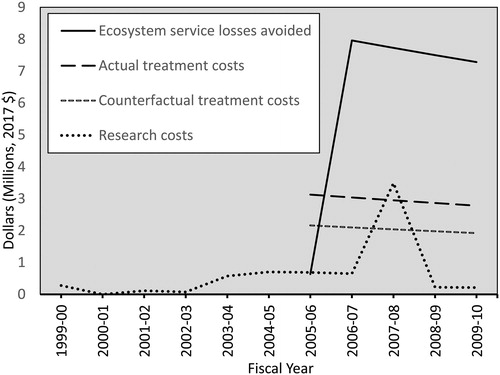
A graph showing how benefits and costs changed through time reveals the differences in the actual and counterfactual scenarios that determine benefits (). When research-informed treatment begins in the year 2005–2006, net benefits are negative because both the actual and counterfactual have levels of hydrilla cover that prevent fishing. By the year 2006–2007, hydrilla has been well controlled in the actual but not the counterfactual, so benefits peak. Research costs start well in advance of the 5 yr scenario comparison and vary from year to year. Treatment costs are constant, but decline slightly in future years due to effects of discounting. Discounting can have a significant impact on measuring benefits of research because costs typically come well before benefits are realized, meaning benefits are more heavily discounted than costs in present value calculations.
Figure 2. Yearly ecosystem service losses avoided in the counterfactual, treatment costs in each scenario, and research costs in the actual scenario. Research costs occur over 11 yr whereas other costs are over the 5 yr scenario analysis period.
Discussion
We employed a retrospective BCA to gain insights into the value of research to improve invasive species management, using hindsight. We developed parsimonious models, by constraining key variables and limiting sensitivity analysis to primary sources of uncertainty. Estimating the net benefits of FRH research presented a challenge; research is rarely discrete, but rather builds upon prior work and leads to continuing investigation. Our approach to overcoming this challenge was to separate the research costs that occurred after FRH was suspected, in order to estimate the value of the investment made.
In addition to estimating the value of hydrilla research, our results can also be applied to estimate the value of continuing KCOL hydrilla management, if we neglect research costs. We can ask: Are modern treatment costs of $3.7M per year (Table S3) justified? Using annual KCOL user damages at $9.0M for anglers and $0.8M for nonanglers that would occur absent treatment (), we estimated net annual benefits of control to be $6.1M. Theoretically, treatment may not pay off at lakes with high treatment costs and low ecosystem service value; however, this situation does not arise for the KCOL. All the lakes have a positive value for maintenance control, and this value is actually highest per hectare for the smaller lakes Hatchineha and Cypress, due to relatively high angler use per unit area.
To estimate the level of treatment effort per lake that would maximize the return on treatment dollars spent, we can compare treatment costs per unit area with value per unit area. Using the KCOL median treatment cost of $1394/ha (Table S5), and further assuming about 10% of the lake area needs to be treated in a given year (a rough average for KCOL lakes), suggests that at least $139.40/ha in benefits would be needed to justify maintenance treatment from an economic standpoint. If this value came from angling benefits alone, and if we continue to use a value of $58.70 per angler day and a decline of 85% in angling use without maintenance treatment, that would translate to needing at least 2.8 angler days/ha/yr to justify treatment, for an average lake. However, this estimate of angler days ignores many other economic benefits and would be reduced by including nonangler benefits of maintenance control and nonuse values of any kind related to controlling invasive species.
Our estimates of the net benefits of research are likely to be conservative for several reasons. First, we included all research costs related to FRH, including funding for outreach and possibly other nonresearch activities that were not itemized and could not be reliably subtracted. Also, due to data limitations, we did not capture nonuser benefits, or nonrecreational benefits that might have been derived from loss of flood control capacity or protection of characteristic ecosystems. In addition, we used a threshold of 80% hydrilla cover to trigger recreational fishing losses, although it is plausible anglers could be impacted at much lower hydrilla levels. We also constrained the benefits of the analysis geographically to the KCOL and for only 5 yr, although the research is likely to have implications for control strategies on lakes wherever hydrilla fluridone resistance occurs and developing an effective treatment for FRH could have taken much longer.
Substantial data were available to inform many aspects of modeling but incomplete and sometimes inconsistent data posed challenges (Table S7). Data are never perfect, but managers could promote economic analysis by improving certain aspects of data collection. We suggest the following record keeping: at minimum, yearly information on invasive cover (preferably at a consistent time of year, prior to treatment) and monthly records of costs and control effort, including area treated and retreated. Additionally, costs tracked by category (herbicide, nonchemical supplies, labor, equipment, and overhead) and quantification of any nontarget harms (such as area of native plants affected) can improve representation of site heterogeneity. Finally, long-term maintenance of electronic records is needed to evaluate before and after treatment conditions, as demonstrated by our use of data from the 1970s and 1980s to inform the counterfactual scenario.
To enable quantification of a system-wide suite of benefits and tradeoffs, complementary data on human or wildlife responses to invasive cover (e.g., visitation, safety), or indirect effects on people (e.g., flooding frequency), including conditions prior to initiating control, are highly desirable. Invasive species management programs are rarely charged with collecting such socioeconomic data, so they may need to create partnerships with other state or federal agencies to ensure data are collected in a manner that enables program analysis. The spatial and temporal detail of socioeconomic data would, ideally, match that of the invasive species data. For example, visitation data recorded with the same frequency as invasive cover could enable estimates of effect of invasive cover on behavior.
Assessing the costs and benefits of research in a replicable, quantitative way has the potential to justify lake and reservoir management and to support management choices that maximize net benefits. Such research is needed because, despite much evidence of net benefits of invasive species management, spending appears to be inadequate to maintain many valued ecosystem services (General Accounting Office Citation2001, Rockwell Citation2003). With enough cases of retrospective BCA to evaluate, further cost-efficient invasive control approaches may become evident and may reveal the conditions under which research is most likely to generate net benefits. Results could also provide a stronger empirical basis for statistical modeling of different outcomes in forward-looking analysis, such as formal value of information studies, that aim to show the benefits of reducing uncertainty.
Conclusions
The economic analysis demonstrated that scientific research, conducted to overcome a loss of effectiveness of a nonnative invasive treatment, generated net social benefits for lakes with high visitation. Using a linked ecological and economic model, built on an unusually detailed historic dataset, we estimated that the net present value of hydrilla research for the 4 KCOL lakes in Florida was $19.5M (2017 dollars), discounted at 3%. The analysis generated a benefit–cost ratio of 3.8, based on $7.0M in research investments, despite many conservative assumptions in our analysis. For context, the value of research was about 2.2 times the annual value of KCOL recreational fishing. Our study also supports the economic benefits of ongoing maintenance control of hydrilla, with net benefits of approximately $6.1M per year, neglecting research costs.
Research spending generates many benefits that are not fully captured here, including novel discoveries that may lead to innovative treatments for harmful species that were not the main purpose of the study. However, even with our relatively narrow scope of evaluating benefits as the improvements in ecosystem service benefits, we estimated positive net benefits of research. The benefits in this case were large relative to costs because the research was effective at reducing the treatment cost per unit area, enabled larger lake areas to be treated for a similar amount of money, and substantially improved a valuable recreational fishery when research-informed treatment was applied. Our results suggest that net benefits of research may be positive whenever they lead to technologies or processes that dramatically improve high-value ecosystem services, such as recreational fishing. However, net benefits could be difficult to assess when effects of research are diffuse or poorly documented, such as the flood control benefits that many perceive but that we were not able to measure.
The dearth of retrospective benefit–cost analysis may be partially due to incomplete record keeping, and we provided suggestions on how data collection could be designed to support future economic analyses by tracking research spending by goals and application, and characterizing effectiveness of research-informed treatment through time. Many more retrospective case studies are needed to improve our understanding of how research can be targeted to improve treatment cost-effectiveness and promote socially efficient invasive species management. Rigorous accounting of the effects of research-informed treatment on invasive species control is a necessary step to promote this goal, but ecological data need to be complemented with data on human responses to invasive species in order to improve understanding of the benefits of research and invasive species management.
Authors’ contributions
The research and analysis were conducted by authors Weber and Wainger; author Harms gathered cost data and offered technical advice but did not contribute to the study design or implementation; author Nesslage advised on hydrilla growth modeling and conducted preliminary analysis.
Supplemental Material
Download MS Excel (18.3 KB)Supplemental Material
Download MS Word (65.1 KB)Acknowledgments
This research would not have been possible without numerous persons sharing their time to supply critical expert knowledge or other forms of aid. We are grateful to the following persons for their assistance, without implying their concurrence with our analysis: From the University of Maryland Center for Environmental Science, we thank Taylor Hollady, Kimmy Gazenski, and Andrea Tineo. From the University of Florida, we thank Dean Jones and William Haller. From the USACE, we thank Michael Netherland, Kurt Getsinger, Martin Schultz, David Lattuca, Linda Nelson, and Al Cofrancesco. From the FWC, we thank Jeff Schardt, Eric Sawyer, Kevin Johnson, Matt Phillips, and Alex Dew. From the SFWMD, we thank Alexandra Onisko and David Johnson.
Additional information
Funding
References
- Adams DC, Bucaram S, Lee DJ, Hodges AW. 2010. Public preferences and values for management of aquatic invasive plants in state parks. Lake Reserv Manage. 26(3):185–193. doi:10.1080/07438141.2010.504319.
- Arias RS, Netherland MD, Scheffler BE, Puri A, Dayan FE. 2005. Molecular evolution of herbicide resistance to phytoene desaturase inhibitors in Hydrilla verticillata and its potential use to generate herbicide-resistant crops. Pest Manag Sci. 61(3):258–268. doi:10.1002/ps.1022.
- Bell FW. 2006. Economic sectors at risk from invasive aquatic weeds for the Kissimmee chain of lakes in Osceola County, Florida, 2004–2005. http://www.aquatics.org/pubs/kissimmee_econ.pdf.
- Bianchini I, Cunha-Santino MB, Milan JAM, Rodrigues CJ, Dias JHP. 2010. Growth of Hydrilla verticillata (L.f.) Royle under controlled conditions. Hydrobiologia. 644(1):301–312.
- Bishop RC, Boyle KJ, Carson RT, Chapman D, Hanemann WM, Kanninen B, Kopp RJ, Krosnick JA, List J, Meade N, et al. 2017. Putting a value on injuries to natural assets: the BP oil spill. Science. 356(6335):253–254. doi:10.1126/science.aam8124.
- Bonvechio K, Bonvechio T. 2006. Relationship between habitat and sport fish populations over a 20-year period at West Lake Tohopekaliga, Florida. N Am J Fish Manage. 26(1):124–133.
- Bureau of Labor Statistics. 2018, August 28. CPI inflation calculator. Available from https://data.bls.gov/cgi-bin/cpicalc.pl.
- Carpenter SR, Lodge DM. 1986. Effects of submersed macrophytes on ecosystem processes. Aquat Bot. 26:341–370. doi:10.1016/0304-3770(86)90031-8.
- Colle DE, Shireman JV. 1980. Coefficients of condition for largemouth bass, bluegill, and redear sunfish in hydrilla-infested lakes. T Am Fish Soc. 109(5):521–531. doi:10.1577/1548-8659(1980)109<521:COCFLB>2.0.CO;2.
- Colle DE, Shireman JV, Haller WT, Joyce JC, Canfield DEJ. 1987. Influence of hydrilla on harvestable sport-fish populations angler use, and angler expenditures at Orange Lake, Florida. N Am J Fish Manage. 7(3):410–417. doi:10.1577/1548-8659(1987)7<410:IOHOHS>2.0.CO;2.
- Colon-Gaud J-C, Kelson WE, Rutherford DA. 2004. Spatial distribution of macroinvertebrates inhabiting hydrilla and coontail beds in the Atchafalaya Basin, Louisiana. J Aquat Plant Manage. 42:85–91.
- D’Evelyn ST, Tarui N, Burnett K, Roumasset JA. 2008. Learning-by-catching: uncertain invasive-species populations and the value of information. J Environ Manage. 89(4):284–292. doi:10.1016/j.jenvman.2007.04.027.
- De Ventura L, Sarpe D, Kopp K, Jokela J. 2016. Variability in phenotypic tolerance to low oxygen in invasive populations of quagga and zebra mussels. AI. 11(3):267–276. doi:10.3391/ai.2016.11.3.05.
- Epanchin-Niell RS, Haight RG, Berec L, Kean JM, Liebhold AM. 2012. Optimal surveillance and eradication of invasive species in heterogeneous landscapes. Ecol Lett. 15(8):803–812. doi:10.1111/j.1461-0248.2012.01800.x.
- Finnoff D, McIntosh C, Shogren JF, Sims C, Warziniack T. 2010. Invasive species and endogenous risk. Annu Rev Resour Econ. 2(1):77–100.
- Florida Department of Environmental Protection. 2007. Status of the aquatic plant maintenance program in Florida public waters: annual report for fiscal year 2006–2007. Available from https://bugwoodcloud.org/CDN/floridainvasives/reports/aquaticsFY06-07.pdf.
- Florida Fish and Wildlife Conservation Commission. 2019. Annual report of activities conducted under the cooperative aquatic plant control program in Florida public waters for fiscal year 2018–2019.
- Freeman MA, Herriges JA, Kling CL, Herriges JA, Kling CL. 2014. The measurement of environmental and resource values: theory and methods. London (UK): Routledge.
- General Accounting Office. 2001. Invasive species: obstacles hinder federal rapid response to growing threat. US Gao Rep. GAO-01-724. Washington, DC: US General Accounting Office.
- Getsinger KD, Netherland MD, Grue CE, Koschnick TJ. 2008. Improvements in the use of aquatic herbicides and establishment of future research directions. J Aquat Plant Manage. 46:32–41.
- Haller WT. 2014. Hydrilla. Chapter 15.1. In: Gettys LA, Haller WT, and Petty DG, editors. Biology and control of aquatic plants, a best management practices handbook. Marietta (GA): Aquatic Ecosystem Restoration Foundation. Available from http://www.aquatics.org/bmp.html.
- Haller WT, Jones DK. 2012. Technology and improved efficacy of mechanical control of Hydrilla. Aquatics. 34(3):17–19.
- Hetrick S, Richard A. 2012. Demonstration and outreach, element 4. Aquatics. 34(3):20–21.
- Hetrick SA, Langeland KA. 2012. Hydrilla management in Florida lakes. SS-AGR-361. Gainesville (FL): University of Florida.
- Holland J. 2006. Editorial: summary of interviews with professional bass anglers about aquatic plant management. Aquatics. 28(3):4–6.
- Hoyer M, Netherland M, Allen M, Canfield D. Jr. 2005. Hydrilla management in Florida: a summary and discussion of issues identified by professionals with future management recommendations. Gainesville (FL): Department of Fisheries and Aquatic Sciences, University of Florida/IFAS.
- Hoyer MV, Jackson MW, Allen MS, Canfield DE. 2008. Lack of exotic hydrilla infestation effects on plant, fish and aquatic bird community measures. Lake Reserv Manage. 24(4):331–338. doi:10.1080/07438140809354843.
- Hussner A, Stiers I, Verhofstad MJJM, Bakker ES, Grutters BMC, Haury J, van Valkenburg JLCH, Brundu G, Newman J, Clayton JS, et al. 2017. Management and control methods of invasive alien freshwater aquatic plants: a review. Aquat Bot. 136:112–137. doi:10.1016/j.aquabot.2016.08.002.
- Johnston RJ, Rolfe J, Rosenberger RS, Brouwer R. 2015. Benefit transfer of environmental and resource values. Vol. 14. Dordrecht (Netherlands): Springer.
- Kettenring KM, Adams CR. 2011. Lessons learned from invasive plant control experiments: a systematic review and meta-analysis. J Appl Ecol. 48(4):970–979.
- Kopits E, McGartland A, Morgan C, Pasurka C, Shadbegian R, Simon NB, Simpson D, Wolverton A. 2014. Retrospective cost analyses of EPA regulations: a case study approach. J Benefit Cost Anal. 5(2):173–193. doi:10.1515/jbca-2014-0024.
- Koschnick TJ, Netherland MD, Haller WT. 2007. Effects of three ALS-inhibitors on five emergent native plant species in Florida. J Aquat Plant Manage. 45:47–51.
- Langeland KA. 1996. Hydrilla verticillata (L.F.) Royle (Hydrocharitaceae), “The perfect aquatic weed”. Castanea. 61:293–304.
- Lovell SJ, Stone SF, Fernandez L. 2006. The economic impacts of aquatic invasive species: a review of the literature. Agric Resour Econ Rev. 35(1):195–208. doi:10.1017/S1068280500010157.
- MacDonald GE, Netherland MD, Haller WT. 2001. Discussion of fluridone “tolerant” hydrilla. Aquatics. 23(3):4–8.
- Marbuah G, Gren I-M, McKie B. 2014. Economics of harmful invasive species: a review. Diversity. 6(3):500–523. doi:10.3390/d6030500.
- Michel A, Arias RS, Scheffler BE, Duke SO, Netherland M, Dayan FE. 2004. Somatic mutation-mediated evolution of herbicide resistance in the nonindigenous invasive plant hydrilla (Hydrilla verticillata). Mol Ecol. 13(10):3229–3237. doi:10.1111/j.1365-294X.2004.02280.x.
- Milligan D. 2012, Mar 10. How much Hydrilla? The Kissimmee Chain debate. Lakeland (FL): The Ledger.
- Mossler MA, Shilling DG, Albrecht SL, Haller WT. 1991. Microbial degradation of fluridone. J Aquat Plant Manage. 29:77–80.
- Nesslage GM, Wainger LA, Harms NE, Cofrancesco AF. 2016. Quantifying the population response of invasive water hyacinth, Eichhornia crassipes, to biological control and winter weather in Louisiana. Biol Invas. 18(7):2107–2115.
- Netherland MD, Jones D. 2015. Fluridone-resistant hydrilla (Hydrilla verticillata) is still dominant in the Kissimmee Chain of Lakes. Invasive Plant Sci Manage. 8(2):212–218. doi:10.1614/IPSM-D-14-00071.1.
- Netherland MD, Jones DK. 2012. Registered herbicides and improving their efficacy on aquatic weeds. Aquatics. 34(3):12–16.
- Netherland MD, Wilde SB. 2017. Final report to FWC, project title: investigating risk and management of avian vacuolar myelinopathy in Florida. Available from https://plants-archive.ifas.ufl.edu/wp-content/uploads/files/mng/fwc/researchreview/2015/wed/10_Investigating%20risk%20and%20management%20of%20Avian%20Vacuolar%20Myelinopathy%20in%20Florida_Susan%20Wilde.pdf.
- Olson LJ. 2006. The economics of terrestrial invasive species: a review of the literature. Agric Resour Econ Rev. 35(1):178–194. doi:10.1017/S1068280500010145.
- Poovey AG, Getsinger KD. 2010. Comparative response of monoecious and dioecious hydrilla to endothall. J Aquat Plant Manage. 48:15–20.
- Rockwell HW. 2003. Summary of a survey of the literature on the economic impact of aquatic weeds. Available from http://www.aquatics.org/pubs/economics.html.
- Sammons SM, Maceina MJ, Partridge DG. 2005. Population characteristics of largemouth bass associated with changes in abundance of submerged aquatic vegetation in Lake Seminole, Georgia. J Aquat Plant Manage. 43:9–16.
- Schardt J. 2005. Editorial. Aquatics. 27(1):3.
- Skoegerboe JG, Getsinger KD. 2001. Endothall species selectivity evaluation: southern latitude aquatic plant community. J Aquat Plant Manage. 39:129–135.
- Skoegerboe JG, Getsinger KD. 2002. Endothall species selectivity evaluation: northern latitude aquatic plant community. J Aquat Plant Manage. 40:1–5.
- Slipke JW, Maceina MJ, Grizzle JM. 1998. Analysis of the recreational fishery and angler attitudes toward Hydrilla in Lake Seminole, a southeastern reservoir. J Aquat Plant Manage. 36:101–106.
- US Army Corps of Engineers (USACE). 2017. Economic guidance memorandum EGM (18-01) federal interest rates for Corps of Engineers projects for fiscal year 2018. Available from https://planning.erdc.dren.mil/toolbox/library/EGMs/EGM18-01.pdf.
- Verhulst P-F. 1838. Notice sur la loi que la population poursuit dans son accroissement. Corresp Math Phys. 1838:113–121.
- Wainger LA, Harms NE, Magen C, Liang D, Nesslage GM, McMurray AM, Cofrancesco AF. 2018a. Evidence-based economic analysis demonstrates that ecosystem service benefits of water hyacinth management greatly exceed research and control costs. Peer J. 6:e4824. doi:10.7717/peerj.4824.
- Wainger LA, Helcoski R, Farge KW, Espinola BA, Green GT. 2018b. Evidence of a shared value for nature. Ecol Econ. 154:107–116. doi:10.1016/j.ecolecon.2018.07.025.
- Wilde SB, Murphy TM, Hope CP, Habrun SK, Kempton J, Birrenkott A, Wiley F, Bowerman WW, Lewitus AJ. 2005. Avian vacuolar myelinopathy linked to exotic aquatic plants and a novel cyanobacterial species. Environ Toxicol. 20(3):348–353. doi:10.1002/tox.20111.
- Zhang C, Boyle KJ. 2010. The effect of an aquatic invasive species (Eurasian watermilfoil) on lakefront property values. Ecol Econ. 70(2):394–404. doi:10.1016/j.ecolecon.2010.09.011.