
Abstract
Haig HA, Chegoonian AM, Davies J-M, Bateson D, Leavitt PR. 2021. Marked blue discoloration of late winter ice and water due to autumn blooms of cyanobacteria. Lake Reserv Manage. 38:1–15.
Continued eutrophication of inland waters by nutrient pollution can combine with unprecedented atmospheric and lake warming to create emergent environmental surprises. Here we report the first known occurrence of marked blue discoloration of ice and water in highly eutrophic prairie lakes during late winter 2021. Intense blue staining was reported first to governmental agencies by ice fishers in early March 2021, then communicated widely through social media, resulting in First Nations and public concern over potential septic field release, toxic spills, urban pollution, and agricultural mismanagement. Analysis of water from stained and reference sites using ultraviolet (UV)–visible spectrophotometry and high-performance liquid chromatography demonstrated that the blue color arose from high concentrations (∼14 mg/L) of the cyanobacterial pigment C-phycocyanin that was released after an unexpected bloom of Aphanizomenon flos-aquae in late October 2020 was frozen into littoral ice. Remote sensing using the Sentinel 3 A/B OLCI and Sentinel 2 A/B MSI satellite platforms suggested that blue staining encompassed 0.68 ± 0.24 km2 (4.25 ± 1.5% of lake surface area), persisted over 4 weeks, and was located within 50 m of the lakeshore in regions where fall blooms of cyanobacteria had been particularly dense. Although toxin levels were low (∼0.2 μg microcystin/L), high concentrations of C-phycocyanin raised public concern over eutrophication, pollution, and climate change, and resulted in rapid governmental and academic response. Given that climate change and nutrient pollution are increasing the magnitude and duration of cyanobacterial blooms, blue staining of lake ice may become widespread in eutrophic lakes subject to ice cover.
Despite recognition of causes and effects of nutrient pollution, water quality continues to decline in many lakes within inhabited catchments (EEA Citation2018, Le Moal et al. Citation2019) leading to unanticipated effects (Carpenter Citation2003). During the 20th century, this degradation was often associated with phosphorus pollution from point sources, such as cities, wastewater treatment plants, and intensive livestock operations (Schindler Citation1977, Jeppesen et al. Citation2005). However, since that time, long-term monitoring and nutrient budgets demonstrate that diffuse or nonpoint sources of nutrients are responsible for continued water quality loss in both river and lake ecosystems (Carpenter et al. Citation1998, Le Moal et al. Citation2019, Birk et al. Citation2020). Human augmentation of both nitrogen (N) and phosphorus (P) fluxes favors nutrient accumulation in standing waters, leading to outbreaks of harmful algal blooms (HABs), deoxygenation of both surface and deepwater habitats, biodiversity declines, diminished ecosystem services, and substantial economic hardship (Schindler and Vallentyne Citation2008, Downing et al. Citation2021, Jane et al. Citation2021). In particular, continuing influx of P is creating nonlinear changes in freshwater ecosystems, including shifts to other forms of regulation (N, light, microelements; Bogard et al. Citation2020), outbreaks of cyanobacteria on continental scales (Taranu et al. Citation2015), and sudden ecosystem state changes (Scheffer et al. Citation2001, Carpenter Citation2003). Given that global human population growth remains rapid (UNDESA Citation2019), fluxes of nutrients are currently at historical maxima (Lu and Tian Citation2017), and both factors are likely to increase by 30–50% during the next 50 years (Millennium Ecosystem Assessment Citation2005), unexpected changes in freshwater production, structure, and function should become more prevalent.
Climate warming is also pushing freshwater ecosystems into unprecedented states. For example, as surface waters warm, they can favor the disproportionate growth of cyanobacteria in both unproductive (Carey et al. Citation2012, Ewing et al. Citation2020) and highly eutrophic ecosystems (Huisman et al. Citation2018). The high specific heat of water allows lakes in particular to accumulate energy, leading to more pronounced aquatic “heat waves,” reduced ice cover, and extended duration of growing seasons (Sharma et al. Citation2019, Woolway et al. Citation2021). These conditions increase the magnitude and duration of toxic cyanobacterial blooms (Hayes et al. Citation2019) and may contribute to unexpected blooms of phytoplankton during formerly cooler and less productive seasons (Wejnerowski et al. Citation2018, Shcherbak et al. Citation2019). Temperature increases are also depleting oxygen from lakes at unequaled rates (Jane et al. Citation2021), leading to habitat loss in lakes worldwide (Kraemer et al. Citation2021). These conditions can favor invasive species, further reducing the biodiversity of stressed freshwaters (Dickey et al. Citation2021). Given the ineffective control of global greenhouse gas emissions (Olivier and Peters Citation2020), atmospheric and lake temperatures will continue to rise, resulting in regional ecosystem stresses that have no historical precedent (Woolway et al. Citation2021).
Ecological surprises are likely to occur more frequently as the magnitude of lake fertilization and warming increases in uncharted waters (Christensen et al. Citation2006, Filbee-Dexter et al. Citation2017). Historically, such deviations from experiential expectations or mechanistic forecasts often arose because of an incomplete understanding of the natural range of ecosystem conditions, a form of temporal myopia known as the “invisible present” to neo-ecologists (Magnuson Citation1990) but that is familiar to paleolimnologists (Smol Citation2008). However, unabated human population growth and resource utilization have the potential to push some freshwater ecosystems into trajectories that cannot be forecast easily from current process-oriented studies. Ongoing examples of such ecological surprises include hysteretic state change in shallow lakes (Scheffer et al. Citation2001, Carpenter Citation2003), sudden collapse of freshwater and marine fish stocks (Myers et al. Citation1997), under-ice blooms of diazotrophic cyanobacteria (Wejnerowski et al. Citation2018, Shcherbak et al. Citation2019), and sudden establishment of invasive species outside their apparent biological limits (Dickey et al. Citation2021), as well as smaller scale examples that are likely underreported (Sechidis et al. Citation2017).
Here we file the first known report of one such lake-scale ecological surprise—a marked blue discoloration of ice and water in a series of highly eutrophic prairie lakes during late winter 2021. First reported to governmental agencies by ice fishers in early March 2021, communication of the blue water phenomenon spread within days to social media (Facebook, Twitter), traditional news coverage (print, radio, television), and public outreach to government agencies (Saskatchewan Ministry of Environment, Saskatchewan Water Security Agency). Analysis of water and lipid-solute biomarker pigments demonstrated that the blue color resulted from high concentrations of the cyanobacterial pigment C-phycocyanin derived from a late fall bloom of Aphanizomenon flos-aquae that had frozen into nearshore ice late in 2020. Such events may become more frequent, as temperate waters continue to warm, eutrophy, and interact with other novel environmental changes (Birk et al. Citation2020).
Study site
Intense blue staining of ice and water was reported first to the Saskatchewan Water Security Agency (WSA) on 11 March 2021 for Pasqua Lake, with subsequent social media reports for downstream Echo Lake (). These 2 sites are part of the 58,775 km2 Qu’Appelle River drainage basin located in the prairie grassland ecoregion of southern Saskatchewan, Canada (Vogt et al. Citation2011, Haig and Leavitt Citation2019). The Qu’Appelle River arises naturally west of Buffalo Pound Lake and flows eastward through a series of 7 eutrophic lakes (Buffalo Pound, Pasqua, Echo, Mission, Katepwa, Crooked, Round) to its confluence with the Assiniboine River in Manitoba (). River flow is augmented by discharge from the mesotrophic Lake Diefenbaker reservoir to the west, whereas hypereutrophic Wascana Lake and eutrophic Last Mountain Lake drain into the Qu’Appelle River mid-reach, north of the City of Regina ().
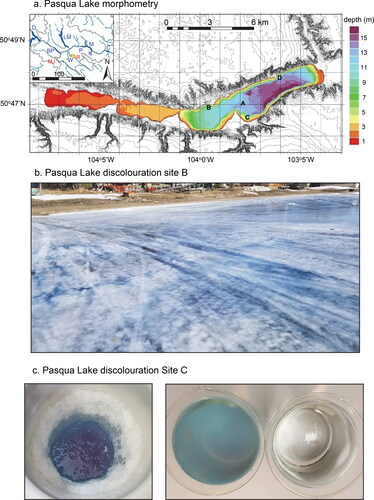
Figure 1. Pasqua Lake, Saskatchewan, Canada. (a) Lake morphology and drainage basin (inset). Regional Qu’Appelle lakes (inset, blue) include Diefenbaker (D), Buffalo Pound (BP), Last Mountain (LM), Wascana (W), Pasqua (P), Echo (E), Mission (M), Katepwa (K), and Crooked (C). Cities (inset, red) include Regina (R) and Moose Jaw (MJ). Reference site (A) and 3 blue-water sampling sites (B, C, D) indicated on main morphometric map. (b) Blue staining of ice and water along north shore of Pasqua Lake (Site B). Photo courtesy of Larry Bedel. (c) Discoloration of water in ice-fishing hole at Site B on the south shore of Pasqua Lake (left; photo courtesy of Tracey Kleim) and comparison of a 15 cm deep sample of 0.45 µm pore filtered lake water from Site B and deionized water (right).
The regional climate (Köppen Dfb classification) exhibits short summers (mean 19 C in July), cold winters (mean −16 C in January), high evaporation (∼60 cm/yr) relative to precipitation (∼30 cm/yr), and ∼75% of annual runoff during a short snowmelt period after mid March (Leavitt et al. Citation2006, Haig et al. Citation2020). Land use within the Qu’Appelle watershed is comprised mainly of agriculture (75%; wheat, canola), along with natural grasslands (12%), the urban centers (5%) of Moose Jaw and Regina, and surface waters (8%; Hall et al. Citation1999, Leavitt et al. Citation2006). Nutrient-rich urban effluent from upstream Regina (tertiary and biologically treated) and Moose Jaw (modified tertiary) first enters Pasqua Lake via the Qu’Appelle River before being conveyed downstream to eastern basins (Davies Citation2006, Bergbusch et al. Citation2021).
Pasqua Lake is composed of a series of 4 progressively deeper basins (), each with alkaline and eutrophic waters that together exhibit a relatively short water residence time (∼0.65 yr; ). Dissolved inorganic (DIC) and organic carbon (DOC) content is elevated, resulting in late summer pH of >9 (Finlay et al. Citation2010a). Like other Qu’Appelle lakes, Pasqua Lake is polymictic, although pronounced deepwater anoxia occurs in the eastern basin during late summer when chlorophyll a (Chl-a) is >100 μg/L, as well as under ice during winter (Hall et al. Citation1999, Vogt et al. Citation2011). Phytoplankton communities are diverse (Supplementary material, ) and include surface blooms of N2-fixing and non-N2-fixing cyanobacteria (Aphanizomenon, Dolichosphermum, Microcystis, Planktothrix, Limnothrix) during July–September, when irradiance (∼300 cloudless days/yr) and dissolved P concentrations are elevated (>50 μg P/L), and mass ratios of dissolved N:P can be <5:1 (Vogt et al. Citation2011, Hayes et al. Citation2019) ().
Table 1. Physical and chemical features of Pasqua Lake, Saskatchewan, Canada, 2014–2020.
Methods and materials
Limnological monitoring
Pasqua Lake was sampled biweekly between early May and late September 2020 by the University of Regina following standard protocols of the 28 year Qu’Appelle Long Term Ecological Research Program (Vogt et al. Citation2011, Haig and Leavitt Citation2019). Additional monthly samples were collected and analyzed by the WSA using similar protocols (Davies Citation2006). The lake was also sampled by the WSA through ∼30 cm of ice at 2 nearshore locations and a central reference site on 12 March 2021, as well as 2 additional locations 3 days later (). At all stations, water and air temperature (C), dissolved oxygen (mg O2/L), specific conductance (µS/cm), salinity (g total dissolved solids [TDS]/L), and pH were measured using either a YSI model 85 or a model EXO1 meter. Depth-integrated water samples were collected by pooling samples from a 2.2 L Van Dorn water bottle deployed at 1.0 m intervals, while surface samples were collected at ∼0.5 m depth (Vogt et al. Citation2011). Depth-integrated water (surface to Zmax − 1 m) was screened through a 243 µm mesh net to remove large-bodied zooplankton and stored at 4 C in a dark bottle until processed.
Samples for analysis of Chl-a, particulate organic matter (POM), phytoplankton pigments, and stable isotopes of C and N were filtered onto Whatman GF/C glass fiber filters (nominal pore size 1.2 µm) and stored frozen in the dark. Surface and depth-integrated water samples were filtered through a 0.45 μm pore membrane filter and the filtrate was stored until nutrient analysis (Vogt et al. Citation2011). Also, unfiltered surface samples were preserved with Lugol’s IKI solution for microscopic analysis of phytoplankton community composition (Findlay and Kasian Citation1987, Donald et al. Citation2013).
Laboratory analyses
Nutrient concentrations were estimated using standard QU-LTER protocols at the Biogeochemical Analytical Service Laboratory, University of Alberta, Edmonton, Alberta, Canada (Vogt et al. Citation2011), while governmental samples were analyzed using similar protocols at either the Saskatchewan Research Council or the Romanow Provincial Laboratory (Davies Citation2006). Depth-integrated water was screened (243 μm mesh), then filtered through a 0.45 μm pore membrane filter within 3 hours of collection before analysis for total dissolved phosphorus (TDP) and orthophosphate (SRP), both as μg P/L, and for NO3-, NH4+, dissolved Kjeldahl N, and total dissolved nitrogen (TDN; all mg N/L) using standard analytical procedures (Stainton et al. Citation1977). WSA samples included total N and P derived from unfiltered water.
Chl-a samples were analyzed using standard trichromatic methods (Jeffrey and Humphrey Citation1975), while high performance liquid chromatography (HPLC) was used to quantify changes in phytoplankton community composition (Leavitt and Hodgson Citation2001, Donald et al. Citation2013). Briefly, chlorophyll, carotenoid, and derivative pigments were extracted from POM on GF/C filters, dried under inert N2 gas, and redissolved into an injection solution before introduction into a fully calibrated Agilent Model 1100 HPLC fitted with photodiode array and fluorescence detectors. Lipid-soluble biomarker pigments (nmol pigment/L) were quantified for total phytoplankton abundance (Chl-a, pheophytin-a, β-carotene), siliceous algae (fucoxanthin), main diatoms (diatoxanthin, diadinoxanthin), cryptophytes (alloxanthin), dinoflagellates (peridinin), chlorophytes and cyanobacteria (lutein-zeaxanthin), chlorophytes alone (Chl-b), total cyanobacteria (echinenone), colonial cyanobacteria (myxoxanthophyll), Nostocales cyanobacteria (canthaxanthin), and potentially N2-fixing cyanobacteria (aphanizophyll) following Leavitt and Hodgson (Citation2001). Ratios of concentrations of undegraded Chl-a to pheophytin-a (Chl-a:Pheo-a) were used to estimate phytoplankton vitality, as the latter compound is a Chl-a degradation product that is normally rare in living cells (Leavitt and Hodgson Citation2001).
Concentrations of dissolved C-phycocyanin were estimated for winter samples collected in March 2021. This pigment is used by cyanobacteria to regulate cellular N content (Wang et al. Citation2021). Briefly, water was filtered through 0.45 μm pore filters and absorbance was measured at 400–900 nm using an Agilent model 8453 ultraviolet (UV)–visible spectrophotometer fitted with a 10 cm quartz cuvette. Absolute pigment concentrations in situ were estimated from the difference in absorbance of filtered water from blue ice and reference sites and by applying a 15 point calibration curve relating absorbance to known concentrations of authentic C-phycocyanin from Spirulina (Sigma-Aldrich, Oakville). We assumed all in situ absorbance at 620 nm was due to C-phycocyanin, but recognize this procedure might overestimate concentrations if phycoerythrin (from cyanobacteria and cryptophytes) is also present (Sobiechowska-Sasim et al. Citation2014).
Phytoplankton communities in the uppermost 1 m of the water column were enumerated by species and quantified using standard Utermöhl (Citation1958) techniques by David Findlay of Plankton-R-Us, Inc. (Winnipeg, MB). Briefly, whole samples of ∼25 mL were deposited onto depression slides using a sedimentation chamber and cells or colonies were identified at 100 to 1000× magnification using a light microscope with reference to relevant taxonomic keys (Findlay and Kasian Citation1987). Densities of taxa were estimated as cells per milliliter and were converted to biovolume using estimates of greatest axial linear dimensions and application of a species-specific formula for cell shape.
Remote sensing
Temporal changes in the estimated abundance of Chl-a and C-phycocyanin were derived from remote sensing of Pasqua Lake during August–November 2020 (Chl-a) and March–April 2021 (C-phycocyanin). Briefly, we employed the MultiSpectral Instrument (MSI) and Ocean and Land Color Instrument (OLCI) sensors onboard the Sentinel-2 A/B and Sentinel-3 A/B satellites to estimate Chl-a and C-phycocyanin, respectively. Images from MSI have finer spatial resolution (10–60 m) and a Chl-a suitable spectral band configuration (664 nm, 709 nm), but only 2–3 days of temporal resolution at this latitude (ESA Citation2021a), whereas OLCI has a daily revisit time and 16 spectral bands within 400–800 nm, but only 300 m resolution (ESA Citation2021b). The MSI sensor can estimate lake-surface Chl-a concentrations in small inland waters (Pahlevan et al. Citation2020), and its high spatial resolution provides us with detailed maps of seasonal changes in Chl-a distribution during ice-free conditions. Similarly, the Sentinel 3 OLCI sensor has been used to estimate phycocyanin and infer cyanobacterial blooms in lakes (Mishra et al. Citation2019, Ogashawara Citation2019), as it has a spectral band centered on 620 nm, as well as additional wavelengths that allow correction for scattering by particles (e.g., 709 nm). Although MSI approaches have been used previously to estimate winter diatom blooms associated with coastal ice margins (Binding et al. Citation2012), here we used the OLCI for the first time to approximate levels of phycocyanin captured in lake ice. For both sensors, we downloaded all clear-sky images of top-of-atmosphere radiance (rTOA; level 1 data) provided by the European Space Agency (ESA).
All images were corrected for atmospheric effect that may interfere with estimates of surface reflectance. As up to ∼90% of signal that a sensor receives is from atmosphere, not the waterbody, we corrected rTOA data from both sensors using 2 atmospheric models, iCOR (De Keukelaere et al. Citation2018) and Acolite (Vanhellemont Citation2019), both suitable for water quality applications (Pahlevan et al. Citation2021). All high-resolution MSI images were corrected using Acolite model, whereas OLCI images were processed using the iCOR model because the latter also includes the SIMEC algorithm to reduce the adjacency effect on nearshore pixels (Sterckx et al. Citation2015). This correction was required because of the relatively coarse spatial resolution of OLCI images (300 m), the peripheral location of the reported blue-ice phenomenon, and the relatively narrow width of Pasqua Lake (∼2 km). Resultant processed images approximate remote sensing reflectance (Rrs) at the lake surface.
Chl-a concentrations were estimated using a support vector regression (SVR) that used all MSI bands (Chegoonian et al. Citation2021) and that had been trained previously with 7 years of biweekly measurements of Chl-a during May–September from upstream Buffalo Pound Lake (Finlay et al. Citation2019). Because of the proximity and similarity of the 2 lakes (Vogt et al. Citation2011, Hayes et al. Citation2019), inferred Chl-a concentrations were expected agreed to within ∼35% of in situ measured values. Because C-phycocyanin absorbs strongly at 620 nm, but not at the nearby OLCI band centered on 709 nm (), we used the index ratio Rrs620 nm/Rrs709 nm to map potential phycocyanin distribution, while also correcting for absorbance of longer wavelengths by water and other substances (Simis et al. Citation2005, Yan et al. Citation2018). This way, a lower ratio of reflectance should be related to high concentrations of C-phycocyanin. However, because there were too few in situ measurements to calibrate the OLCI sensor in the present study, the computed ratio is presented as an index of relative reflectance and used to map potential phycocyanin distribution (Woźniak et al. Citation2016). Further, all maps were overlaid by original satellite true color (RGB) images for pixels that had been masked; we masked land pixels using a waterbody layer in Sentinel-3 products, while a mask for OLCI pixels with thick snow on lake ice was applied following Su et al. (Citation2019). Finally, OLCI images were compared visually with those from less productive Last Mountain Lake, where the blue-ice phenomenon had not yet been reported.
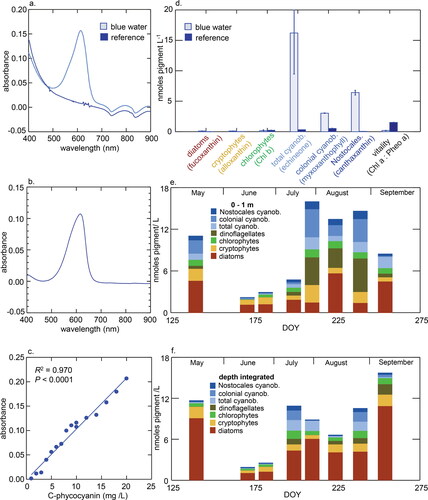
Figure 2. Pigment properties of water from Pasqua Lake and reference samples. (a) Absorbance spectrum of filtered water (0.45 μm pore) from nearshore site C (light blue) and mid-lake reference site A (dark line) between 400 and 900 nm. (b) Absorbance spectrum of laboratory grade C-phycocyanin from Spirulina, 400–900 nm. (c) Calibration curve relating absorbance at 620 nm to the mass of C-phycocyanin from Spirulina; Absorbance = 0.010 × (mg C-phycocyanin/L) – 0.001. (d) Biomarker pigment composition of particulate organic matter (POM) collected from blue water site C (light blue) and mid-lake reference site A (dark blue), as well as ratio of undegraded Chl-a to its main degradation product pheophytin a (Chl-a:Pheo-a). Changes in carotenoid composition (nmol pigment/L) in Pasqua Lake May–Sep 2020 for (e) 1 m depth surface samples, and (f) depth-integrated water samples. In both cases, concentrations (nmol pigment/L) include pigments from total cyanobacteria (echinenone), colonial cyanobacteria (myxoxanthophyll), Nostocales cyanobacteria (canthaxanthin), dinoflagellates (peridinin), chlorophytes (Chl-b), cryptophytes (alloxanthin), and diatoms (diatoxanthin).
Results and discussion
The presence of blue ice and underlying blue water was reported for multiple sites in Pasqua Lake during the second week of March 2021 (sites B–D, ). Subsequently, blue ice and water were reported on social media for the western end of Echo Lake. In these instances, intense staining was observed within 100 m of lakeshore, often where snow cover was limited or had been compressed due to vehicular traffic of ice fishers and other recreational users (). Sampling holes revealed interbedded layers of blue and white ice. Visual inspection of water samples by WSA personnel suggested that the darkest discoloration occurred in the uppermost waters rather than in samples 1–2 m below the ice sheet. Ice-fishing holes were filled with blue water for which the color was stable for several weeks in the laboratory at 10 C in the dark after filtration through GF/C filters (). Neither blue ice nor blue water was reported by the public or WSA for central stations on Pasqua Lake (e.g., site A), although it is unknown whether that reflected the absence of discoloration or lower human traffic and reporting. Subsequent interviews with individual scientists and members of the public suggested that the blue ice phenomenon had not been recorded during at least the past 25 yr (Haig and Leavitt Citation2019) nor in the living memory of members of Pasqua First Nations, whose reserve is located on the southern shore of Pasqua Lake ().
Spectrophotometric analysis revealed strong absorbance by GF/C-filtered water between 500 and 650 nm at blue-water nearshore locations but not at the central reference station (). For example, the absorbance maximum at site C occurred between 608 and 620 nm, with a slight shoulder at 545–575 nm. This aqueous spectrum was similar to that of technical-grade C-phycocyanin purified from Spirulina in deionized water (). Application of the calibration curve relating absorbance to dissolved mass of C-phycocyanin () to the blue-water samples ( and ) suggested that nearshore concentrations of pigment were up to 14 mg C-phycocyanin/L.
Analysis of POM on the GF/C filters using HPLC () revealed that late winter blue-water samples from nearshore sites had elevated concentrations of biomarker pigments from colonial cyanobacteria, including echinenone (all cyanobacteria), myxoxanthophyll (colonial cyanobacteria), and canthaxanthin (Nostocales cyanobacteria), but not those from other phytoplankton, including diatoms (fucoxanthin), cryptophytes (alloxanthin), chlorophytes (Chl-b), or dinoflagellates (peridinin). At site C, concentrations of cyanobacterial pigments in March 2021 were up to 10-fold greater than values observed at any point in the preceding the 2020 ice-free season, either in samples collected from the surface 1 m () or in depth-integrated waters (), despite surface blooms of cyanobacteria being abundant in Pasqua Lake after mid July (Supplementary material, ). Based on carotenoid concentrations, Chl-a in blue-water samples should have exceeded 500 μg/L had live cyanobacteria been present. In contrast, HPLC pigment concentrations were several orders of magnitude lower at the central reference location (site A) than at either winter nearshore or previous summer stations, although winter samples at site A also included mainly biomarkers from colonial cyanobacteria (echinenone, myxoxanthophyll, canthaxanthin) and chlorophytes (Chl-b; ). Analysis of Chl-a:Pheo-a ratios suggested that particulate matter was largely detrital, particularly in the blue-water region, where ratios (0.19 ± 0.4) were 10-fold lower than mid-lake values (1.51 ± 0.03) and 100-fold less than the expected ratio in regional live phytoplankton assemblages (∼15; Bergbusch et al. Citation2021). Together, these observations suggest that blue staining of ice and water arose because exceptionally high densities of colonial cyanobacteria were trapped in nearshore ice and released their water-soluble pigment C-phycocyanin, possibly due to repeated freezing and thawing, a process known to extract that pigment (Horváth et al. Citation2013).
Maps of Rrs620 nm/Rrs709 nm ratios suggested that C-phycocyanin-like signals were strongly concentrated at the margins of Pasqua Lake from the date of initial detection during the first week of March until at least early April 2021 (, Supplementary material, ). On all dates of satellite reconnaissance, reflectance ratios were usually much lower at blue-water sites than at the central reference site (Supplementary material, ), consistent with observed patterns of discoloration within the lake. Analysis of spatial and temporal patterns in Rrs620 nm/Rrs709 nm ratios showed no obvious trend in nearshore pixels, but provided evidence that overall reflectance ratios declined during March, likely due to a loss of fresh snow cover from the lake surface (Supplementary material, and ). Given that all blue-water sites (B–D) exhibited Rrs620 nm/Rrs709 nm ratios of ∼0.9 (), we used that threshold to estimate that 0.68 ± 0.24 km2 (4.25 ± 1.5%) of the Pasqua Lake area (16.02 km2) could have exhibited marked blue discoloration (Supplementary material, ). Using these data, we further estimated that staining occurred mainly within 50 m of lakeshore by assuming that the area of blue water was evenly distributed around the lake margin (see Supplementary material, ). Finally, comparison of OLCI maps from nearby eutrophic Last Mountain Lake (Supplementary material, ) suggested that intense episodes of blue ice were more common in Pasqua Lake than at Last Mountain Lake, consistent with regional reports from the public.
Figure 3. Satellite maps of cyanobacterial bloom occurrence on Pasqua Lake (central, eastern basins) and Echo Lake (western basin) in Saskatchewan, Canada. (a) Heat map of reflectance ratio Ref620 nm/Ref709 nm on 5 April 2021 as detected by Sentinel-3A/B OLCI sensor, corrected for cloud cover and adjacency effect. Hot (red) colors indicate maximal relative absorbance at 620 nm and potentially high concentrations of C-phycocyanin (e.g., Sites B, C, D), whereas cool (blue, green) colors show minimal absorbance at 620 nm and infer limited blue discoloration (Site A). (b) Heat map of surface water Chl concentrations in Pasqua Lake, 19 September 2020, as detected by Sentinel-2A/2B sensor. Hot (red) colors indicate elevated concentrations of Chl-a, whereas cool (blue, green) colors indicated low chlorophyll content (as μg/L). (c) Nearshore accumulation of decaying Aphanizomenon flos-aquae at outlet of Pasqua and Echo lakes, 19 October 2020. Photo courtesy of Aura Lee MacPherson. (d) Relative (%) total biomass of cells in surface 1 m sample from outlet of Pasqua and Echo lakes, 19 October 2020. See Supplementary material, , for details. DOY = calendar day of year. See Supplementary material, Figure S4, for spectral response of sampling points (A, B, C, D) acquired from an OLCI image on 5 April 2021.
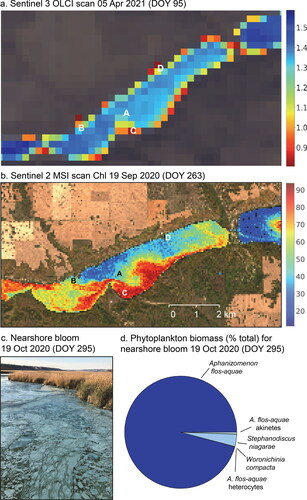
Surface blooms of Aphanizomenon flos-aquae during late October 2020 may have concentrated cyanobacteria to the margins of Pasqua Lake and favored their entrapment in rapidly forming nearshore ice (). In particular, rafts of senescent cyanobacteria were observed on the shorelines of Pasqua, Echo, and downstream Crooked lakes during late October 2020. Microscopic analysis of one such bloom at the outflow of Pasqua and Echo lakes (, Supplementary material, ) revealed high concentrations of cells, heterocytes, and akinetes from A. flos-aquae, as well as other cyanobacteria and eutrophic diatoms (Stephanodiscus niagarae) typical of these lakes (Hall et al. Citation1999, Dixit et al. Citation2000, Donald et al. Citation2013). The presence of surface blooms of diazotrophic cyanobacteria in October has not been recorded previously for regional lakes, as non-N2-fixing taxa such as Planktothrix and Limnothrix spp. typically predominate by mid September due to rapidly diminishing irradiance and water temperature (Leavitt et al. Citation2006, Donald et al. Citation2013, Hayes et al. Citation2019). However, under-ice blooms of Aphanizomenon have been reported recently from eutrophic lakes in agricultural areas of Poland and the Ukraine (Wejnerowski et al. Citation2018, Shcherbak et al. Citation2019), possibly reflecting increased lake heating during late fall in the northern hemisphere (Woolway et al. Citation2021), and are also known in winter from some ice-free maritime lakes (Davies Citation2004).
Analysis of Chl-a maps derived from Sentinel 2 MSI images also suggested that the blue-ice phenomenon may have arisen because late fall blooms of cyanobacteria were located mainly in nearshore regions (, Supplementary material, ). Time series of satellite images showed that intense blooms of phytoplankton (up to 100 μg Chl-a/L) arose in the shallower central basin before moving into the deep eastern basin along either the north or south shore (Supplementary material, ). As in other years, spring blooms of diatoms and cryptophytes (McGowan et al. Citation2005) declined during the June clearwater phase (Dröscher et al. Citation2009) before leading to late-summer cyanobacteria maxima (Hayes et al. Citation2019) that were sustained into September (). In general, mean satellite-inferred Chl-a levels in the eastern basin (∼40–60 μg Chl-a/L) during August and September were similar to those recorded by coeval sampling by WSA (∼50 μg Chl-a/L; Supplementary material, ). However, satellite images also revealed that blooms continued during October after in situ monitoring had concluded and that just prior to ice formation in early November, elevated concentrations of chlorophyll (∼20 μg Chl-a/L) were recorded throughout the littoral zone of Pasqua Lake (Supplementary material, ).
Conclusions
Interactions between unprecedented rates of atmospheric warming and excessive nutrient influx have created conditions in which surface waters may experience novel conditions that cannot be anticipated from extrapolation of antecedent environments, a phenomenon known as “ecological surprises” (Christensen et al. Citation2006, Filbee-Dexter et al. Citation2017). Here we used analysis of in situ pigmentation from phytoplankton and remote sensing to document the first widespread and marked blue discoloration of nearshore ice and lake water in late winter and early spring. Analyses suggest that this new phenomenon arose when exceptional late fall blooms of Aphanizomenon flos-aquae were trapped in rapidly forming littoral ice, frozen, and released water-soluble C-phycocyanin. Such late blooms of Aphanizomenon spp. are becoming more common in highly eutrophic lakes (e.g., Wejnerowski et al. Citation2018, Shcherbak et al. Citation2019), possibly reflecting changes in fall heat waves in lakes (Woolway et al. Citation2021), which favor continued growth of warmwater taxa (Hayes et al. Citation2019). Further, as late fall littoral blooms had high levels of Aphanizomenon akinetes (), and this species colonizes the water column from littoral deposits of akinetes, this warming may initiate a feedback loop to favor earlier and more profound cyanobacterial outbreaks, as has been documented recently for these lakes (Hayes et al. Citation2019). Given that toxic blooms are common in the Canadian Prairies (Orihel et al. Citation2012, Hayes et al. Citation2019) and regional climate is forecast to warm by ∼5 C by 2050, particularly during the colder seasons (Sauchyn et al. Citation2020), autumnal blooms and late winter blue discoloration may become much more common.
Fortunately, blue-ice events did not coincide with greatly increased levels of common cyanobacterial toxins. Specifically, observed concentrations of microcystin (∼0.2 μg/L) were well below drinking-water advisories for the United States (1.0 μg/L) and Canada (1.5 μg/L). In contrast, concentrations of cyanobacterial pigments in blue-ice fields () were up to 10-fold greater than those observed during previous summer blooms when Chl-a was ∼50 μg L−1 (). Long-term monitoring of Pasqua Lake demonstrates that concentrations of the hepatotoxin microcystin can exceed 20 μg/L during summer bloom events (), values nearly twice the Health Canada proposed recreational contact advisory (Hayes et al. Citation2019). Together, these observations suggest that toxin content of blue waters could have been as high as 200 μg microcystin/L, levels higher than seen elsewhere in Canada and well above acute health advisory thresholds (Orihel et al. Citation2012). We hypothesize that low microcystin content in blue-ice samples may arise because Aphanizomenon species can have lower microcystin content than other cyanobacteria (Hayes et al. Citation2019), cellular quotas of toxin are normally highest in actively growing populations and decline with bloom senescence (Finlay et al. Citation2010b), and C-phycocyanin is known to catalyze photodegradation of microcystins (Song et al. Citation2007). Although further research is required, it appears initially that there is no acute health threat associated with lake discoloration.
Further research is also needed to determine the extent of lake discoloration by C-phycocyanin (Arii et al. Citation2015). Although Sentinel 3 A/B with OLCI sensors provides approximations of C-phycocyanin and cyanobacterial abundance during summer (Mishra et al. Citation2019, Ogashawara Citation2019), ours was the first attempt to use remote-sensed images to document the presence of the pigment under late winter conditions. Here we found that intense blue discoloration at 3 field sites corresponded well to Rrs620 nm/Rrs709 nm ratios ≤0.9, but also noted that the presence of fresh snow introduced bias and overestimated the extent of blue discoloration (Supplementary material, ). Use of simple band ratios to estimate C-phycocyanin concentrations can be difficult in optically complex environments (Matthews Citation2011, Stumpf et al. Citation2016); however, its use in this instance is justified because of the absence of physical or biologically induced turbidity during the period of analysis. Nonetheless, much more extensive ground validation will be required to refine the use of satellite imagery to detect the blue-ice phenomenon, as seasonal changes in snow cover, adjacency effect, spectral characteristics of lake water, and the distribution, composition, and cause of blooms all need to be further constrained. Nonetheless, this promising first report suggests that some future ecological surprises may be detectable in near real time using the next generation of orbital platforms.
Ecological surprises, such as marked blue discoloration of lake ice and water, may be particularly challenging for lake managers. Although research on early-warning indicators is ongoing (Carpenter Citation2003), forecasts are usually not available for novel events, even when there exist extensive real-time monitoring programs (e.g., Myers et al. Citation1997). This issue is likely to become more pronounced in the coming decades, as human population, resource use, atmospheric temperatures, and nutrient fluxes move beyond their historical ranges and appear to change without precedent (Magnuson Citation1990). In our experience, rapid governmental and academic response to public concerns (<1 week from first report to identified cause), including use of traditional and social media platforms, reduced public anxiety over potential proximate causes of the discoloration (septic leaks, antifreeze spills, cryptic urban pollution, waste dumping, etc.) and improved institutional trust by the public. In particular, we note that coordinated collaboration between governmental and academic agencies may provide a valuable model for addressing future sudden environmental challenges.
Author contribution statement
HAH, AMC, and PRL designed the study. HAH and J-MD coordinated summer and winter field sampling for SWSA. DB coordinated summer sampling for UR and conducted pigment analyses. AMC conducted remote sensing analysis. PRL drafted the manuscript. All authors edited the manuscript and approved the final article.
Supplemental Material
Download PDF (1.1 MB)Acknowledgments
We thank members of the University of Regina and Saskatchewan Water Security Agency field teams for assistance with sample collection. We thank L. Bedel, T. Kleim, and AL MacPherson for photographs, W. Kolsher for the morphometric map of Pasqua Lake, and C. Gushulak and 3 anonymous reviewers for critical reviews. We acknowledge that the study lakes are located on Treaty 4 territory, homelands of the Cree, Saulteaux, Dakota, Lakota, Nakota, and Métis people. We thank the First Nations of Saskatchewan for sharing and protecting the water resources. This is a contribution of the Qu’Appelle Valley long-term ecological research program (QU-LTER). Analyses presented in this article do not necessarily reflect the opinions or official position of the Saskatchewan Water Security Agency or the Government of Saskatchewan.
Funding
This work was supported by the NSERC Canada Discovery Grants program, Canada Research Chairs, Canada Foundation for Innovation, the Province of Saskatchewan, and the University of Regina.
Related Research Data
References
- Arii S, Tsuji K, Tomita K, Hasegawa M, Bober B, Harada K-I. 2015. Cyanobacterial blue color formation during lysis under natural conditions. Appl Environ Microbiol. 81(8):2667–2675. doi:https://doi.org/10.1128/AEM.03729-14.
- Bergbusch NT, Hayes NM, Simpson GL, Leavitt PR. 2021. Unexpected shift from phytoplankton to periphyton in eutrophic streams due to wastewater influx. Limnol Oceanogr. 66(7):2745–2761. doi:https://doi.org/10.1002/lno.11786.
- Binding CE, Greenberg TA, Bukata RP, Smith DE, Twiss MR. 2012. The MERIS MCI and its potential for satellite detection of winter diatom blooms on partially ice-covered Lake Erie. J Plankton Res. 34(6):569–573. doi:https://doi.org/10.1093/plankt/fbs021.
- Birk S, Chapman D, Carvalho L, Spears BM, Andersen HE, Argillier C, Auer S, Baattrup-Pedersen A, Banin L, Beklioğlu M, et al. 2020. Impacts of multiple stressors on freshwater biota across spatial scales and ecosystems. Nat Ecol Evol. 4(8):1060–1068. doi:https://doi.org/10.1038/s41559-020-1216-4.
- Bogard MJ, Vogt RJ, Hayes NM, Leavitt PR. 2020. Unabated nitrogen pollution favors growth of toxic cyanobacteria over chlorophytes in most hypereutrophic lakes. Environ Sci Technol. 54(6):3219–3227. doi:https://doi.org/10.1021/acs.est.9b06299.
- Carey CC, Ewing HA, Cottingham KL, Weathers KC, Thomas RQ, Haney JF. 2012. Occurrence and toxicity of the cyanobacterium Gloeotrichia echinulata in low-nutrient lakes in the northeastern United States. Aquat Ecol. 46(4):395–409. doi:https://doi.org/10.1007/s10452-012-9409-9.
- Carpenter SR. 2003. Regime shifts in lake ecosystems: pattern and variation. Excellence in ecology 15. Oldendorf (Germany): International Ecology Institute.
- Carpenter SR, Caraco NF, Correll DL, Howarth RW, Sharpley AN, Smith VH. 1998. Nonpoint pollution of surface waters with phosphorus. Ecol Appl. 8(3):559–568.doi:https://doi.org/10.1890/1051-0761(1998)008.
- Chegoonian AM, Zolfaghari K, Baulch HM, Dugay CR. 2021. Support vector regressions for chlorophyll-a estimation using Sentinel-2 images in small water bodies. Proc. IEEE IGARSS, Brussels, Belgium, pp. 7449–7452, doi:https://doi.org/10.1109/IGARSS47720.2021.9554110.
- Christensen MR, Graham MD, Vinebrooke RD, Findlay DL, Paterson MJ, Turner MA. 2006. Multiple anthropogenic stressors cause ecological surprises in boreal lakes. Global Change Biol. 12(12):2316–2322. doi:https://doi.org/10.1111/j.1365-2486.2006.01257.x.
- Davies J-M. 2004. Linking ecology and management of water quality: the distribution and growth of phytoplankton in coastal lakes of British Columbia [dissertation]. University of Victoria.
- Davies J-M. 2006. Application of the Canadian Water Quality Index for assessing changes in water quality along the Qu’Appelle River, Saskatchewan, Canada. Lake Reserv Manag. 22(4):308–320. doi:https://doi.org/10.1080/07438140609354365.
- De Keukelaere L, Sterckx S, Adriaensen S, Knaeps E, Reusen I, Giardino C, Bresciani M, Hunter P, Neil C, Van der Zande D, et al. 2018. Atmospheric correction of Landsat-8/OLI and Sentinel-2/MSI data using iCOR algorithm: validation for coastal and inland waters. Eur J Remote Sens. 51(1):525–542. doi:https://doi.org/10.1080/22797254.2018.1457937.
- Dickey JWE, Coughlan NE, Dick JTA, Médoc V, McCard M, Leavitt PR, Lacroix G, Fiorini S, Millot A, Cuthbert RN. 2021. Breathing space: deoxygenation of aquatic environments can drive differential ecological impacts across biological invasion stages. Biol Invasions. 23(9):2831–2847. doi:https://doi.org/10.1007/s10530-021-02542-3.
- Dixit AS, Hall RI, Leavitt PR, Smol JP, Quinlan R. 2000. Effects of sequential depositional basins on lake response to urban and agricultural pollution: a paleoecological analysis of the Qu’Appelle Valley, Saskatchewan, Canada. Freshwat Biol. 43(3):319–338. doi:https://doi.org/10.1046/j.1365-2427.2000.00516.x.
- Donald DB, Bogard MJ, Finlay K, Bunting L, Leavitt PR. 2013. Phytoplankton-specific response to enrichment of phosphorus-rich surface waters with ammonium, nitrate and urea. PLOS One. 8(1):e53277. doi:https://doi.org/10.1371/journal.pone.0053277.
- Downing JA, Polasky S, Olmstead SM, Newbold SC. 2021. Protecting local water quality has global benefits. Nat Commun. 12(1):2709. doi:https://doi.org/10.1038/s41467-021-22836-3.
- Dröscher I, Patoine A, Finlay K, Leavitt PR. 2009. Climate control of spring clear-water phase through the transfer of energy and mass to lakes. Limnol Oceanogr. 54(6part2):2469–2480. doi:https://doi.org/10.4319/lo.2009.54.6_part_2.2469.
- [EEA] European Environmental Agency. 2018. European waters: assessment of status and pressures 2018. (Brussels): European Environment Agency [cited Apr 2021]. https://www.eea.europa.eu/publications/state-of-water/.
- [ESA] European Space Agency. 2021a. Sentinel-2 MSI technical guide [cited Apr 2021]. https://sentinel.esa.int/web/sentinel/technical-guides/sentinel-2-msi.
- [ESA] European Space Agency. 2021b. Sentinel-3 OLCI technical guide [cited Apr 2021]. https://sentinel.esa.int/web/sentinel/technical-guides/sentinel-3-olci.
- Ewing HA, Weathers KC, Cottingham KL, Leavitt PR, Greer ML, Carey CC, Steele BG, Fiorillo AU, Sowles JP. 2020. “New” cyanobacterial blooms are not new: two centuries of lake production are related to ice cover and land use. Ecosphere 11(6):e03170. doi:https://doi.org/10.1002/ecs2.3170.
- Filbee-Dexter K, Pittman J, Haig HA, Alexander SM, Symons CC, Burke MJ. 2017. Ecological surprise: concept, synthesis, and social dimensions. Ecosphere 8(12):e02005. doi:https://doi.org/10.1002/ecs2.2005.
- Findlay DL, Kasian SEM. 1987. Phytoplankton community responses to nutrient addition in Lake 226, Experimental Lakes Area, Northwestern Ontario. Can J Fish Aquat Sci. 44 (S1):s35–s46. doi:https://doi.org/10.1139/f87-278.
- Finlay K, Leavitt PR, Patoine A, Patoine A, Wissel B. 2010a. Magnitudes and controls of organic and inorganic carbon flux through a chain of hard-water lakes on the northern Great Plains. Limnol Oceanogr. 55(4):1551–1564. doi:https://doi.org/10.4319/lo.2010.55.4.1551.
- Finlay K, Patoine A, Donald DB, Bogard MJ, Leavitt PR. 2010b. Experimental evidence that pollution with urea can degrade water quality in phosphorus-rich lakes of the northern Great Plains. Limnol Oceanogr. 55(3):1213–1230. doi:https://doi.org/10.4319/lo.2010.55.3.1213.
- Finlay K, Vogt RJ, Simpson GL, Leavitt PR. 2019. Seasonal interdependence of pCO2 and CO2 flux in a hardwater lake of the northern Great Plains: the legacy effect of climate and limnological conditions during 36 years. Limnol Oceanogr. 64:S118–S129. doi:https://doi.org/10.1002/lno.11113.
- Haig HA, Hayes NM, Simpson GL, Yi Y, Wissel B, Hodder KR, Leavitt PR. 2020. Comparison of isotopic mass balance and instrumental techniques as estimates of basin hydrology in seven connected lakes over 12 years. J Hydrol. 6:100046. doi:https://doi.org/10.1016/j.hydroa.2019.100046.
- Haig HA, Leavitt PR. 2019. The Qu’Appelle Long-Term Ecological Research program: a 26-yr hierarchical platform to study freshwater ecosystems of the northern Great Plains. Limnol Oceanogr Bull. 28(3):99–103. doi:https://doi.org/10.1002/lob.10337.
- Hall RI, Leavitt PR, Quinlan R, Dixit AS, Smol JP. 1999. Effects of agriculture, urbanization and climate on water quality in the northern Great Plains. Limnol Oceanogr. 44(3part2):739–756. doi:https://doi.org/10.4319/lo.1999.44.3_part_2.0739.
- Hayes NM, Patoine A, Haig HA, Simpson GL, Swarbrick VJ, Wiik E, Leavitt PR. 2019. Spatial and temporal variation in nitrogen fixation and its importance to phytoplankton growth in phosphorus-rich lakes. Freshw Biol. 64(2):269–283. doi:https://doi.org/10.1111/fwb.13214.
- Horváth H, Kovács A, Riddick C, Présing M. 2013. Extraction methods for phycocyanin determination in freshwater filamentous cyanobacteria and their application in a shallow lake. Eur J Phycol. 48(3):278–286. doi:https://doi.org/10.1080/09670262.2013.821525.
- Huisman J, Codd GA, Paerl HW, Ibelings BW, Verspagen JMH, Visser PM. 2018. Cyanobacterial blooms. Nat Rev Microbiol. 16(8):471–483. doi:https://doi.org/10.1038/s41579-018-0040-1.
- Jane SF, Hansen GJA, Kraemer BM, Leavitt PR, Mincer JL, North RL, Pilla RM, Stetler JT, Williamson CE, Woolway RI, et al. 2021. Widespread deoxygenation of temperate lakes. Nature 594(7861):66–70. doi:https://doi.org/10.1038/s41586-021-03550-y.
- Jeffrey SW, Humphrey GF. 1975. New spectrophotometric equations for determining chlorophylls a, b, c1 and c2 in higher plants, algae and natural phytoplankton. Biochem Physiol Pfl. 167(2):191–194. doi:https://doi.org/10.1016/s0015-379630778-3.
- Jeppesen E, Søndergaard M, Jensen JP, Havens KE, Anneville O, Carvalho L, Coveney MF, Deneke R, Dokulil MT, Foy B, et al. 2005. Lake responses to reduced nutrient loading—an analysis of contemporary long-term data from 35 case studies. Freshwater Biol. 50(10):1747–1771. doi:https://doi.org/10.1111/j.1365-2427.2005.01415.x.
- Kraemer BM, Pilla RM, Woolway RI, Anneville O, Ban S, Colom-Montero W, Devlin SP, Dokulil MT, Gaiser EE, Hambright KD, et al. 2021. Climate change drives widespread shifts in lake thermal habitat. Nat Clim Change. 11(6):521–529. doi:https://doi.org/10.1038/s41558-021-01060-3.
- Le Moal M, Gascuel-Odoux C, Ménesguen A, Souchon Y, Étrillard C, Levain A, Moatar F, Pannard A, Souchu P, Lefebvre A, et al. 2019. Eutrophication: a new wine in an old bottle? Sci Total Environ. 651(Pt 1):1–11. doi:https://doi.org/10.1016/j.scitotenv.2018.09.139.
- Leavitt PR, Brock CS, Ebel C, Patoine A. 2006. Landscape-scale effects of urban nitrogen on a chain of freshwater lakes in central North America. Limnol Oceanogr. 51(5):2262–2277. doi: 319/lo.2006.51.5.2262 doi:https://doi.org/10.4319/lo.2006.51.5.2262.
- Leavitt PR, Hodgson DA. 2001. Sedimentary pigments. In: Smol JP, Birks HJB, Last WM, editors. Tracking environmental change using lake sediments. Volume 3: terrestrial, algal and siliceous indicators. Boston (MA): Kluwer. p. 295–325. doi:https://doi.org/10.1007/0-306-47668-1_15.
- Lu C, Tian H. 2017. Global nitrogen and phosphorus fertilizer use for agriculture production in the past half century: shifted hot spots and nutrient imbalance. Earth Syst Sci Data. 9(1):181–192. doi:https://doi.org/10.5194/essd-9-181-2017.
- Magnuson JJ. 1990. Long-term ecological research and the invisible present. BioScience. 40(7):495–501. doi:https://doi.org/10.2307/1311317.
- Matthews MW. 2011. A current review of empirical procedures of remote sensing in inland and near-coastal transitional waters. Inter J Remote Sens. 32(21):6855–6899. doi:https://doi.org/10.1080/01431161.2010.512947.
- McGowan S, Patoine A, Graham MD, Leavitt PR. 2005. Intrinsic and extrinsic controls of lake phytoplankton synchrony. Verh Int Verein Limnol. 29(2):794–798. doi:https://doi.org/10.1080/03680770.2005.11902787.
- Millennium Ecosystem Assessment. 2005. Ecosystems and human well-being. Vol. 1. Current state and trends. Washington (DC): Island Press.
- Mishra S, Stumpf RP, Schaeffer BA, Werdell PJ, Loftin KA, Meredith A. 2019. Measurement of cyanobacterial bloom magnitude using satellite remote sensing. Sci Rep. 9(1):18310. doi:https://doi.org/10.1038/s41598-019-54453-y.
- Myers RA, Hutchings JA, Barrowman NJ. 1997. Why do fish stocks collapse? The example of cod in Atlantic Canada. Ecol Appl. 7(1):91–106. doi:https://doi.org/10.1890/1051-0761(1997)007.
- Ogashawara I. 2019. The use of Sentinel-3 imagery to monitor cyanobacterial blooms. Environments 6(6):60. doi:https://doi.org/10.3390/environments6060060.
- Olivier JGJ, Peters JAHW. 2020. Trends in global CO2 and total greenhouse gas emissions: 2020 report. The Hague (The Netherlands): PBL Netherlands Environmental Assessment Agency.
- Orihel DM, Bird DF, Brylinsky M, Chen H, Donald DB, Huang DY, Giani A, Kinniburgh D, Kling H, Kotak BG, et al. 2012. High microcystin concentrations occur only at low nitrogen-to-phosphorus ratios in nutrient-rich lakes. Can J Fish Aquat Sci. 69(9):1457–1462. doi:https://doi.org/10.1139/f2012-088.
- Pahlevan N, Mangin A, Balasubramanian SV, Smith B, Alikas K, Arai K, Barbosa C, Bélanger S, Binding C, Bresciani M, et al. 2021. ACIX-Aqua: a global assessment of atmospheric correction methods for Landsat-8 and Sentinel-2 over lakes, rivers, and coastal waters. Remote Sens Environ. 258. doi:https://doi.org/10.1016/j.rse.2021.112366.
- Pahlevan N, Smith B, Schalles J, Binding C, Cao Z, Ma R, Alikas K, Kangro K, Gurlin D, Hà N, et al. 2020. Seamless retrievals of chlorophyll-a from Sentinel-2 (MSI) and Sentinel-3 (OLCI) in inland and coastal waters: a machine-learning approach. Remote Sens Environ. 240. doi:https://doi.org/10.1016/j.rse.2019.111604.
- Sauchyn DJ, Davidson D, Johnston M. 2020. Prairie provinces. In: Warren FJ, Lulham N, Lemmen DS, editors. Canada in a changing climate: regional perspectives report. Ottawa (ON): Government of Canada. p. 72.
- Sechidis K, Sperrin M, Petherick ES, Luján M, Brown G. 2017. Dealing with under-reported variables: an information theoretic solution. Int J Approx Reason. 85:159–177. doi:https://doi.org/10.1016/j.ijar.2017.04.002.
- Scheffer M, Carpenter SR, Foley JA, Folke C, Walker B. 2001. Catastrophic shifts in ecosystems. Nature 413(6856):591–596. doi:https://doi.org/10.1038/35098000.
- Schindler DW. 1977. Evolution of phosphorus limitation in lakes. Science 195(4275):260–262. doi:https://doi.org/10.1126/science.195.4275.260.
- Schindler DW, Vallentyne JR. 2008. The algal bowl: over-fertilization of the world’s freshwaters and estuaries. New York (NY): Routledge.
- Sharma S, Blagrave K, Magnuson JJ, O’Reilly CM, Oliver S, Batt RD, Magee MR, Straile D, Weyhenmeyer GA, Winslow L, et al. 2019. Widespread loss of lake ice around the Northern Hemisphere in a warming world. Nat Clim Change. 9(3):227–231. doi:https://doi.org/10.1038/s41558-018-0393-5.
- Shcherbak VI, Semenyuk NY, Linchuk MI. 2019. Winter under the ice water bloom formed by Aphanizomenon gracile Lemmermann. Hydrob J. 55(5):20–34. doi:https://doi.org/10.1615/HydrobJ.v55.i5.20.
- Simis SGH, Peters SWM, Gons HJ. 2005. Remote sensing of the cyanobacterial pigment phycocyanin in turbid inland water. Limnol Oceanogr. 50(1):237–245. doi:https://doi.org/10.4319/lo.2005.50.1.0237.
- Smol JP. 2008. Pollution of lakes and rivers: a paleoenvironmental perspective. New York (NY): Wiley.
- Sobiechowska-Sasim M, Stoń-Egiert J, Kosakowska A. 2014. Quantitative analysis of extracted phycobilin pigments in cyanobacteria-an assessment of spectrophotometric and spectrofluorometric methods. J Appl Phycol. 26(5):2065–2074. doi:https://doi.org/10.1007/s10811-014-0244-3.
- Song W, Bardowell S, O’Shea KE. 2007. Mechanistic study and the influence of oxygen on the photosensitized transformations of microcystins (cyanotoxins). Environ Sci Technol. 41(15):5336–5341. doi:https://doi.org/10.1021/es063066o.
- Stainton MP, Capel MJ, Armstrong FAJ. 1977. The chemical analysis of freshwater. 2nd ed. Miscellaneous Special Publication No. 25. Winnipeg (MB): Fisheries and Environment Canada, Fisheries and Marine Service.
- Sterckx S, Knaeps S, Kratzer S, Ruddick K. 2015. SIMilarity Environment Correction (SIMEC) applied to MERIS data over inland and coastal waters. Remote Sens Environ. 157:96–110. doi:https://doi.org/10.1016/j.rse.2014.06.017.
- Stumpf RP, Davis TW, Wynne TT, Graham JL, Loftin KA, Johengen TH, Gossiaux D, Palladino D, Burtner A. 2016. Challenges for mapping cyanotoxin patterns from remote sensing of cyanobacteria. Harmful Algae. 54:160–173. doi:https://doi.org/10.1016/j.hal.2016.01.005.
- Su H, Ji B, Wang Y. 2019. Sea ice extent detection in the Bohai Sea using Sentinel-3 OLCI data. Remote Sens. 11(20):2436. doi:https://doi.org/10.3390/rs11202436.
- Taranu ZE, Gregory-Eaves I, Leavitt PR, Bunting L, Buchaca T, Catalan J, Domaizon I, Guilizzoni P, Lami A, McGowan S, et al. 2015. Acceleration of cyanobacterial dominance in north temperate-subarctic lakes during the Anthropocene. Ecol Lett. 18(4):375–384. doi:https://doi.org/10.1111/ele.12420.
- [UNDESA] United Nations, Department of Economic and Social Affairs, Population Division. 2019. World population prospects 2019: highlights (ST/ESA/SER.A/423) [cited 20 May 2021]. https://population.un.org/wpp/.
- Utermöhl H. 1958. Zur Vervollkommnung der quantitativen Phytoplankton-methodik. Mittellungen Int Vererin Limnol. 9(1):1–38. doi:https://doi.org/10.1080/05384680.1958.11904091.
- Vanhellemont Q. 2019. Adaptation of the dark spectrum fitting atmospheric correction for aquatic applications of the Landsat and Sentinel-2 archives. Remote Sens Environ. 225:175–192. doi:https://doi.org/10.1016/j.rse.2019.03.010.
- Vogt RJ, Rusak JA, Patoine A, Leavitt PR. 2011. Differential effects of energy and mass influx on the landscape synchrony of lake ecosystems. Ecology 92(5):1104–1114. doi:https://doi.org/10.1890/10-1846.1.
- Wang J, Wagner ND, Fulton JM, Scott JT. 2021. Diazotrophs modulate phycobiliproteins and nitrogen stoichiometry differently than other cyanobacteria in response to light and nitrogen availability. Limnol Oceanogr. 66(6):2333–2345. doi:https://doi.org/10.1002/lno.11757.
- Wejnerowski L, Rzymski P, Kokociński M, Meriluoto J. 2018. The structure and toxicity of winter cyanobacterial bloom in a eutrophic lake of the temperate zone. Ecotoxicology 27(6):752–760. doi:https://doi.org/10.1007/s10646-018-1957-x.
- Woolway RI, Jennings E, Shatwell T, Golub M, Pierson DC, Maberly SC. 2021. Lake heatwaves under climate change. Nature 589(7842):402–407. doi:https://doi.org/10.1038/s41586-020-03119-1.
- Woźniak M, Bradtke KM, Darecki M, Krężel A. 2016. Empirical model for phycocyanin concentration estimation as an indicator of cyanobacterial bloom in the optically complex coastal waters of the Baltic Sea. Remote Sens. 8(3):212. doi:https://doi.org/10.3390/rs8030212.
- Yan Y, Bao Z, Shao J. 2018. Phycocyanin concentration retrieval in inland waters: a comparative review of the remote sensing techniques and algorithms. J Great Lakes Res. 44(4):748–755. doi:https://doi.org/10.1016/j.jglr.2018.05.004.