
Abstract
Ward NK, Sorice MG, Reynolds MS, Weathers KC, Weng W, Carey CC. 2022. Can interactive data visualizations promote waterfront best management practices? Lake Reserv Manage. 38:95–108.
Lake water quality management often requires private property owner engagement since land-use change generally occurs on private property. Educational components of lake management outreach must connect current property owner behaviors with future water quality. However, it may be challenging for property owners to associate their current behaviors with water quality outcomes due to the time lag between a behavior (e.g., fertilizer application) and a water quality outcome (e.g., decreased water clarity). Interactive data visualizations, characterized by user-determined selections that change visualization output, may be well suited to help property owners connect current behavior to future water quality. We tested the effectiveness of an online, interactive visualization as an educational intervention to alter property owners’ perspectives related to applying lawn fertilizer and installing waterfront buffers. We used cognitive psychology measures to quantify intervention effectiveness. Since property owners’ decision making may be driven by connections to their property, we also explored relationships between seasonal and permanent residents and intentions to apply fertilizer or install waterfront buffers and intervention effectiveness. Despite no significant difference in effectiveness between the interactive and noninteractive versions, the combined responses demonstrated a positive shift in behavioral beliefs and intentions related to lawn fertilizer application and waterfront buffer installation. Seasonal residents were less likely than permanent residents to apply lawn fertilizer before the intervention and more likely to shift their intentions after the intervention. This study provides evidence that brief educational interventions—regardless of their interactivity—can shift private property owner beliefs and intentions regarding lakefront property management.
High water quality (oligotrophic) lakes are rapidly being degraded across the United States (Stoddard et al. Citation2016), requiring effective engagement with private property owners to increase adoption of best management practices to maintain high water quality into the future. Private property owners are essential to protecting future water quality because land-use change, a major driver of change in lakes (Brookes and Carey Citation2011, Martin et al. Citation2017), primarily occurs on private property (Miksa et al. Citation2020). Although engagement with property owners often combines educational and persuasive messaging (Voigt Citation2017) or skill building (Pratt and Bowman Citation2008) to increase new behavior adoption (McKenzie-Mohr et al. Citation2012, Byerly et al. Citation2018), one key to an effective educational component is to enhance understanding of the connection between an individual’s current behavior and their contribution to future environmental outcomes (Schultz Citation2002).
Making the direct connection between current behavior and future water quality can be particularly difficult in oligotrophic lakes, due, in part, to the time lag in observable water quality outcomes as lakes approach a trophic state shift (Carpenter et al. Citation2011, Gsell et al. Citation2016, Martin et al. Citation2017). Additionally, waterfront property owners may not recognize how property management decisions away from their shoreline can affect water quality. Interactive visualizations can be more effective than classic educational materials, such as informational webpages or pamphlets, because they enable the user to explore complex cause–effect relationships (Sedig et al. Citation2014, Xu and Sundar Citation2016) across time (i.e., time lags) and space (e.g., connection of upland decisions to downstream water quality). For example, a visualization in which a user selects different behaviors (e.g., application of lawn fertilizer) that automatically update water quality outcomes (e.g., decreased lake clarity in 10 years) could increase users’ awareness of consequences of their individual behavior. Further, interactive visualizations may overcome barriers to connecting complex ideas (Sedig et al. Citation2014), such as the interactions of encouraged behaviors (e.g., establishment of vegetated buffers along shoreline) with discouraged behaviors (e.g., use of lawn fertilizer). Interactive visualizations have shown promise as educational tools in classroom settings (Fawcett Citation2018) and could improve lake outreach efforts.
Interactive visualizations that connect current behavior with future water quality outcomes work to alter an individual’s beliefs about the perceived consequences of a behavior, which then can influence the individual’s attitudes about the behavior and subsequent intention to act (Fishbein and Ajzen Citation2010). While behavior change is the goal of most outreach efforts, self-reports about behavioral intentions, or what property owners plan to do in the future, serve as a proxy and can be measured rapidly at low cost (Fishbein and Ajzen Citation2010, Sheeran and Webb Citation2016). We focus on behavioral beliefs, which are conceptually similar to understanding the environmental consequences of a behavior, and intended behavior, since behavior change is the goal of the educational intervention.
Since environmental issues are place based, the connection of residents to their property or the lake may be an indirect driver of behavior change. Behavior change can arise from place attachment when the consequences of a behavior threaten the underlying place meanings, or the reasons why people are attached to a place (Stedman Citation2002, Rajala et al. Citation2020). In particular, property owners in high-amenity regions (e.g., lake watersheds with popular recreation tourism) may be more likely to adopt environmentally friendly behavior when they have a strong attachment to the local environmental quality, which they consider under threat (Stedman Citation2002, Brehm et al. Citation2006). Contrary to intuition, seasonal residents can have stronger place attachment than permanent residents and are more likely to hold environmental quality as an important place meaning (Stedman Citation2006, Simoni and Floress Citation2015). Therefore, seasonal residents may be even more likely to respond positively to educational outreach that connects current behavior with threats to environmental quality. Understanding differences in responses to an educational intervention among different target audiences may improve the ability of outreach specialists to tailor educational messaging.
In this study, we test the effectiveness of an online, interactive data visualization as a short-term (∼5 min) educational intervention aimed to overcome one potential barrier to adoption: knowledge of water quality consequences in altering property owners’ behavioral beliefs and intentions toward applying lawn fertilizer (discouraged behavior) and installing waterfront buffers (encouraged behavior). We also explore how seasonal residency may be related to a property owner’s behavioral intentions and response to the educational intervention. We address the following research questions: (1) Do educational outreach online visualizations shift beliefs and intentions to apply lawn fertilizer or install waterfront buffers? (2) Is an interactive visualization more effective than a noninteractive visualization in altering property owners’ beliefs and intentions toward fertilizer use or waterfront buffers? (3) Do responses to the interventions vary between permanent and seasonal residents?
Study site
The Lake Sunapee Region of New Hampshire is in the New Hampshire townships of New London, Sunapee, and Newbury (43°24′ N, 72°3′ W). Lake Sunapee has a maximum depth of 33 m, mean depth of 10 m, surface area of 16.55 km2, volume of 1.88 × 10⁸ m3, and a mean residence time of 3.1 years (Carey et al. Citation2014). Lake Sunapee is an oligotrophic lake, with mean summer epilimnetic total phosphorus less than 5 µg/L and chlorophyll a less than 3 µg/L (Ward et al. Citation2020), and mean summer Secchi disk transparency of 6–8 m (Carey et al. Citation2014).
Lake Sunapee is a drinking-water source (Carey et al. Citation2007) and provides outdoor recreation amenities year-round. Lakefront property values are high in the region and many properties are used as second homes (Cobourn et al. Citation2018). There are multiple lake associations in the region, including the Lake Sunapee Protective Association (LSPA), which was founded in 1898, has more than 1000 members, and has an active education and outreach program, reaching approximately 5000 people each year (Fitchett Citation2019). Lake associations, as community-based action groups, can play a key role in preserving a community’s desired sense of place (Fitchett et al. Citation2020) and can result in higher place attachment among members (Simoni and Floress Citation2015).
Though Lake Sunapee has relatively high water quality, conversion of forest to developed land in the watershed, particularly along the shoreline of the lake, is likely increasing nutrient loading to the lake (Cobourn et al. Citation2018, LSPA et al. 2020, Ward et al. Citation2020). The lake has exhibited a recent increase in cyanobacteria (Cottingham et al. Citation2015) and changes in its metabolism, indicating a shift to a higher trophic state (Richardson et al. Citation2017); however, its trajectory of water quality degradation is likely not easily observable to the general public.
Materials and methods
Sampling and survey administration
Our population of interest was waterfront property owners in the Lake Sunapee Region tritown area, which included the townships of New London (population = 4390), Sunapee (population = 3449), and Newbury (population = 2096; US Census Bureau Citation2019). We identified the primary addresses of waterfront property owners on the tri-town tax assessor website (TriTown NH Citation2021). After removing duplicate primary owners, businesses or other nonhome addresses, and international primary addresses, our sampling frame included 1152 waterfront property households.
All waterfront property households were mailed an introductory letter, inviting one adult member of each household to participate in the study by navigating to a website provided in the letter. We followed a modified tailored design method (Dillman et al. Citation2014) to increase response rate, with 4 mailings per household sent every 2 weeks over the course of 8 weeks from June to August 2020. The first and third mailings were letters and the second and fourth mailing were postcards, each emphasizing the value of their participation in study and directing the recipient to the study website. This research was approved by Virginia Tech’s institutional review board (protocol #20-413), and all participants were provided informed consent to participate. To protect the privacy of participants, only summary statistics of responses are reported (Supplement B).
Study design and participant experience
We conducted a randomized trial combined with pre- and postintervention portions of a survey to test the effectiveness of interactive and noninteractive visualizations in altering participants’ behavioral beliefs and intentions in regard to applying lawn fertilizer and installing waterfront buffers. Users navigated to the website address provided in the invitation letter and participated on their personal computers. Full participation included completing the preintervention portion of the survey (∼15 min), after which participants were randomly and automatically redirected to either the interactive or noninteractive visualization (∼5 min), and then were provided a link within the visualization to the postintervention portion of the survey (∼5 min). The survey was self-administered via Qualtrics software (Qualtrics, Provo, UT). Respondents who indicated they were not the primary decision maker for property landscape management were screened out of the survey. The noninteractive visualization website is available in Supplement A and the interactive visualization website with underlying code and data files are available in Ward (Citation2021). Within the survey, waterfront buffers were defined as “A vegetated buffer is an area of land along the edge of lakes or ponds that has a diversity of trees, shrubs, and unmown vegetation. Mown, manicured lawns and mown grasses are not considered vegetated buffers.” The landing page for the postintervention portion of the survey included descriptive social norm messaging about waterfront buffers (providing information about the prevalence of waterfront buffer use), in line with best practices in environmental outreach (McKenzie-Mohr et al. Citation2012, Byerly et al. Citation2018). This descriptive normative message was not applied to the fertilizer application portion of the survey due to a lack of information quantifying current use of lawn fertilizer in the region (Supplement B).
Both the interactive and noninteractive visualization provided information on how fertilizer application and waterfront buffers on lakefront property relate to future water quality by visually eliminating the lag between today’s land management decisions and the water quality response in approximately 10 years. Both visualizations presented information with the same 3 types of visuals based on specified waterfront buffer and fertilizer conditions: (1) environmental indicator gauges: indicating how much phosphorus is leaving the property into the lake and what the resulting water clarity in the lake may be in 10 yr (); (2) view from the dock: a photo of what water quality may look like from a dock on the lake in 10 yr based on buffer and fertilizer conditions (); and (3) relationship between property and lake: a conceptual diagram highlighting how property decisions relate to changes in water quality (Supplement B). Visualizations of estimated water quality were based on simplified fertilizer transport and runoff relationships and assumed all private property owners in the watershed selected the same behaviors (Supplement B).
Figure 1. Example of 2 different waterfront buffer and fertilizer visualizations of Water Quality Gauges and View From The Dock that respondents could choose in the interactive tool: 100 ft (30.5 m) waterfront buffer and no fertilizer application (Panel A; metric equivalents are 0.34 kg per hectare of phosphorus leaving the property and 6.1 m of water clarity) and 0 ft (0 m) waterfront buffer with high application of phosphorus-containing fertilizer (Panel B; metric equivalents are 3.03 kg per hectare of phosphorus leaving the property and 0.15 m of water clarity). Visualizations are based on estimated water quality outcomes if all private property owners in the watershed selected the same behaviors, calculated from fertilizer transport and runoff relationships (Supplement B).
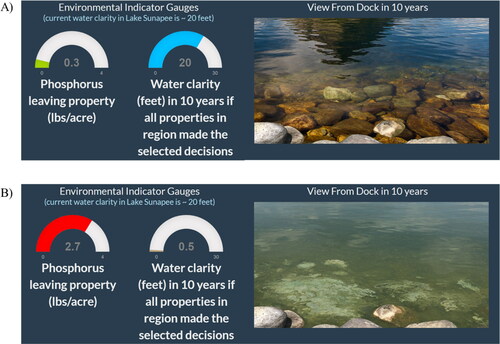
The interactive visualization had a panel on the left with drop-down menus in which participants could select different options related to fertilizer application and waterfront buffers. Participants could select different waterfront buffer and fertilizer use combinations from (1) a waterfront buffer width of 0, 50, or 100 ft (i.e., 0, 15 m, or 30.5 m), and (2) whether to apply lawn fertilizer. If fertilizer application was selected, the participants could then select (2a) the type of fertilizer (phosphorus-free or phosphorus-containing) and (2b) when to apply the fertilizer (during warm and dry weather or during cool or wet weather). As participants selected different options on the left panel, the 3 visualizations immediately and automatically updated to illustrate environmental outcomes based on drop-down menu selections.
The noninteractive visualization provided 6 example scenarios of fertilizer and waterfront buffer combinations that participants read through from top to bottom on a noninteractive webpage. The style and type of visualizations in the noninteractive version were identical to those in the interactive version, although only a selection of the range of possible combinations of buffer size and fertilizer use was presented, for brevity.
Survey metrics
Since the content information presented in the educational intervention was designed to change behavioral beliefs and the ultimate goal of the educational intervention was to alter intended behavior, we assessed self-reported beliefs and intentions related to applying lawn fertilizer and installing a waterfront buffer pre- and postintervention using Likert-type scales that ranged from 1 to 7 (). All scales were coded such that the response most aligned with the educational goal was assigned 7 (e.g., extremely unlikely to apply lawn fertilizer and extremely likely to install a buffer) and the response least aligned with the educational goal was assigned 1 (e.g., extremely likely to apply lawn fertilizer and extremely unlikely to install a buffer). In the preintervention portion of the survey, we measured participants’ connection to their lakefront property, measured by residency status (). We also collected basic demographic information (Supplement B).
Table 1. Survey metrics with example question or prompt and response options.
Data analysis
We analyzed pre- and postintervention responses of the entire group of survey participants (overall audience) and the subset of survey respondents we identified as the target audience. We examined the overall audience to identify whether participants who indicated their intended behavior was aligned with the educational goal remained so after the intervention. We considered respondents who indicated on the preintervention portion of the survey that they were either undecided or intending to do the undesired behavior to be the target audience (e.g., unlikely to install a waterfront buffer or likely to apply fertilizer). For example, the target audience for beliefs and intentions related to applying lawn fertilizer was the subset of respondents in the overall audience who indicated preintervention that they were slightly unlikely (5) to extremely likely (1) to apply lawn fertilizer of any kind in the next 12 months. The target audience for beliefs and intentions related to installing a waterfront buffer was the subset of respondents that indicated preintervention that all or a portion of their shoreline did not currently have a waterfront buffer and that they were slightly likely (5) to extremely unlikely (1) to install a waterfront buffer.
Our statistical analyses varied among research questions. To address the first research question, we used one-sample sign tests due to nonnormal asymmetric data distributions to determine whether the median shift in behavioral intention was different from zero for both the overall audience and the target audience. To address the second and third research questions, we used Mann–Whitney U tests due to nonnormal symmetric data distributions to evaluate whether the shift in intention was different between visualization type (interactive vs. noninteractive) for each behavior among the overall and target audience and to evaluate differences between residency type (permanent vs. seasonal) for each behavior. All analyses were conducted in the R v.4.0.4 statistical language (R Core Team Citation2021).
Results
The survey response rate was 36% (415 respondents of 1152 total individuals in the population). Of the 415 respondents, 403 individuals (97%) completed the preintervention portion of the survey and 329 (79%) completed both the pre- and postintervention portions of the survey. Of the 329 full participation responses, 164 respondents (49.8%) viewed the interactive visualization, and 165 respondents (50.2%) viewed the noninteractive visualization. To categorize participants’ residency, we used self-identified classifications of “seasonal” and “permanent” residents in lieu of tax records. Of the 326 respondents who answered the residency question, 208 (64%) identified as seasonal residents and 118 (36%) identified as permanent residents. There were a total of 58 target audience respondents for fertilizer application (18% of all respondents) and a total of 77 target audience respondents for waterfront buffer installation (23% of all respondents). There were no statistical differences in target audience preintervention beliefs or intentions related to lawn fertilizer application or waterfront buffer installation between interactive and noninteractive visualization treatment groups (Supplement B). Because respondents may have skipped individual questions, the response rate of each item varied.
Question 1.1: Do educational outreach online visualizations shift beliefs and intentions to apply lawn fertilizer?
Combined results
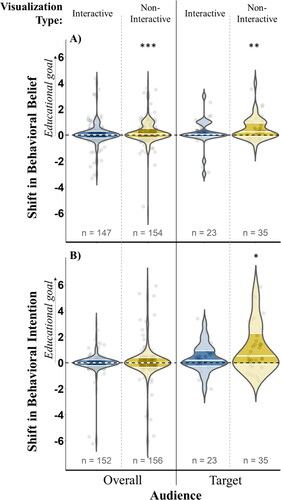
The visualizations (interactive and noninteractive results combined) resulted in a significant shift in lawn fertilizer beliefs toward the lake management educational goal of believing fertilizer has a negative effect on water quality for both the overall and target audience (one-sample sign test; both P < 0.001; Supplement B). The shift in behavioral intention to apply lawn fertilizer was not significant among the overall audience but was significant among the target audience (for becoming more unlikely to apply lawn fertilizer; P = 0.23 and 0.007, respectively; Supplement B.
Visualization-specific results
Separate analyses of the interactive and noninteractive visualizations indicate that their effectiveness in shifting behavioral beliefs and intentions relating to fertilizer application varied. Use of the interactive visualization did not significantly shift behavioral beliefs or intentions related to lawn fertilizer among the overall audience or target audience (all P > 0.15; and Supplement B). In contrast, use of the noninteractive visualization significantly shifted behavioral beliefs toward the educational goal related to lawn fertilizer of believing fertilizer has a negative effect on water quality among the overall audience and the target audience (both P ≤ 0.002; and Supplement B). Use of the noninteractive visualization significantly shifted behavioral intentions toward avoiding application of lawn fertilizer among the target audience (P = 0.03), but the noninteractive visualization did not significantly shift behavioral intentions in the overall audience (P = 0.45; and Supplement B).
Figure 2. Lawn fertilizer: density distribution of shift (postintervention – preintervention response) in behavioral beliefs (Panel A) and intentions (Panel B) for applying lawn fertilizer in the overall and target audiences (Lake Sunapee, NH, region) with interquartile ranges emphasized for comparison with zero (dashed black line). Density-based medians are denoted within each distribution by solid horizontal white lines. Circles behind density distributions show underlying raw data, with points jittered for differentiation; * indicates P-value < 0.05; ** indicates P-value < 0.01; *** indicates P-value < 0.001 of one-sample sign test (Supplement B). All significant shifts in behavioral beliefs and intentions are positive (in direction of educational goal).
Question 1.2: Do educational outreach online visualizations shift behavioral beliefs and intentions to install waterfront buffers?
Combined results
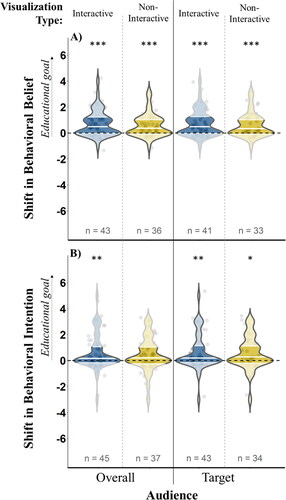
The visualizations (both interactive and noninteractive versions) resulted in a significant shift in waterfront buffer behavioral beliefs toward the lake management educational goal of believing waterfront buffers have a positive effect on water quality for both the overall and target audience (one-sample sign test; both P < 0.001; Supplement B). The combined visualizations (both interactive and noninteractive versions) resulted in a significantly positive shift in behavioral intention to install waterfront buffers among the overall audience and the target audience (both P < 0.001; Supplement B).
Visualization-specific results
Separate analyses of the interactive and noninteractive visualizations indicate that their effectiveness in shifting behavioral beliefs and intentions relating to waterfront buffer installation varied. Use of the interactive visualization significantly shifted behavioral beliefs toward the educational goal related to waterfront buffers—believing buffers have a positive effect on water quality—among the overall audience and the target audience (both P < 0.001; and Supplement B). Similarly, use of the interactive visualization significantly shifted behavioral intentions toward installing waterfront buffers among the overall audience and the target audience (both P = 0.007; and Supplement B). Use of the noninteractive visualization significantly shifted behavioral beliefs toward the educational goal related to waterfront buffers (believing buffers have a positive effect on water quality) among both the overall audience and the target audience (both P < 0.001; and Supplement B). However, use of the noninteractive visualization significantly shifted behavioral intention to install a waterfront buffer among the target audience (P = 0.03), but the noninteractive visualization did not significantly shift behavioral intention in the overall audience (P = 0.06; and Supplement B).
Figure 3. Waterfront buffer: density distribution of shift (postintervention – preintervention response) in behavioral beliefs (Panel A) and intentions (Panel B) for installing a waterfront buffer in the overall and target audiences (Lake Sunapee, NH, region) with interquartile ranges emphasized for comparison with zero (dashed black line). Density-based medians are denoted within each distribution by solid horizontal white lines. Circles behind density distributions show underlying raw data, with points jittered for differentiation; * indicates P-value < 0.05; ** indicates P-value < 0.01; *** indicates P-value < 0.001 of one-sample sign test (Supplement B). All significant shifts in behavioral beliefs and intentions are positive (in direction of educational goal).
Question 2: How effective is an interactive vs. a noninteractive visualization in altering intended behavior toward fertilizer use or waterfront buffers?
There were no significant differences between visualization types in beliefs or intention shifts to install a new buffer or reduce fertilizer use for the overall audience or target audience (Mann–Whitney U test; P ≥ 0.05; ).
Table 2. Mann–Whitney U test results of difference in shift of behavioral beliefs and intentions between visualization tool types.
Question 3: Do responses to the interventions vary between permanent and seasonal residents?
Preintervention intentions
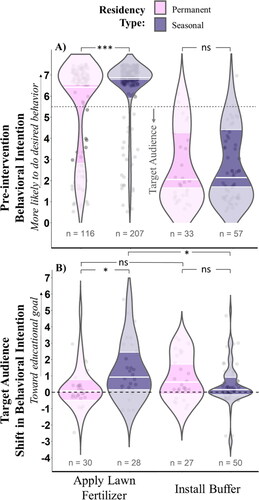
There were significant differences in preintervention intentions related to fertilizer application between seasonal and permanent residents, but not for buffer installation. In the overall audience, seasonal residents were significantly less likely than permanent residents to indicate they intended to apply lawn fertilizer (Mann–Whitney U = 9916, P < 0.001; Panel A; Supplement B). In contrast, in the overall audience, seasonal residents and permanent residents were equally likely to indicate they intended to install a waterfront buffer (U = 910, P = 0.8; Panel A; Supplement B). Among the target audience, there were no statistical differences in preintervention beliefs or intentions related to waterfront buffer installation between seasonal and permanent residents (U = 362, P = 0.1; U = 745, P = 0.5, respectively; Supplement B).
Figure 4. Density distribution of seasonal and permanent residents’ (Lake Sunapee, NH, region) preintervention intended behavior (Panel A) and shift (postintervention – preintervention) in intended behavior (Panel B) to apply lawn fertilizer and install a waterfront buffer with interquartile ranges emphasized for comparison with zero (dashed black line). Density-based medians are denoted within each distribution by solid horizontal white lines. Circles behind density distributions show underlying raw data, with points jittered for differentiation; Panel A gray shaded region is the portion of responses from the nontarget audience; * indicates P-value < 0.05; *** indicates P-value < 0.001; ns indicates not significant, for one-sample sign test (Supplement B).
Intention shifts
There were significant differences in target audience shifts of intentions related to fertilizer application between seasonal and permanent residents, but not for waterfront buffer installation. Among the target audience, seasonal residents were more likely than permanent residents to shift their intentions to apply fertilizer after using either the interactive or noninteractive visualization (U = 267, P = 0.01; Panel B; Supplement B). Among the target audience, seasonal residents and permanent residents were equally likely to shift their intention to install a new waterfront buffer after the intervention (U = 764; P = 0.3; Panel B; Supplement B).
Comparing pre-and postintervention responses within residency groups demonstrates that the response of each residency group varied by behavior. Permanent residents were equally likely to shift their intentions to install a new waterfront buffer and apply lawn fertilizer (U = 310, P = 0.05; Panel B; Supplement B). In contrast, seasonal residents shifted their intentions to apply lawn fertilizer significantly more than their intentions to install a new waterfront buffer (U = 861, P = 0.02; Panel B; Supplement B).
Discussion
Collectively, engaging with either the interactive or noninteractive visualization was effective in shifting intended behavior among the target audience toward the educational goals of both becoming more likely to install a new waterfront buffer and less likely to apply lawn fertilizer ( and ). Postintervention beliefs shifted toward the perception that fertilizer has a negative effect on water quality and waterfront buffers have a positive effect on water quality (as indicated by the majority of respondents above the zero line in and ). When considering visualization types separately, the noninteractive version was effective for shifting respondents’ beliefs and intentions on both fertilizer use and buffer installation, but the interactive version was only effective for waterfront buffer installation ( and and Supplement B). Since interactive online interfaces can require computational expertise and substantial time and money to develop, and the interactive visualization was no more effective than the noninteractive visualization (), noninteractive informational websites may be sufficient for lake outreach specialists to effectively reach their audience. However, the majority of respondents were not in our target audience (i.e., they were already doing the lake-friendly behavior), so our fertilizer and waterfront buffer target audiences sample sizes were relatively small for the interactive (n = 23 and 43, respectively) and noninteractive (n = 35 and 43, respectively) visualizations. Therefore, some of our nonsignificant target audience results may be due to small target audience sample sizes.
Contrary to expectation, the interactive visualization was no more effective in altering beliefs and intentions than the noninteractive visualization (). Interactive visualizations are often a type of multimedia experience (Ioannidou et al. Citation2006) combining text, visualizations, and user-determined selections, which are known to increase learning outcomes (Mayer Citation2003). Therefore, improvements from interactivity in previous studies (e.g., Fawcett Citation2018) may in part be due to the multimedia format of the information. Our interactive and noninteractive versions of the visualization had the same type of multimedia components (e.g., text, diagrams, photos), which may explain why we did not detect a significant effect of interactivity in our study. Furthermore, interactivity can be classified across a spectrum, where very high levels of interactivity can increase recollection of information within interactive portions of a website while lowering recollection of information elsewhere on the website (Xu and Sundar Citation2016). We did not test different levels of interactivity in this study, so a higher or lower level of interactivity in a revised visualization may improve learning outcomes in future outreach applications. Most research on the effectiveness of interactive visualizations has been in classroom contexts (e.g., Fawcett Citation2018), for online marketing purposes (e.g., Xu and Sundar Citation2016), or for news journalism (e.g., Geidner et al. Citation2015), so assessing the effectiveness of other interactive webpages for educational outreach (e.g., by a lake association) is needed to generalize results.
There are important benefits to interactive visualizations that we did not examine. For example, if given an option to engage with information or not, people may be more likely to engage in interactive portions of a website than with noninteractive portions (Xu and Sundar Citation2016) and may prefer interactive webpages in general (Chung and Zhao Citation2006). In our study, participants were assigned one of the 2 visualizations and did not have a choice between using a visualization or not. However, if instead lake residents were given the choice of whether to use either visualization or not and were more likely to engage with the interactive visualization, then the interactive visualization could have a greater effective impact by reaching more people. Future research should examine whether participants are more likely to engage with interactive visualizations for outreach applications, if given an option to engage or not.
Seasonal residents were more likely to change their intentions to apply lawn fertilizer than their intentions to install a waterfront buffer. This difference of response between behavior types among seasonal residents may be due to different patterns of adoption for habitual behaviors (e.g., applying lawn fertilizer) that happen on the daily to weekly scale vs. occasional behaviors (e.g., installing a waterfront buffer) that happen on the annual to decadal scale (Lavelle et al. Citation2015). Choosing to not apply fertilizer is a simpler behavior to adopt in comparison to the decision to install a new buffer, which likely requires more time, money, and labor. Since seasonal residents only spend a portion of the year at their property, they may be less inclined to adopt the more intensive behavior of installing a new waterfront buffer.
Permanent residents were more likely than seasonal residents to apply fertilizer preintervention and less likely to shift their fertilizer intentions postintervention (). Seasonal residents may have been less likely to apply lawn fertilizer preintervention because they did not want to spend the limited time they have at their property applying fertilizer or are not at their property at the best times of year to apply fertilizer. However, this potential explanation for preintervention differences does not explain why seasonal residents would be more likely to shift intentions postintervention. We hypothesize that the pattern of permanent residents being more likely to apply fertilizer preintervention and less likely to shift fertilizer intentions postintervention may be because the permanent residents in our study were already aware of the information we presented, in part through the outreach efforts of the Lake Sunapee Protective Association regarding lawn care best management practices (Fitchett Citation2019). Additionally, various local outreach programs, such as University of New Hampshire (UNH) Cooperative Extension and New Hampshire Department of Environmental Services (NH DES), provide extensive outreach materials and community-engagement initiatives (e.g., UNH Cooperative Extension Citation2007, Wawrzynek et al. Citation2007, Franz and Townson Citation2008, NH DES 2016, Clyde et al. Citation2018). In fact, educational interventions like the ones in this study are most effective when people want to do the right thing but are uninformed about the topic (Manfredo Citation1992). Thus, it is possible that permanent residents who still apply lawn fertilizer may be doing so even though they are aware of the consequences. Therefore, the permanent residents in the target audience likely have a different barrier to adoption than the barrier our visualizations aimed to overcome: lack of awareness that applying fertilizer harms future water quality (Schultz Citation2002).
Additionally, observed differences between seasonal and permanent residents for each behavior may be related to differing strength of place attachment, or place attachment based on different underlying reasons (different place meanings). Previous research with similar populations of lakefront property owners has found that seasonal residents have stronger place attachment (Stedman Citation2006, Simoni and Floress Citation2015) and are more likely to be attached to the environmental quality of the area than are permanent residents (Stedman Citation2006). If the seasonal residents are specifically attached to the environmental quality of the lake, and they perceive lake water quality as threatened by environmental change, they may be more likely to adopt the environmentally friendly behavior (as in Stedman Citation2002, Rajala et al. Citation2020). Or, if seasonal and permanent residents have differing tendencies for attachment to the viewshed of their property or the greenness of their lawn, they may be unlikely to adopt the lake-friendly behavior. Therefore, the pattern we observed of seasonal residents being more likely than permanent residents to indicate they were unlikely to apply lawn fertilizer before the educational intervention and exhibiting significantly greater shifts in intentions after the intervention could be due to differing place attachments. Though we collected additional metrics related to place connections, including length of ownership, generations of the family that have owned the property, and annual time spent, we did not observe any relationships between these ownership characteristics and the response to the visualizations. Future work should examine strength of place attachment and the reasons underlying a respondent’s level of place attachment among different outreach audiences.
Overall, respondents demonstrated greater shifts in their beliefs and intentions to install a waterfront buffer than to reduce fertilizer application, which could be due to several reasons that we cannot isolate with this study but that warrant future consideration. Two possible reasons are methodological limitations of our study: First, because of anticipated small sample sizes during the COVID-19 pandemic, we did not conduct a fully controlled study for messaging differences across behaviors in the educational intervention. For example, we included social norm messaging in the outreach visualizations for waterfront buffers but did not control for its inclusion (i.e., we did not include a treatment group without waterfront buffer norm messaging). Therefore, the greater effectiveness of the intervention for installing waterfront buffers could be due to the embedded social norm messaging (Byerly et al. Citation2018). Second, the difference in effectiveness could be due to the different complexity of information provided in both interventions. For waterfront buffers, the messaging was quite straightforward: A buffer is better than not having a buffer and a larger buffer is better than a smaller one. For fertilizer, we included more nuanced information about the content of the fertilizer (phosphorus-containing vs. phosphorus-free) and the timing of application (during cool, wet weather vs. during warm, dry weather). Because simpler messaging may increase comprehension of material (Andres and Petersen Citation2002), controlling for message complexity may provide greater insights into effectiveness of interactive visualizations. Future work should control for social norm messaging and simplified vs. complex educational information.
To implement findings from this study, a few study limitations should be considered. The visualizations assumed all property owners in the watershed selected the same behaviors. Since the water quality effects from one property are much smaller than from the entire watershed, future studies should examine how spatial variability and the distribution of land use decisions as related to water quality outcomes may affect visualization effectiveness. Further, this study examined one type of visualization in a high water quality lake, and future work should examine the potential for a variety of interactive visualizations across a range of lake types, including lower quality lakes requiring improvements in management. Additionally, tracking changes in actual behavior, rather than behavioral intention, would provide a stronger assessment of visualization effectiveness. However, use of short-term interventions like the visualizations in this study is likely more effective when applied as one part of a broader outreach program with a diversity of approaches to overcome different types of barriers to adoption (e.g., financial incentives, skill-building workshops; Pratt and Bowman Citation2008, Byerly et al. Citation2018).
In summary, our educational outreach was effective in shifting beliefs and intentions immediately after the intervention. The finding that interactivity was no more effective than a noninteractive webpage with the same information suggests that either visualization approach can positively affect beliefs and intentions. While the shifts in beliefs and intentions reflect an immediate effect of the intervention rather than a long-term change, short-term (∼5 min) outreach endeavors like this one may be particularly useful when incorporated within a broader outreach program.
Future work should combine longer term tracking of behavioral intention shifts to identify the effectiveness of the intervention at longer time scales. Also, adequately assessing target audience place attachment and place meanings may improve effectiveness of targeted messaging. Additionally, the participants that did change their intentions post intervention likely have a different barrier to adoption than knowledge of water quality consequences, and lake managers should consider potential economic barriers or incentives to increase adoption of lake-friendly property management actions. Nonetheless, our data show that short, relatively simple interventions like the visualizations used in this study can result in measurable change in intentions immediately following the intervention. Educational interventions that make the direct connection between current behavior and future water quality may be particularly useful in communicating best management practices to protect oligotrophic lakes into the future.
Our interactive visualization is publicly available and easily adaptable to other lake watersheds in the New England region of the United States (see Ward Citation2021). We view this work as a first step in developing scenario-based tools to directly link current private property decisions with future water quality. The visualization is available under an MIT license, and we welcome efforts to build on and expand the tool.
Acknowledgments
We thank the Lake Sunapee Protective Association, especially June Fichter, Geoff Lizotte, Nancy Brook Heckel, Kathleen Stowell, and Susie Burbidge, for their support of this study and long-term commitment to water quality outreach. We thank the Carey Lab in Virginia Tech (VT) Biological Sciences, the Conservation Social Science lab in VT Forest Resources and Environmental Conservation, Emma Jones, and the NALMS community for their helpful feedback on the visualization and Caroline Bryant for assistance in data analysis. Author contributions: NKW conceived the study design and wrote the article with help from CCC and MGS. NKW and MGS developed the survey; NKW, MGS, CCC, and KCW developed the interactive visualization. NKW and MSR curated the survey data and conducted data analysis. KCW facilitated collection of survey data; WW contributed to demographic data analysis. All authors contributed to table and figure generation, data interpretation, and manuscript editing, and approved the final article.
Funding
This work was financially supported by the Lake Sunapee Protective Association-VT Calhoun Fellowship, the Interfaces of Global Change Research Fellowship, NSF ICER-1517823, and DBI-1933016.
Related Research Data
References
- Andres HP, Petersen C. 2002. Presentation media, information complexity, and learning outcomes. J Educ Technol Syst. 30(3):225–246. doi:https://doi.org/10.2190/3TWA-NVA7-0MEW-402J.
- Brehm JM, Eisenhauer BW, Krannich RS. 2006. Community attachments as predictors of local environmental concern. Am Behav Sci. 50(2):142–165. doi:https://doi.org/10.1177/0002764206290630.
- Brookes JD, Carey CC. 2011. Ecology. Resilience to blooms. Science. 334(6052):46–47. doi:https://doi.org/10.1126/science.1207349.
- Byerly H, Balmford A, Ferraro PJ, Wagner CH, Palchak E, Polasky S, Ricketts TH, Schwartz AJ, Fisher B. 2018. Nudging pro-environmental behavior: evidence and opportunities. Front Ecol Environ. 16(3):159–168. doi:https://doi.org/10.1002/fee.1777.
- Carey CC, Haney JF, Cottingham KL. 2007. First report of microcystin-LR in the cyanobacterium Gloeotrichia echinulata. Environ Toxicol. 22(3):337–339. doi:https://doi.org/10.1002/tox.20245.
- Carey CC, Weathers KC, Ewing HA, Greer ML, Cottingham KL. 2014. Spatial and temporal variability in recruitment of the cyanobacterium Gloeotrichia echinulata in an oligotrophic lake. Freshw Sci. 33(2):577–592. doi:https://doi.org/10.1086/675734.
- Carpenter SR, Cole JJ, Pace ML, Batt R, Brock WA, Cline T, Coloso J, Hodgson JR, Kitchell JF, Seekell DA, et al. 2011. Early warnings of regime shifts: a whole-ecosystem experiment. Science 332(6033):1079–1082. doi:https://doi.org/10.1126/science.1203672.
- Chung H, Zhao X. 2006. Effects of perceived interactivity on web site preference and memory: role of personal motivation. J Comput-Mediat Comm. 10(1):JCMC1017. doi:https://doi.org/10.1111/j.1083-6101.2004.tb00232.x.
- Clyde M, Eberhardt A, Prysby MD, Stofer K. 2018. Untapped: accessing extension to strengthen connections between citizen science and community decision making. J Extension 56(5):5FEA7.
- Cobourn KM, Carey CC, Boyle KJ, Duffy C, Dugan HA, Farrell KJ, Fitchett L, Hanson PC, Hart JA, Henson VR, et al. 2018. From concept to practice to policy: modeling coupled natural and human systems in lake catchments. Ecosphere 9(5):e02209. doi:https://doi.org/10.1002/ecs2.2209.
- Cottingham KL, Ewing HA, Greer ML, Carey CC, Weathers KC. 2015. Cyanobacteria as biological drivers of lake nitrogen and phosphorus cycling. Ecosphere 6(1):1–19. doi:https://doi.org/10.1890/ES14-00174.1.
- Dillman DA, Smyth JD, Melani Christian L. 2014. Internet, phone, mail, and mixed-mode surveys: the tailored design method. Hoboken (NJ): Wiley.
- Fawcett L. 2018. Using interactive Shiny applications to facilitate research-informed learning and teaching. J Stat Educ. 26(1):2–16. doi:https://doi.org/10.1080/10691898.2018.1436999.
- Fishbein M, Ajzen I. 2010. Predicting and changing behavior: the reasoned action approach. New York (NY): Psychology Press.
- Fitchett LL. 2019. The roles of local organizations in collaborative resource governance: a qualitative case study of lake associations [master’s thesis]. Blacksburg (VA): Virginia Tech.
- Fitchett LL, Sorice MG, Cobourn KM, Boyle KJ, Klug JL, Weathers KC. 2020. Pathways to enhanced lake integrity: a framework to assess the effectiveness of local lake associations. Lakes Reservoirs. 25(2):258–268. doi:https://doi.org/10.1111/lre.12308.
- Franz NK, Townson L. 2008. The nature of complex organizations: the case of Cooperative Extension. New Dir Eval, 120: 5–14. doi:https://doi.org/10.1002/ev.272.
- Geidner N, Pjesivac I, Imre I, Coman I, Yuran D. 2015. The role of interactive graphics in reducing misperceptions in the electorate. Vis Commun Q. 22(3):133–145. doi:https://doi.org/10.1080/15551393.2015.1069195.
- Gsell AS, Scharfenberger U, Özkundakci D, Walters A, Hansson L-A, Janssen ABG, Nõges P, Reid PC, Schindler DE, Van Donk E, et al. 2016. Evaluating early-warning indicators of critical transitions in natural aquatic ecosystems. Proc Natl Acad Sci USA. 113(50):E8089–E8095. doi:https://doi.org/10.1073/pnas.1608242113.
- Ioannidou IA, Paraskevopoulos S, Tzionas P. 2006. An interactive computer graphics interface for the introduction of fuzzy inference in environmental education. Interact Comput. 18(4):683–708. doi:https://doi.org/10.1016/j.intcom.2005.10.007.
- Lake Sunapee Protective Association, DK Water Resource Consulting, and Stone Environmental. 2020. Lake Sunapee watershed management plan. Sunapee (NH): Lake Sunapee Protective Association; [cited 10 Mar 2021]. https://static1.squarespace.com/static/54bfbf13e4b08839cc010a41/t/5ef3476843817b4f70ea3ac2/1593001836774/LS_2020_WMP_Complete.pdf
- Lavelle MJ, Rau H, Fahy F. 2015. Different shades of green? Unpacking habitual and occasional pro-environmental behavior. Glob Environ Change. 35:368–378. doi:https://doi.org/10.1016/j.gloenvcha.2015.09.021.
- Manfredo MJ. 1992. Influencing human behavior: theory and applications in recreation and tourism and natural resources management. Champaign (IL): Sagamore Publishing.
- Martin SL, Hayes DB, Kendall AD, Hyndman DW. 2017. The land-use legacy effect: towards a mechanistic understanding of time-lagged water quality responses to land use/cover. Sci Total Environ. 579:1794–1803. doi:https://doi.org/10.1016/j.scitotenv.2016.11.158.
- Mayer RE. 2003. The promise of multimedia learning: using the same instructional design methods across different media. Learn Instr. 13(2):125–139. doi:https://doi.org/10.1016/S0959-4752(02)00016-6.
- McKenzie-Mohr D, Lee NR, Schultz PW, Kotler P. 2012. Social marketing to protect the environment: what works. Los Angeles (CA): Sage Publishing.
- Miksa K, Kalinauskas M, Inácio M, Gomes E, Pereira P. 2020. Ecosystem services and legal protection of private property. Problem or solution? Geogr Sustain. 1(3):173–180. doi:https://doi.org/10.1016/j.geosus.2020.08.003.
- [NH DES] New Hampshire Department of Environmental Services. 2016. Vegetated buffer. New Hampshire homeowner’s guide to stormwater management do-it-yourself stormwater solutions; [cited 12 Jul 2021]. https://www4.des.state.nh.us/SoakNH/wp-content/uploads/2016/06/Vegetated-Buffer.pdf.
- Pratt C, Bowman S. 2008. Principles of effective behavior change: application to extension family educational programming. J Extension 46(5):5FEA2.
- Rajala K, Sorice MG, Thomas VA. 2020. The meaning(s) of place: identifying the structure of sense of place across a social-ecological landscape. People Nat. 2(3):718–733. doi:https://doi.org/10.1002/pan3.10112.
- Richardson DC, Carey CC, Bruesewitz DA, Weathers KC. 2017. Intra- and inter-annual variability in metabolism in an oligotrophic lake. Aquat Sci. 79(2):319–333. doi:https://doi.org/10.1007/s00027-016-0499-7.
- R Core Team. 2021. R: a language and environment for statistical computing. Vienna (Austria): R Foundation for Statistical Computing. www.R-project.org/
- Schultz PW. 2002. Knowledge, information, and household recycling: examining the knowledge-deficit model of behavior change. In: Dietz T, Stern PC, editors. New tools for environmental protection: education, information, and voluntary measures. Washington, DC: National Academies Press. p. 67–82.
- Sedig K, Parsons P, Dittmer M, Haworth R. 2014. Human-centered interactivity of visualization tools: micro and macro-level considerations In: Huang W, editor. Handbook of human centric visualization. New York (NY): Springer Science + Business Media. p. 717–743.
- Sheeran P, Webb TL. 2016. The intention-behavior gap. Soc Pers Psychol Compass. 10(9):503–518. doi:https://doi.org/10.1111/spc3.12265.
- Simoni J, Floress K. 2015. An exploration of place meanings among residents in central Wisconsin. Lake Reserv Manage. 31(1):1–10. doi:https://doi.org/10.1080/10402381.2014.963755.
- Stedman RC. 2002. Toward a social psychology of place: predicting behavior from place-based cognitions, attitude, and identity. Environ Behav. 34(5):561–581. doi:https://doi.org/10.1177/0013916502034005001.
- Stedman RC. 2006. Understanding place attachment among second home owners. Am Behav Sci. 50(2):187–205. doi:https://doi.org/10.1177/0002764206290633.
- Stoddard JL, Van Sickle J, Herlihy AT, Brahney J, Paulsen S, Peck DV, Mitchell R, Pollard AI. 2016. Continental-scale increase in lake and stream phosphorus: are oligotrophic systems disappearing in the United States? Environ Sci Technol. 50(7):3409–3415. doi:https://doi.org/10.1021/acs.est.5b05950.
- TriTown NH. 2021. Tax map GIS database; [cited 10 Mar 2021]. https://www.axisgis.com/Tri_TownNH/.
- UNH Cooperative Extension. 2007. Landscaping at the water’s edge: an ecological approach; [cited 12 Jul 2021]. https://extension.unh.edu/resource/landscaping-waters-edge-book.
- US Census Bureau. 2019. American Community Survey 5-year estimates; [cited 10 Mar 2021]. https://data.census.gov/cedsci.
- Voigt GA. 2017. Nudging neighbors: analyzing peer effects of the LakeSmart program in the Belgrade lakes. J Environ Resour Econ Colby 4(1):7.
- Ward NK. 2021. First release of WaterConnections (Version v1.0.0) [code]. Zenodo Repository; [cited 10 Mar 2021]. doi:https://doi.org/10.5281/zenodo.4563032.
- Ward NK, Steele BG, Weathers KC, Cottingham KL, Ewing HA, Hanson PC, Carey CC. 2020. Differential responses of maximum versus median chlorophyll-a to air temperature and nutrient loads in an oligotrophic lake over 31 years. Water Resour Res. 56(7):e2020WR027296.
- Wawrzynek J, Mahler RL, Gold AJ, McCann A. 2007. Citizen involvement in water resources issues in New England. J Extension. 45(5):5RIB3.
- Xu Q, Sundar SS. 2016. Interactivity and memory: information processing of interactive versus non-interactive content. Comput Hum Behav. 63:620–629. doi:https://doi.org/10.1016/j.chb.2016.05.046.