
 ?Mathematical formulae have been encoded as MathML and are displayed in this HTML version using MathJax in order to improve their display. Uncheck the box to turn MathJax off. This feature requires Javascript. Click on a formula to zoom.
Abstract
The aggregation of polycyclic aromatic compound (PAC) molecules is sensitive to the solvent they are dissolved or suspended in. By using both dynamic light scattering and diffusion-ordered nuclear magnetic resonance spectroscopy, in combination with molecular dynamics simulations, the effect of chemical structure on the aggregation of PACs in both aromatic and alkane solvents were systematically investigated. A suite of triphenylene-based PACs offers a robust platform to understand the driving forces of aggregation mechanism across both nanometer and micrometer scales. Both the configuration, either parallel or otherwise, and the arrangement, whether compact or loose, of molecules in their aggregates are determined by a fine balance of different interactions such as those between the polar groups, π–π interactions between the aromatic cores, steric hindrance induced by the side chains, and the degree of solvation. These results suggest that molecular architecture is the major factor in determining how the model compounds aggregate. The shift from aromatic to aliphatic solvent only slightly increases the likelihood of aggregation for the model compounds studied while subtle differences in molecular architecture can have a significant impact on the aggregation characteristics.
Introduction
The aggregation of polycyclic aromatic compounds (PACs) is determined by three factors: collision frequency between molecules, determined by their concentration, angle of interaction between molecules and the strength of molecular interactions, and balance of attractive and repulsive intermolecular forces. Attractive forces include van der Waals, π-π and polar interactions, hydrogen bonding, and metal coordination,Citation1–4 while repulsive forces are typically steric in origin, induced by any alkyl chains surrounding the aromatic core.Citation5 The balance of these forces is highly sensitive to the solvent composition. When PACs are dispersed in an aromatic solvent, they are generally viewed as nanometer-sized aggregatesCitation6–9: the strong affinity toward the solvent is likely attributed to the attraction between the aromatic solvent and the aromatic surface of the solute.Citation10 However, introduction of n-alkane can alter the balance of solvent-solute interaction, facilitating the formation of micrometer-sized large aggregates.Citation11
This aggregation behavior, over two distinct length scales, has been observed in naturally occurring PACs such as asphaltenes. This broad family of compounds, one of the heaviest fractions of crude oil, are soluble in aromatic solvents, insoluble in aliphatic solvents, and known to aggregate readily upon changes in temperature, pressure, or solvent composition.Citation12–14 Aggregation, and subsequent precipitation, can occur during transportation or processing, resulting in blockage of pipelines and production facilities, fouling on equipment surface, and catalyst deactivation.Citation15–17 Studying the effects of solvent composition on asphaltene aggregation has significant importance on industrial practice such as blending.Citation18,Citation19 To rationalize asphaltene aggregation in toluene solutions after n-heptane addition, a mechanism that is diffusion-limited below the critical micelle concentration but reaction-limited above has been proposed.Citation20–22 Other studies suggested that factors such as chemical structure, temperature, and the presence of co-solutes can influence the aggregation of asphaltenes.Citation23–29 For example, both the amount of asphaltene aggregation observed, and the rate at which it occurs, has been found to be inversely proportional to the chain length of the n-alkane added.Citation30
A number of experimental approaches, including dynamic light scattering (DLS),Citation31–33 nuclear magnetic resonance (NMR) diffusion-ordered spectroscopy (DOSY),Citation34,Citation35 and small angle scattering, such as small angle x-ray scattering (SAXS)Citation36 and small angle neutron scattering (SANS),Citation37,Citation38 have been used to investigate the aggregation process and to characterize the aggregates formed. For example, a combination of techniques was deployed by Espinat et al.Citation39 in studying the size of asphaltene aggregates in toluene as a function of temperature. They not only quantified the size of micelles in the region of tens of angstroms, but that different aggregation mechanisms could take place. In a separate work, Eyssautier et al.Citation40 used SANS and SAXS to investigate the structure of asphaltene nanoaggregates, describing the nanoaggregates as disks of total radius 32 Å, with 30% polydispersity, and a height of 6.7 Å. The reported sizes of asphaltene aggregates have ranged from a few nanometers to several microns, depending on the nature of the samples, the solvent quality, and other processing parameters.Citation40,Citation41 Another approach that has been commonly used is molecular dynamics (MD) simulations where chemical structures of the same compounds were constructed and dispersed in different solvents to investigate the intermolecular interactions and molecular configurations.Citation42–47 The computational measurements offer a unique capability to quantitatively evaluate both aggregation distances and configurations between PAC molecules, and also those between solute and solvent molecules.
Due to the diverse range of chemical structures exhibited, the broad range of solvents that can be used, and the two distinctive length scales over which aggregation takes place, it is a challenging task to understand and control the solubility of natural asphaltenes, as work carried out previously has demonstrated. Instead, simple PAC molecules have been studied to unravel the fundamentals underpinning the aggregation mechanism of more complex PACs such as natural asphaltenes.Citation48,Citation49 Either approach, using model compounds with controlled structure or investigating more disperse natural asphaltenes, has its limitations in revealing the aggregation mechanism of asphaltenes. In our recent work, a set of six model PAC molecules based on a triphenylene core were developed to study the aggregation mechanisms,Citation50 providing fundamental understanding of the same processes in other aromatic molecules including natural asphaltenes. Consistency in the core structures, and small, incremental changes in functionalized side chains, enables the effects of both functional groups and lengths of alkyl chains on aggregation to be evaluated separately.
In the work reported here, the effect of solvent composition, varying from purely aromatic (toluene) to purely aliphatic (n-heptane), on the aggregation characteristics of triphenylene-based PACs was investigated. DLS and diffusion-ordered nuclear magnetic resonance (DOSY NMR) measurements were used to monitor the hydrodynamic radii of any aggregates formed, while MD simulations were used to investigate the intermolecular interactions. This combined approach allows us to distinguish the role of the different solvent mixtures, differently sized alkyl chains, and different functional groups present and their effects on aggregation.
Materials and methods
Materials
Toluene and n-heptane of different grades (99.85%, Extra Dry-AcroSeal; 99+%, extra pure and deuterated) and PTFE membrane filters (100 nm pore size, Whatman) were purchased from Fisher Scientific (Loughborough, UK). Quartz optical cells (S High Precision Cell - Light Path 3 × 3 mm) were purchased from Hellman Analytics Q, and solvent resistant screw cap vials (7 and 15 mL) were purchased from Sigma Aldrich (Dorset, UK).
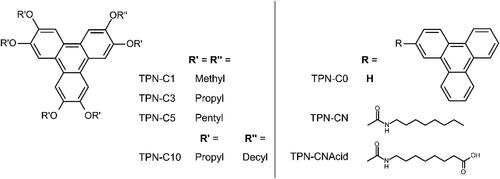
Triphenylene (TPN-C0) was purchased from Sigma Aldrich (Dorset, UK), from which two groups of model compounds were synthesized with either six alkoxy groups (TPN-C1, -C3, -C5, and -C10) or a single amide-linked chain (TPN-CN and -CNAcid) attached to the central triphenylene core. The chemical structures of TPN-C0 and all six model compounds are presented in Scheme 1. Details concerning the chemical synthesis can be found in a previous work.Citation50
Scheme 1. Chemical structures of the triphenylene (TPN) derivatives used in the present work.
Dynamic light scattering
A Zetasizer (Nano Series, Malvern) (λ = 632.8 nm), with a scattering angle of 173°, was used to carry out the DLS measurements, with data collected at fixed time intervals (immediately after n-heptane addition (0 h), 24 h, and 168 h). All samples were kept at constant temperature (22 ± 0.5 °C) and ambient pressure. Solvents were filtered three times with PTFE filters (100 nm pore size) prior to usage. The model compounds were stabilized in toluene for 24 h before n-heptane was introduced to form a mixture, the so-called heptol (4 parts toluene to 6 parts n-heptane), with a PAC concentration of 10 mg mL‒1.
Analysis of the acquired autocorrelation functions for each sample was performed using the instrument software provided. Each datum is an averaged value of three independent samples, with each of them measured six times. Stokes–Einstein equation (Equation 1) was used to calculate the hydrodynamic radius of the aggregate,
(1)
(1)
where k is Boltzmann’s constant, T is the absolute temperature, and η is the viscosity of the solvent.Citation51,Citation52
Diffusion-ordered NMR spectroscopy
Samples of triphenylene and the six different model PACs were prepared with a nominal concentration of 10 mg mL‒1 in heptol-d (4/6 toluene-d8:n-heptane-d16 ratio), using tetramethylsilane (TMS) as reference (both Sigma Aldrich, Dorset, UK). Diffusion NMR data were collected at fixed time intervals (immediately after n-heptane addition (0 h), 24 h, and 168 h). All measurements were carried out on non-spinning on a 300 MHz Bruker Avance spectrometer, using a 5 mm PABBO BB-1H ZGRD probe equipped with a z gradient coil producing a maximum gradient of 36 G cm‒1. All NMR measurements were performed at 295.15 K and used a double stimulated echo bipolar pulse pair sequence.Citation53 Diffusion coefficients and DOSY spectra were subsequently determined and processed using the DOSY Toolbox software package.Citation54 Further details on the diffusion NMR methodology used can be found in the Supporting Information.
The NMR experiments were used to confirm the presence of any nanoaggregates in the sample and estimate their size. For nanometer-sized particles, EquationEquation (2)(2)
(2) ,
(2)
(2)
the Gierer–Wirtz (G-W) modification of Equation (1),Citation55,Citation56 where α is the ratio of solvent molecular weight to solute molar mass, provides more accurate predictions by taking the relative sizes of the solute and solvent into account. By combining the Gierer–Wirtz modification with appropriate assumptions about factors such as solute shape, flexibility, and solvation, a relatively simple method for predicting the diffusion coefficients of molecules based on their molecular weight can be obtained. From this predicted diffusion coefficient, it is possible to estimate a hydrodynamic diameter for the dis-aggregated molecules, to be compared with the experimentally acquired data.
Molecular dynamics simulations
Molecular dynamics (MD) simulations were carried out using the GROMACS 4.6.5 software package.Citation5,Citation42,Citation57,Citation58 Starting from an initial energy minimization procedure using the steepest descent algorithm (104 iterations, convergence criterion of 25 kJ/mol/nm and initial step size of 0.01 nm),Citation59 short sequential simulations (0.1 and 3.0 ns, respectively) in the NVT and NPT ensembles were used to relax the systems. A Berendsen barostat algorithm and a stochastic velocity rescaleCitation60 were adopted to maintain 1 atm pressure and 298 K respectively. At each stage, equilibration was confirmed using the algorithm developed by ChoderaCitation61 and implemented in the pymbar python libraryCitation62 (data not shown here). Once equilibrated, production simulations lasting 20 ns in the case of one TPN molecule and 100 ns in the case of multiple were performed with an integration time of 2 fs using a Parrinello-Rahman barostat and the stochastic velocity rescale thermostat. Throughout these simulations, the dimensions of the simulation box were 5 nm (±0.3 nm) in each direction.
Bonding interactions were modeled using the OPLS/AA forcefield, as reported in previous studies.Citation44,Citation63 Molecular structures of the six different compounds and the triphenylene precursor were constructed using the protocols established in a previous study of this group.Citation64 Non-bonding Van der Waals interactions were modeled using the 12-6 form of the Lennard–Jones functional, and partial atomic charges were modeled using the particle-mesh Ewald algorithm. Parameters for Van der Waals and electrostatic nonbonding interactions were again taken from the OPLS-AA forcefield, with partial charges modified to ensure charge-balancing. A cutoff of 1.0 nm for nonbonding interactions was used with potential is shifted such that the value was zero at the cutoff, and three dimensional periodic boundary conditions were used for all equilibration and production simulations.Citation65 The effectiveness of such fixed-charge forcefields for accurately modeling aggregation of extended aromatic systems is subject to debate.Citation66,Citation67 For the purposes of this study, these interactions should provide insight into the trends observed in the experimental system even if quantitative details (e.g. aggregate size, π–π interaction distances) are not necessarily reproduced.
Solute-solvent affinity was studied by placing a single PAC molecule in a simulation box filled with 700 solvent molecules (350 n-heptane and 350 toluene), from which a python package MDAnalysisCitation68,Citation69 was used to evaluate the solvation state around the molecule. Shells were set at distances of 0.5, 1.0, and 1.5 nm from the outermost atom in the molecular structure of the PAC. The number of toluene and n-heptane molecules in each shell was recorded every 1 ns over a total 100 ns of the simulation time, from which the fraction of toluene molecules was recorded.
To investigate the intermolecular interactions between solutes, seven identical molecules were placed into (1) toluene; (2) n-heptane simulation boxes (each containing 700 solvent molecules); and (3) a heptol simulation box (containing 350 toluene/350 n-heptane molecules) at equidistant positions to examine the intermolecular forces. Potential of mean force (PMF) analysis was used to determine the averaged distance between the centers of mass (COMs) of molecules during the simulation, based on the data extracted from the radial distribution function of GROMACS. The positions and intensities of the distribution peaks acquired offer provide the averaged distance between the molecules. The data obtained has been normalized against the interaction recorded at 2.4 nm. In the case of the heptol samples, additional MD analysis provided a more detailed insight into the molecular configurations adopted during aggregation. The nature of aggregation, i.e. π-stacking, ordered, dis-ordered, was determined by capturing both the intermolecular distances and the angle between aromatic cores during the simulations. This set of data was only extracted for the heptol boxes and is presented as histograms to support the PMF potential energy curves.
It is worth noting that a 50/50 molar ratio was used in the MD simulations to match the results between the solvent affinity (1 model compound molecule in 700 solvent molecules) and solute-solute (7 model compound molecules in 700 solvent molecules). However, 60% of the toluene was replaced with n-heptane in the DLS and NMR experiments based on the consideration that most studies reported that n-alkane solvent effects are exhibited when more than 50% of the solvent volume is n-heptane.Citation6,Citation70,Citation71
Results
Dynamic light scattering of PACs
The hydrodynamic diameters of PAC aggregates in heptol solution were measured as a function of time, using a protocol established previously, where the aggregation of the same set of model compounds was studied in toluene.Citation50 The averaged hydrodynamic diameters acquired over a course of 168 h (7 days) are presented in .
Figure 1. Averaged hydrodynamic diameters of seven model PACs dispersed in heptol (40% toluene, 60% n-heptane), at 10 mg mL‒1. Measurements of diameters smaller than 1 nm, typically beneath the detection limit of the instrument, are marked with an asterisk.
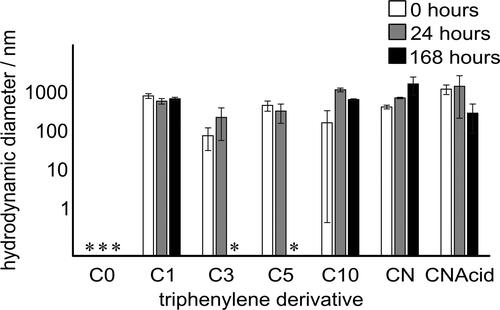
It was found that TPN-C0, the unaltered triphenylene, presented a hydrodynamic diameter below 1 nm, beneath the typical detection limit of the instrument, in heptol solution with no noticeable change over 168 h, consistent with the previous finding that TPN-C0 does not aggregate in tolueneCitation50 and confirming that adding n-heptane does not prompt aggregation of the TPN-C0. In contrast, the compounds with alkyl branches, including TPN-C1, -C3, -C5, and -C10, were all found to form large aggregates, hundreds of nanometers in size, upon the addition of n-heptane. TPN-C3 and TPN-C5 were subsequently found to dissociate into smaller aggregates over an extended period, different aggregation kinetics to those observed in toluene. Compared with the observation made in pure toluene,Citation50 whereby the aggregates of TPN-C3 and -C5 dissociated after 24 h, it took much longer for these aggregates to dissociate in heptol. These results highlight the influence of solvent quality on both aggregation and any later dissociation.
The PACs carrying polar functional groups, TPN-CN and TPN-CNAcid, were found to form large aggregates in heptol with hydrodynamic radii of ca. 600 and 1400 nm, respectively. After 168 h, TPN-CNAcid exhibited a significant reduction in particle size, to ca. 300 nm, while TPN-CN aggregates expanded to over 1000 nm. Such variations in particle size, evidenced by the large standard errors, imply the likelihood of a complex aggregation mechanism, resulting in a nonuniform size distributions, even after 168 h. As TPN-CNAcid is considered of greater polarity than TPN-CN, the differences observed at 168 h could be attributed to the precipitation of the clusters, consistent with previous studies that suggest that natural asphaltenes of different origins exhibit different precipitation characteristics.Citation72–74
Diffusion NMR of PACs
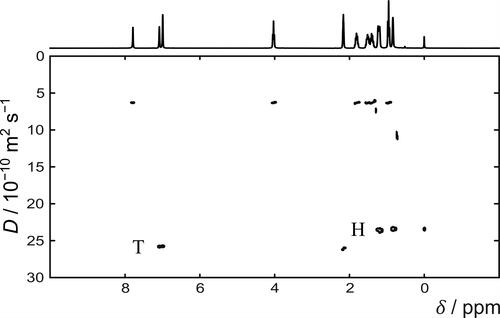
Diffusion NMR data of the set of model compounds were acquired as a function of time to supplement the light scattering measurements. The use of a mixed solvent, heptol, complicated the analysis of the diffusion NMR data because additional signals are introduced to the 1H spectra. shows a representative 1H DOSY spectrum of TPN-C5 in heptol-d. The 1H NMR spectrum of TPN-C5 shows the distinct chemical regions of the model compounds: aromatic groups at ca. 8 ppm, methoxy-groups at ca. 4 ppm, and alkyl chains at <2 ppm. However, the presence of n-heptane introduces three additional peaks in the alkyl region, resulting in overlapped signals in the 1H spectra and subsequent compromise diffusion coefficients in the DOSY spectra. Aromatic and methoxy peaks remain well-resolved and can be used to reliably estimate the diffusion coefficients for TPN-C0, TPN-C3, TPN-C5, and TPN-C10. However, it was not possible to obtain diffusion data of satisfactory quality for all the compounds studied. TPN-C1, TPN-CN, and TPN-CNAcid were found to form very large aggregates in both toluene and heptol solutions. The 1H NMR spectra of these samples were dominated by the solvent signals, while the peaks attributed to the PAC molecules themselves were very low in intensity, with broad signals in both the aromatic and aliphatic regions, resulting in unreliable estimation of diffusion coefficients. No diffusion data from these three species was used in this analysis. All 1H and DOSY spectra used in this study can be found in the Supporting Information.
Figure 2. 1H DOSY spectrum of 10 mg mL−1 solution of TPN-C5 in heptol-d. Residual toluene and heptane signals are indicated by T and H respectively.
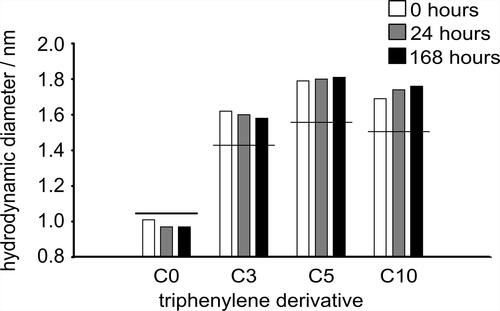
compares the hydrodynamic diameters estimated from the experimentally acquired diffusion coefficients for TPN-C0, TPN-C3, TPN-C5, and TPN-C10 with those predicted from the molecular weights of model compounds, using EquationEquation (2)(2)
(2) . As the SEGWE prediction yields the expected hydrodynamic diameter for a single molecule, any observed differences in diffusivity and, implicitly, hydrodynamic size can be attributed to the existence of nanoaggregates. Since TPN-C0 exhibited diffusion coefficients very similar to those predicted by EquationEquation (2)
(2)
(2) , it does not form stable nanoaggregates, consistent with the previous DLS results. The DOSY-NMR results for TPN-C3, TPN-C5, and TPN-C10, however, each indicate that the species in solution move slower than expected and, therefore, confirm the presence of nanoaggregates. The observed diffusion coefficients in a DOSY spectrum are a weighted average of the diffusion coefficients of all the species contributing to a given signal in the NMR spectrum. These data, therefore, also indicate that any aggregates formed are likely in dynamic equilibrium with single species. However, these aggregates are markedly different to, and much smaller than, the micrometer sized clusters indicated by the DLS results in . The solvent diffusion coefficients remain the same for all samples, indicating that any aggregates formed do not contain solvent molecules within the aggregates. Any discrepancy between results generated by DOSY NMR and DLS is not entirely surprising because the two techniques capture different fractions of the aggregates distribution: nanoaggregates are best detected by NMR, while large clusters can only be observed by DLS. It also highlights the importance of covering multiple length scales when studying the aggregation mechanisms of PACs.
Figure 3. Experimentally-acquired hydrodynamic diameters for TPN-C0, -C3, -C5, and -C10 in heptol-d solution at 0 (black), 24 (light grey), and 168 h (dark grey) after sample preparation. Predicted hydrodynamic diameters for single model compound molecules in heptol-d indicated by horizontal black bar.
Molecular dynamics simulations: Solute–solvent interactions
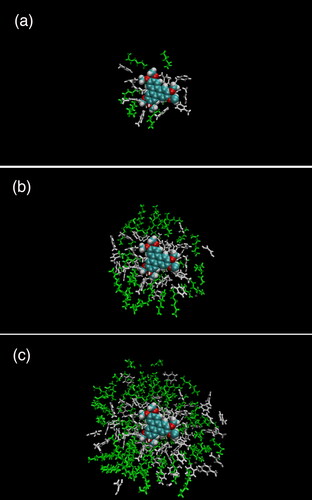
MD simulations were deployed to quantify the interactions between model PACs and both solvents present in the heptol solution. This data can be presented as a series of snapshots of the simulations () that offer a visual guide to the relative amounts of toluene (grey) and heptane (green) surrounding a PAC molecule, in this case, TPN-C1. Toluene molecules appear to dominate in regions close to the molecule. Further away, the difference in affinity reduces and equal numbers of the two solvents are present.
Figure 4. Set of snapshots of TPN-C1 in 50/50 heptol mixture, produced using VMD 1.9.3, with toluene molecules (gray) and heptane molecules (green) shown within (a) 0.5, (b) 1, and (c) 1.5 nm of the TPN molecule.
Such data can also be presented as histograms () whereby the percentage of toluene or n-heptane within each shell indicates the relative affinity of solvent molecules toward the model compound, with 50% indicating an equal affinity between solvents. This analysis methodology was used previouslyCitation75 to evaluate molecular interactions with aliphatic and aromatic hydrocarbons.
Figure 5. Percentage of toluene within successive shells 0.5, 1.0, and 1.5 nm from the aromatic surface of PAC molecules in a heptol simulation box over 100 ns simulation time. Horizontal dashed line indicates an equal toluene/n-heptane distribution. Error bars are 95% confidence interval around the mean (n = 25 samples).
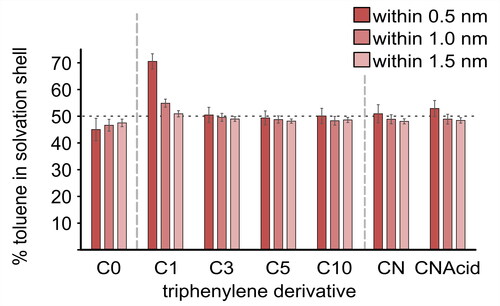
The unfunctionalized model compound (TPN-C0) showed a preference for n-heptane at all three distances sampled. However, variation in chemical structure, such as functionalizing the fused aromatic rings with even only methoxy groups, influences the preference toward toluene. For example, TPN-C1 showed the strongest affinity of all the model compounds toward toluene, with approximately 70% toluene within the 0.5 nm shell, decaying to 50% after 1.0 nm. The unexpected behavior of simulated TPN-C0 is likely caused by the lack of alkoxy substitution and consequent electron-withdrawing effect on the aromatic core. Alkoxy substitution leads to a relative electron deficiency on the TPN core, represented in the forcefield as partial positive atomic charges, and increased the affinity toward electron-rich toluene.
As the aliphatic chain length was increased in TPN-C3, -C5, and -C10, the strong preference for toluene was reduced. It is probable that an increased chain length of aliphatic branches enables closer association between n-heptane and the PAC, while at the same time repels the toluene. Longer aliphatic chains also limit the solute-toluene interaction to only the aromatic area of the model compound, contributing to the reduced presence of toluene close to the aromatic core.
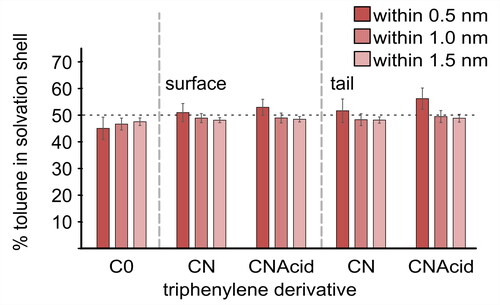
Neither TPN-CN nor TPN-CNAcid () showed any noticeable preference between the aromatic and alkane solvent, both of which are less polar than the amide and acid groups present. To further evaluate the effect of the polar functional groups on solvent preference, the analysis was repeated for the surface of the aromatic core and the aliphatic tails of both TPN-CN and TPN-CNAcid (). This indicates that the tail of TPN-CNAcid has a stronger affinity toward toluene than that of TPN-CN.
Figure 6. The percentage of toluene within successive shells 0.5, 1.0, and 1.5 nm from (left) the aromatic surface and (right) the aliphatic tail group of PAC molecules TPN-C0, -CN, and -CNAcid, suspended in a heptol simulation box over 100 ns simulation time. Horizontal dashed line indicates an equal toluene/n-heptane distribution. Error bars are 95% confidence interval around the mean (n = 25 samples).
Molecular dynamics simulations: Intermolecular interactions between PACs
To evaluate the effect of solvent on the intermolecular interactions between the PACs, MD simulations were carried out in three solvent boxes. PMF analysis was performed for all seven compounds, estimating the magnitude and nature of the intermolecular interactions between the PACs as a function of the solvents used. The potential of mean force curves of TPN-C3, C5, and C10 all feature a series of evenly spaced potential energy minima. These reveal the presence of π-stacking between individual model compound molecules and confirm the tendency to form nanometer-sized aggregates. shows a representative PMF analysis extracted from the simulation data of TPN-C3 in pure toluene (dark brown), 50/50 toluene/n-heptane (rust brown), and pure n-heptane (red) respectively. In addition to the distance and the magnitude of the interactions (), statistical analysis of the distance between molecules () and the angles between the aromatic cores of PAC molecules () is presented. shows explicit dimerization in the mixed solvent system, in accordance with the PMF, which is supported by the angle histogram (), which shows the TPN-C3 molecules aggregated in a parallel configuration, i.e. through π-stacking.
Figure 7. (a) Potential of mean forces between the centers-of-mass of TPN-C3 in 700 toluene molecules (dark brown), heptol (350 toluene molecules and 350 n-heptane) (rust brown) and 700 n-heptane molecules (red) over 100 ns simulation time. Data were normalized to 0 at 2.4 nm. (b) Histogram of aggregation distance between the centers of mass of TPN-C3 molecules in heptol during the simulation. (c) Histogram of angles between aromatic cores of TPN-C3 molecules in heptol during the simulation. Angle data was only recorded when aromatic groups are within 1.5 nm of each other.

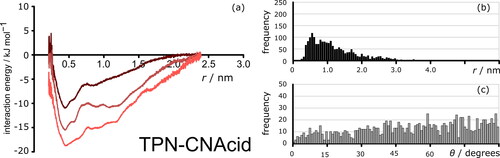
Different PMFs were observed for the two PACs with polar groups, TPN-CN and TPN-CNAcid. Both compounds exhibited broad PMFs, with a peak at ca. 0.5 nm and significant intensity at 1.0 nm and beyond. As the amount of n-heptane in solution is increased, while the major peaks did not change position, the depth of the interaction increased and shoulder peaks developed at distances >0.5 nm. A representative dataset for TPN-CNAcid is shown in .
Figure 8. (a) Potential of mean forces between the centers-of-mass of TPN-CNAcid in 700 toluene molecules (dark brown), heptol (350 toluene molecules and 350 n-heptane) (rust brown) and 700 n-heptane molecules (red) over 100 ns simulation time. Data was normalized to 0 at 2.4 nm. (b) Histogram of aggregation distance between the centers of mass of TPN-CNAcid molecules in heptol during the simulation. (c) Histogram of angles between aromatic cores of TPN- CNAcid molecules in heptol during the simulation. Angle data was only recorded when aromatic groups are within 1.5 nm of each other.
This analysis was also performed for TPN-C0, -C1, -C5, -C10, and -CN, for which a comprehensive set of figures based on MD simulations, including both potential of mean force analysis and radial distribution functions, can be found in the Supporting Information. The key features of this dataset, i.e. distances between molecules and the magnitudes of potential energy minima, are summarized in and .
Figure 9. Histograms of the interaction strength between PAC molecules in simulation boxes of (a) toluene, (b) heptol, and (c) n-heptane, normalized against that recorded at 2.4 nm. More than one interaction minima were observed for some compounds, indicating the existence of either multiple aggregation configurations or multiple molecules in one stack.
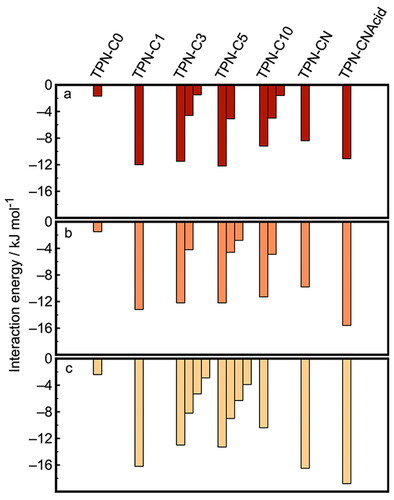
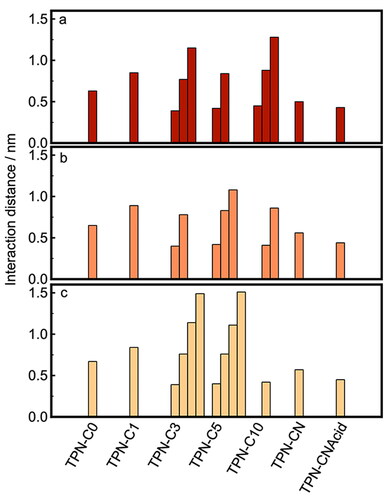
Figure 10. Histograms of the molecular distances corresponding to the potential energy minima between PAC molecules in simulation boxes of (a) toluene, (b) heptol, and (c) n-heptane.
The magnitude of the background thermal energy (1 kT) of all molecules examined was approximately 2.5 kJ mol‒1 at 298 K. Any observed interaction lower than 2.5 kJ mol‒1 will be insignificant. The interaction strengths between TPN-C0 molecules are smaller than this benchmark for all solvents used, toluene, heptol, and heptane, indicating that TPN-C0 molecules show little attraction to each other in any of the solvents used. This is consistent with experimental NMR and DLS data that indicates there was barely any aggregation observed for this molecular structure. The histogram (Figure SI.2.1) shows that the distance between TPN-C0 molecules followed a unimodal distribution centered around 3.0 nm. In the few cases when TPN-C0 molecules came close to one another, no preferred orientation, e.g. parallel or perpendicular stacking, was observed.
In contrast, TPN-C1 molecules in toluene exhibited strong interactions over a broad range of intermolecular distances between 0.7 and 2.0 nm, with a minimum interaction energy of −12.0 kJ mol‒1 observed at 0.85 nm (Figure SI.2.2). This leads to a significant aggregation observed in the simulation carried out, in agreement with previous MD studies of PAC aggregationCitation42–44 and echoes the results of the experimental measurements ( and ). Both the potential of mean force curve and the corresponding statistical analysis suggest that the parallel configuration was not favored by TPN-C1 molecules in toluene. However, once toluene was replaced by n-heptane, the interaction energies between the TPN-C1 molecules became stronger while the fine structure reveals several narrower minima. This is highly likely due to the changed configuration of TPN-C1 molecules in the aggregates, from loose to compact, as they become surrounded by an excessive amount of n-heptane. This is consistent with both the solvent affinity simulation that implies an increased affinity toward toluene and the light scattering data that shows a reduced particle size as n-heptane is added.
Series of narrow energy minima, indicative of parallel configurations, were observed from the PMF analysis of TPN-C3 (−11.5 kJ mol‒1 at 0.39 nm (Figure SI.2.3)), TPN-C5 (−12.2 kJ mol‒1 at 0.42 nm (Figure SI.2.4)), and TPN-C10 (−9.0 kJ mol‒1 at 0.45 nm (Figure SI.2.5)), as presented in . The first energy minimum for each of these molecules presents a shoulder, which is likely caused by the steric effects induced by the alkoxy tails presented around the aromatic core. The PMF curves also show secondary and tertiary interaction minima, indicating the parallel stacking of multiple molecules. The histograms of molecular orientation/angles for TPN-C3, -C5, and -C10 present a strong preference toward parallel configurations of the aromatic centers, supporting the hypothesis that the PACs form π-stacked aggregates. The magnitude of the energy minima increased both as the length of the alkyl branch chains was increased from propyl to pentyl and when n-heptane was added. For TPN-C10 in heptane, however, the fine characteristics of successive energy minima were no longer observed, replaced with a single broad interaction peak, which suggests that the favorable configurations were much less well-defined, and the resulting aggregates or clusters were not structurally ordered.
Both TPN-CN and TPN-CNAcid exhibited broad, rather featureless, potential energy curves (Figures SI.2.6 and SI.2.7), which suggests that they are prone to forming aggregates with a less uniform structure than those of the alkoxy-modified compounds. A major potential energy minimum was found between 0.3 and 0.4 nm, the characteristic feature for π-stacking. However, the much broader interaction peak observed, supported by the histogram data on angles of interaction, indicates a much greater range of possible configurations, including both head-to-tail and head-to-head arrangements, that TPN-CN and TPN-Acid molecules adopt when forming aggregates. The addition of n-heptane increased both the width and magnitude of the energy minima, suggesting a higher tendency for these model compounds to aggregate in alkane solutions.
Discussion
Effect of chain length on aggregation in mixed solvents
TPN-C0: As the benchmark compound, experimental hydrodynamic diameters determined by both DLS () and diffusion NMR () indicate that the presence of 60% n-heptane was not sufficient to facilitate aggregation. MD simulations of TPN-C0 confirm that aggregation occurs neither in a mixed heptol solvent nor in pure n-heptane. PMF data ( and SI.2.1) does show a minor attractive interaction between TPN-C0 molecules, albeit lower than the background thermal energy of the systems studied. The finding is supported by the angle and distance histograms captured, showing a low occurrence of collisions and an absence of any preferred angle of interaction. Previous studies proposed that whether π-stacking is or is not the major driving mechanism for aggregation in natural asphaltenes depends on the size/number of the aromatic rings. With only a limited number of aromatic rings, TPN-C0 likely does not have an aromatic surface that is large enough to facilitate π-stacking.Citation4,Citation69,Citation76–80
Tpn-C1: DLS data suggest that the addition of n-heptane results in aggregates with slightly smaller hydrodynamic diameters than those found in pure toluene.Citation50 Such an aggregation mechanism is consistent with previous studies where the addition of the alkoxy groups surrounding the triphenylene core was found to facilitate the aggregation between the aromatic molecules.Citation81,Citation82 Solvent affinity simulations () suggest that TPN-C1 molecules experienced a far greater attraction toward toluene than n-heptane. Interactions between the methoxy groups appear to counteract the aromatic-aromatic interactions between the relatively small aromatic surface of TPN-C1. No angle dependence of TPN-C1 aggregation was observed (Figure SI.2.2), indicating that there is very little π-stacking between the TPN-C1 molecules and that random configurations are preferred. This is likely because the methoxy groups present in TPN-C1 are not long enough to impose a stacking configuration that would not only limit the size of the aggregates but also stabilize the self-associated assembles.
TPN-C3 and -C5: Once the length of the alkoxy branch was further extended to propyl and pentyl, the PAC molecules showed less sensitivity between aromatic and n-alkane solvents than TPN-C1 (), and the change in solvent did not facilitate aggregation. The hydrodynamic diameters of TPN-C3 and -C5 recorded by DLS () and DOSY () in heptol show the existence of both large clusters and nanoaggregates. Multiple minima, spaced by a consistent intermolecular distance of ca. 0.4 nm, were observed in the PMF data of TPN-C3 and -C5 in both heptol and pure n-heptane (, SI.2.3, and SI.2.4), evidence for an explicit preference toward π-stackingCitation79 in agreement with previous experimental results confirming that TPN-C3 forms columnar crystalline phases while TPN-C1 cannot due to insufficient steric ordering.Citation83 Both the close range and low intermolecular angle recorded from the PMF simulations of TPN-C3 and -C5 acquired in heptol confirm the π-stacking configuration. The addition of heptane increases the magnitude of the potential energy minimum.
TPN-c10: Despite one of the six propyl branches being replaced by a decyl chain, TPN-C10 exhibited very similar characteristics to that of both TPN-C3 and TPN-C5. DLS results show that TPN-C10 molecules formed large clusters in heptol which remained stable for an extended period of time. NMR experiments captured the coexistence of nanoaggregates, likely consisting of only a few molecules stacked closely together. All of the MD simulations of TPN-C3, TPN-C5, and TPN-C10 (Figures SI.2.3–SI.2.5) in toluene and heptol show similar behavior: a series of potential energy minima of decreasing depth spaced by ca. 0.4 nm, a characteristic of π-stacking. Therefore, the increased hydrodynamic diameter of TPN-C10 aggregates that remained stable for 168 h can be attributed to the single increased chain length, the only difference between TPN-C3 and TPN-C10. The angle and distance histogram results of TPN-C10 suggest that planar configurations within the aggregates remain the preferred option, which is consistent with previous studies that have shown that longer tails limit potential configurations.Citation5 The finding established from TPN-C10 indicates that non-centrosymmetric molecular structures with long side chains could have an increased affinity toward n-alkane solvent species, as would be expected of a model compound that replicates asphaltenes that are soluble in toluene but insoluble in n-heptane.Citation21,Citation84,Citation85
Solvophobic effects were only observed for TPN-C0 and TPC-C1. For TPN-C3, TPN-C5, and TPN-C10, the formation of nanoaggregates occurs in a similar manner in n-heptane as it does in toluene, with the surrounding alkyl chains imposing a π-stacking configuration. However, a slow dissociation of the large clusters initially formed was recorded by DLS measurements. It is very probable that once the alkyl tail-groups are long enough to favor a parallel (π-stacked) configuration, the nature of the solvent has a limited impact on the aggregation mechanism.Citation81–83 Changes in solvent composition appear to change how aggregation progresses, e.g. forming clusters with a great aggregation number, rather than initiating the aggregation.
Effect of amide and acid groups on aggregation in mixed solvent
TPN-CN and -CNAcid: The presence of polar functional groups, such as amides (TPN-CN) and acids (TPN-CNAcid), significantly increases the likelihood of aggregation of aromatic hydrocarbons in toluene.Citation50 While the aggregates formed in heptol were too large to measure using diffusion NMR, DLS results () show the presence of larger aggregates than in pure toluene for both TPN-CN and TPN-CNAcid, with a notable difference between their kinetics: the sizes of TPN-CN aggregates appeared to progressively increase, while those of TPN-CNAcid aggregates decreased over the same period.
Solvent affinity simulations () suggest that neither TPN-CN nor TPN-CNAcid exhibits an excessively strong attraction or repulsion toward either toluene or n-heptane. However, when studying the solvent affinity of the aliphatic moieties only (), the acid and amide groups exhibit a stronger affinity toward toluene, indicating that the greater electron density of the acid and amide groups attract the aromatic solvent. There was no evidence of π-stacking in the PMF results for either TPN-CN or TPN-CNAcid (, SI.2.6, and SI.2.7) in any of the solvent mixtures. The histograms obtained from the MD simulations in heptol indicate no preferred angles of interactions and the configurations observed in MD simulations showed both tail-to-head and head-to-head formations. These results suggest that the primary driving force for aggregation of TPN-CN and TPN-CNAcid lies in the functional groups, rather than the aromatic cores.
The PMF analyses of TPN-CN and TPN-CNAcid display similar changes as the n-heptane was introduced to toluene. In pure n-heptane, there is a significant increase in both magnitude and width of the potential energy minimum, suggesting that the added alkane molecules facilitated greater interaction between the aromatic compounds, which is consistent with what has been observed in natural asphaltenes.Citation6 The potential energy curve for TPN-CN data exhibits only a small change in the heptol solvent but a larger one when toluene is completely replaced by n-heptane. The aggregation of TPN-CN appears to be disordered in all solvents studied. While the PMF analysis does show a deep interaction centered at 0.5 nm, this is very broad and has no significant peaks in the angle histogram, consistent with a previous study.Citation79 By contrast, the PMFs of TPN-CNAcid shows a gradual change as n-heptane replaces toluene. The interaction peak in the PMF remains very broad, implying a number of possible configurations, nevertheless the TPN–TPN interaction energy, indicating its propensity to aggregate, increases.
Direct comparison between TPN-CN and TPN-CNAcid supports the hypothesis that acid groups play a major role in the aggregation of PACs. They not only facilitate aggregation, but also lead to significantly different configurations, which subsequently alter the macroscopic properties and behavior of the aggregates formed. This is consistent with previous studies whereby model PACs containing acid functional groups were observed to aggregate at oil/water interfaces; the aromatic cores subsequently driving a reconfiguration process that aligned the molecules in parallel configurations.Citation48,Citation86,Citation87 In these studies, the increased polar attractions proved the substantial drive to aggregation rather than the electron clouds present on the aromatic surface.Citation88,Citation89 However, once aggregated, the π-stacking interactions facilitate the re-configuration of the aggregates into the most energetically favorable configuration, parallel, due to the aromatic cores of the molecules.Citation90 This conclusion is consistent with recently reported experimental observations concerning asphaltenes that are either strongly or weakly interfacially active.Citation91,Citation92
Conclusions
A combination of experimental and computational approaches was deployed to systematically investigate the effect of solvent composition on the aggregation characteristics and kinetics of a set of model PACs. Light scattering and diffusion NMR data indicated that the hydrodynamic diameters of the aggregates cover a broad range, from a few nm to several μm, of which the molecular details were studied by MD simulations.
The aggregation of polycyclic aromatic hydrocarbons is determined by a balance between several different interactions: (1) π–π interactions between the aromatic cores, (2) interactions between any polar groups present, (3) steric hindrance caused by the side chains, and (4) the degree of solvation by toluene. The results acquired in the present work suggest that the structures of the compounds are the major factors in how the model compounds aggregate. The presence of the polar groups, both amide and acid, facilitates the formation of macroaggregates. While polar attractions overshadow the molecular attractions driven by van der Waals interactions, they are generally less sensitive to the solvent used. Side chains facilitate the formation of π-stacked nanoaggregates, however, this behavior was only observed when the alkyl groups are suitably long. It appears to require the presence of a long, possibly asymmetric, alkyl chain for the addition of n-heptane to induce the formation of macroaggregates in this sub-set of the model compounds. For the compounds that initially form large aggregates in toluene, the change in solvent promotes the development of larger aggregates still.
Naturally occurring PACs, such as asphaltenes, possess a wide range of aromatic cores, side chains of different lengths and polar groups, and are much more complex than the molecules investigated here. However, the methodology and the underpinning knowledge established through this work could be readily applied to polycyclic aromatic hydrocarbons of increasing complexity, with variations in the nature of the polar groups present, any alkyl chains attached and their dispersity, or the size of the aromatic cores.
Author contributions
The manuscript was written through contributions of all authors and all authors have given approval to the final version of the manuscript.
Supplemental Material
Download MS Word (1.2 MB)Disclosure statement
No potential conflict of interest was reported by the author(s).
Additional information
Funding
References
- J. S. Buckley, “Predicting the Onset of Asphaltene Precipitation from Refractive Index Measurements,” Energy & Fuels 13, no. 2 (1999): 328–32. doi:10.1021/ef980201c.
- G. Porte, H. Zhou, and V. Lazzeri, “Reversible Description of Asphaltene Colloidal Association and Precipitation,” Langmuir 19, no. 1 (2003): 40–47. doi:10.1021/la0260279.
- I. A. Wiehe, Process Chemistry of Petroleum Macromolecules (Boca Raton, FL: CRC Press, 2008).
- M. R. Gray, R. R. Tykwinski, J. M. Stryker, and X. Tan, “Supramolecular Assembly Model for Aggregation of Petroleum Asphaltenes,” Energy & Fuels 25, no. 7 (2011): 3125–34. doi:10.1021/ef200654p.
- C. Jian, T. Tang, and S. Bhattacharjee, “Probing the Effect of Side-Chain Length on the Aggregation of a Model Asphaltene Using Molecular Dynamics Simulations,” Energy & Fuels 27, no. 4 (2013): 2057–67. doi:10.1021/ef400097h.
- O. C. Mullins, “The Modified Yen Model,” Energy & Fuels 24, no. 4 (2010): 2179–207. doi:10.1021/ef900975e.
- B. Zhao and J. M. Shaw, “Composition and Size Distribution of Coherent Nanostructures in Athabasca Bitumen and Maya Crude Oil,” Energy & Fuels 21, no. 5 (2007): 2795–804. doi:10.1021/ef070119u.
- F. Mostowfi, K. Indo, O. C. Mullins, and R. McFarlane, “Asphaltene Nanoaggregates Studied by Centrifugation,” Energy & Fuels 23, no. 3 (2009): 1194–200. doi:10.1021/ef8006273.
- B. Schuler, Y. Zhang, F. Liu, A. E. Pomerantz, A. B. Andrews, L. Gross, V. Pauchard, S. Banerjee, and O. C. Mullins, “Overview of Asphaltene Nanostructures and Thermodynamic Applications,” Energy & Fuels 34, no. 12 (2020): 15082–105. doi:10.1021/acs.energyfuels.0c00874.
- M. L. Waters, “Aromatic Interactions in Model Systems,” Current Opinion in Chemical Biology 6, no. 6 (2002): 736–41. doi:10.1016/S1367-5931(02)00359-9.
- S. Wang, J. Liu, L. Zhang, J. Masliyah, and Z. Xu, “Interaction Forces between Asphaltene Surfaces in Organic Solvents,” Langmuir 26, no. 1 (2010): 183–90. doi:10.1021/la9020004.
- M. P. Hoepfner, C. Vilas Bôas Fávero, N. Haji-Akbari, and H. S. Fogler, “The Fractal Aggregation of Asphaltenes,” Langmuir 29, no. 28 (2013): 8799–808. doi:10.1021/la401406k.
- S. M. Hashmi and A. Firoozabadi, “Effect of Dispersant on Asphaltene Suspension Dynamics: aggregation and Sedimentation,” The Journal of Physical Chemistry B 114, no. 48 (2010): 15780–88. doi:10.1021/jp107548j.
- Y. Zhang, M. Siski, M. R. Gray, C. C. Walters, and R. P. Rodgers, “Mechanisms of Asphaltene Aggregation: Puzzles and a New Hypothesis,” Energy & Fuels 34, no. 8 (2020): 9094–107. doi:10.1021/acs.energyfuels.0c01564.
- P. Wattana, “Precipitation and Characterization of Petroleum Asphaltenes” (PhD thesis, University of Michigan, 2004).
- T. Maqbool, A. T. Balgoa, and H. S. Fogler, “Revisiting Asphaltene Precipitation from Crude Oils: A Case of Neglected Kinetic Effects,” Energy & Fuels 23, no. 7 (2009): 3681–86. doi:10.1021/ef9002236.
- T. Maqbool, P. Srikiratiwong, and H. S. Fogler, “Effect of Temperature on the Precipitation Kinetics of Asphaltenes,” Energy & Fuels 25, no. 2 (2011): 694–700. doi:10.1021/ef101112r.
- I. A. Wiehe, and R. J. Kennedy, “The Oil Compatibility Model and Crude Oil Incompatibility,” Energy & Fuels 14, no. 1 (2000): 56–59. doi:10.1021/ef990133+.
- S. W. Hasan, M. T. Ghannam, and N. Esmail, “Heavy Crude Oil Viscosity Reduction and Rheology for Pipeline Transportation,” Fuel 89, no. 5 (2010): 1095–100. doi:10.1016/j.fuel.2009.12.021.
- I. K. Yudin, G. L. Nikolaenko, E. E. Gorodetskii, E. L. Markhashov, V. A. Agayan, M. A. Anisimov, and J. V. Sengers, “Crossover Kinetics of Asphaltene Aggregation in Hydrocarbon Solutions,” Physica A: Statistical Mechanics and Its Applications 251, no. 1–2 (1998): 235–44. doi:10.1016/S0378-4371(97)00607-9.
- O. C. Mullins, E. Y. Sheu, A. Hammami, and A. G. Marshall, Asphaltenes, Heavy Oils, and Petroleomics (New York: Springer, 2007).
- I. K. Yudin, G. L. Nikolaenko, E. E. Gorodetskii, V. I. Kosov, V. R. Melikyan, E. L. Markhashov, D. Frot, and Y. Briolant, “Mechanisms of Asphaltene Aggregation in Toluene–Heptane Mixtures,” Journal of Petroleum Science and Engineering 20, no. 3–4 (1998): 297–301. doi:10.1016/S0920-4105(98)00033-3.
- J.-A. Östlund, S.-I. Andersson, and M. Nydén, “Studies of Asphaltenes by the Use of Pulsed-Field Gradient Spin Echo NMR,” Fuel 80, no. 11 (2001): 1529–33. doi:10.1016/S0016-2361(01)00030-8.
- E. Durand, M. Clemancey, A. A. Quoineaud, J. Verstraete, D. Espinat, and J. M. Lancelin, “1H Diffusion-Ordered Spectroscopy (DOSY) Nuclear Magnetic Resonance (NMR) as a Powerful Tool for the Analysis of Hydrocarbon Mixtures and Asphaltenes,” Energy & Fuels 22, no. 4 (2008): 2604–10. doi:10.1021/ef700775z.
- E. Durand, M. Clemancey, J. M. Lancelin, J. Verstraete, D. Espinat, and A. A. Quoineaud, “Aggregation States of Asphaltenes: Evidence of Two Chemical Behaviors by 1H Diffusion-Ordered Spectroscopy Nuclear Magnetic Resonance,” The Journal of Physical Chemistry C 113, no. 36 (2009): 16266–76. doi:10.1021/jp901954b.
- E. Durand, M. Clemancey, J. M. Lancelin, J. Verstraete, D. Espinat, and A. A. Quoineaud, “Effect of Chemical Composition on Asphaltenes Aggregation,” Energy & Fuels 24, no. 2 (2010): 1051–62. doi:10.1021/ef900599v.
- J.-P. Korb, A. Louis-Joseph, and L. Benamsili, “Probing Structure and Dynamics of Bulk and Confined Crude Oils by Multiscale NMR Spectroscopy, Diffusometry, and Relaxometry,” The Journal of Physical Chemistry B 117, no. 23 (2013): 7002–14. doi:10.1021/jp311910t.
- M. Jones, and S. E. Taylor, “NMR Relaxometry and Diffusometry in Characterizing Structural, Interfacial and Colloidal Properties of Heavy Oils and Oil Sands,” Advances in Colloid and Interface Science 224 (2015): 33–45. doi:10.1016/j.cis.2015.07.007.
- E. V. Morozov, P. V. Yushmanov, and O. N. Martyanov, “Temperature-Triggered Rearrangement of Asphaltene Aggregates as Revealed by Pulsed-Field Gradient NMR,” Energy & Fuels 33, no. 8 (2019): 6934–45. doi:10.1021/acs.energyfuels.9b00600.
- I. A. Wiehe, H. W. Yarranton, K. Akbarzadeh, P. M. Rahimi, and A. Teclemariam, “The Paradox of Asphaltene Precipitation with Normal Paraffins,” Energy & Fuels 19, no. 4 (2005): 1261–67. doi:10.1021/ef0496956.
- B. Breure, D. Subramanian, J. Leys, C. J. Peters, and M. A. Anisimov, “Modeling Asphaltene Aggregation with a Single Compound,” Energy & Fuels 27, no. 1 (2013): 172–76. doi:10.1021/ef3016766.
- Robel B. Teklebrhan, Lingling Ge, Subir Bhattacharjee, Zhenghe Xu, and Johan Sjöblom, “Probing Structure-Nanoaggregation Relations of Polyaromatic Surfactants: A Molecular Dynamics Simulation and Dynamic Light Scattering Study,” The Journal of Physical Chemistry. B 116, no. 20 (2012): 5907–18. doi:10.1021/jp3010184.
- J. Eyssautier, D. Frot, and L. Barré, “Structure and Dynamic Properties of Colloidal Asphaltene Aggregates,” Langmuir 28, no. 33 (2012): 11997–2004. doi:10.1021/la301707h.
- C. S. Johnson, “Diffusion Ordered Nuclear Magnetic Resonance Spectroscopy: principles and Applications,” Progress in Nuclear Magnetic Resonance Spectroscopy 34, no. 3–4 (1999): 203–56. doi:10.1016/S0079-6565(99)00003-5.
- E. O. Stejskal and J. E. Tanner, “Spin Diffusion Measurements: Spin Echoes in the Presence of a Time‐Dependent Field Gradient,” The Journal of Chemical Physics 42, no. 1 (1965): 288–92. doi:10.1063/1.1695690.
- R. Tanaka, E. Sato, J. E. Hunt, R. E. Winans, S. Sato, and T. Takanohashi, “Characterization of Asphaltene Aggregates Using X-Ray Diffraction and Small-Angle X-Ray Scattering,” Energy & Fuels 18, no. 4 (2004): 1118–25. doi:10.1021/ef034082z.
- J.-N. Roux, D. Broseta, and B. Demé, “SANS Study of Asphaltene Aggregation: Concentration and Solvent Quality Effects,” Langmuir 17, no. 16 (2001): 5085–92. doi:10.1021/la0101651.
- T. F. Headen, E. S. Boek, J. Stellbrink, and U. M. Scheven, “Small Angle Neutron Scattering (SANS and V-SANS) Study of Asphaltene Aggregates in Crude Oil,” Langmuir 25, no. 1 (2009): 422–28. doi:10.1021/la802118m.
- D. Espinat, D. Fenistein, L. Barré, D. Frot, and Y. Briolant, “Effect of Temperature and Pressure on Asphaltenes Agglomeration in Toluene. A Light, X-Ray, and Neutron Scattering Investigation,” Energy & Fuels 18, no. 5 (2004): 1243–49. doi:10.1021/ef030190+.
- J. Eyssautier, P. Levitz, D. Espinat, J. Jestin, J. Gummel, I. Grillo, and L. Barré, “Insight into Asphaltene Nanoaggregate Structure Inferred by Small Angle Neutron and X-Ray Scattering,” The Journal of Physical Chemistry B 115, no. 21 (2011): 6827–37. doi:10.1021/jp111468d.
- A. Hemmati-Sarapardeh, B. Dabir, M. Ahmadi, A. H. Mohammadi, and M. M. Husein, “Toward Mechanistic Understanding of Asphaltene Aggregation Behaviour in Toluene: The Roles of Asphaltene Structure, Aging Time, Temperature, and Ultrasonic Radiation,” Journal of Molecular Liquids 264 (2018): 410–24. doi:10.1016/j.molliq.2018.04.061.
- T. F. Headen, E. S. Boek, G. Jackson, T. S. Totton, and E. A. Müller, “Simulation of Asphaltene Aggregation through Molecular Dynamics: Insights and Limitations,” Energy & Fuels 31, no. 2 (2017): 1108–25. doi:10.1021/acs.energyfuels.6b02161.
- M. Sedghi, L. Goual, W. Welch, and J. Kubelka, “Effect of Asphaltene Structure on Association and Aggregation Using Molecular Dynamics,” The Journal of Physical Chemistry B 117, no. 18 (2013): 5765–76. doi:10.1021/jp401584u.
- T. F. Headen, E. S. Boek, and N. T. Skipper, “Evidence for Asphaltene Nanoaggregation in Toluene and Heptane from Molecular Dynamics Simulations,” Energy & Fuels 23, no. 3 (2009): 1220–29. doi:10.1021/ef800872g.
- S. Yaseen and G. A. Mansoori, “Molecular Dynamics Studies of Interaction between Asphaltenes and Solvents,” Journal of Petroleum Science and Engineering 156 (2017): 118–24. doi:10.1016/j.petrol.2017.05.018.
- M. H. Khalaf and G. A. Mansoori, “A New Insight into Asphaltenes Aggregation Onset at Molecular Level in Crude Oil (an MD Simulation Study),” Journal of Petroleum Science and Engineering 162 (2018): 244–50. doi:10.1016/j.petrol.2017.12.045.
- M. Thomas, I. Suarez-Martinez, L.-J. Yu, A. Karton, G. S. Chandler, M. Robinson, I. Cherchneff, D. Talbi, and D. Spagnoli, “Atomistic Simulations of the Aggregation of Small Aromatic Molecules in Homogenous and Heterogenous Mixtures,” Physical Chemistry Chemical Physics 22, no. 37 (2020): 21005–14. doi:10.1039/d0cp02622k.
- X. Tan, H. Fenniri, and M. R. Gray, “Pyrene Derivatives of 2,2′-Bipyridine as Models for Asphaltenes: Synthesis, Characterization, and Supramolecular Organization,” Energy & Fuels 22, no. 2 (2008): 715–20. doi:10.1021/ef700395g.
- J. Sjöblom, S. Simon, and Z. Xu, “Model Molecules Mimicking Asphaltenes,” Advances in Colloid and Interface Science 218 (2015): 1–16. doi:10.1016/j.cis.2015.01.002.
- D. Simionesie, G. O’Callaghan, R. Laurent, J. A. Preece, R. Evans, and Z. J. Zhang, “Combined Experimental and Computational Study of Polyaromatic Hydrocarbon Aggregation: Isolating the Effect of Attached Functional Groups,” Industrial & Engineering Chemistry Research 58, no. 45 (2019): 20505–15. doi:10.1021/acs.iecr.9b04105.
- R. Pecora, Dynamic Light Scattering: Applications of Photon Correlation Spectroscopy (New York: Springer, 2013).
- A. Vaccaro, J. Šefčík, and M. Morbidelli, “Characterization of Colloidal Polymer Particles through Stability Ratio Measurements,” Polymer 46, no. 4 (2005): 1157–67. doi:10.1016/j.polymer.2004.11.058.
- A. Jerschow and N. Müller, “Suppression of Convection Artifacts in Stimulated-Echo Diffusion Experiments. Double-Stimulated-Echo Experiments,” Journal of Magnetic Resonance 125, no. 2 (1997): 372–75. doi:10.1006/jmre.1997.1123.
- M. Nilsson, “The DOSY Toolbox: A New Tool for Processing PFG NMR Diffusion Data,” Journal of Magnetic Resonance 200, no. 2 (2009): 296–302. doi:10.1016/j.jmr.2009.07.022.
- A. Gierer, and K. Wirtz, “Molekulare Theorie Der Mikroreibung,” Zeitschrift für Naturforschung A 8, no. 9 (1953): 532–38. doi:10.1515/zna-1953-0903.
- R. Evans, Z. Deng, A. K. Rogerson, A. S. McLachlan, J. J. Richards, M. Nilsson, and G. A. Morris, “Quantitative Interpretation of Diffusion-Ordered NMR Spectra: Can We Rationalize Small Molecule Diffusion Coefficients?,” Angewandte Chemie (International Edition in English) 52, no. 11 (2013): 3199–202. doi:10.1002/anie.201207403.
- C. Jian, “Molecular Dynamics Investigation on the Aggregation of Polyaromatic Compounds in Water and Organic Solvents” (PhD thesis, University of Alberta, 2015).
- D. van der Spoel, E. Lindahl, B. Hess, and The Gromacs Development Team, Gromacs User Manual (version 4.6.5) (2013).
- A. R. Leach, Molecular Modelling: Principles and Applications, 2nd ed. (London: Pearson Education, 2001).
- G. Bussi, D. Donadio, and M. Parrinello, “Canonical Sampling through Velocity Rescaling,” The Journal of Chemical Physics 126, no. 1 (2007): 014101. doi:10.1063/1.2408420.
- J. D. Chodera, “A Simple Method for Automated Equilibration Detection in Molecular Simulations,” Journal of Chemical Theory and Computation 12, no. 4 (2016): 1799–805. doi:10.1021/acs.jctc.5b00784.
- M. R. Shirts and J. D. Chodera, “Statistically Optimal Analysis of Samples from Multiple Equilibrium States,” The Journal of Chemical Physics 129, no. 12 (2008): 124105. doi:10.1063/1.2978177.
- E. S. Boek, D. S. Yakovlev, and T. F. Headen, “Quantitative Molecular Representation of Asphaltenes and Molecular Dynamics Simulation of Their Aggregation,” Energy & Fuels 23, no. 3 (2009): 1209–19. doi:10.1021/ef800876b.
- J. Costa, D. Simionesie, P. Mulhera, and Z. J. Zhang, “Aggregation of Model Asphaltenes: A Molecular Dynamics Study,” Journal of Physics. Condensed Matter 28, no. 39 (2016): 394002. doi:10.1088/0953-8984/28/39/394002.
- T. Darden, D. York, and L. Pedersen, “Particle Mesh Ewald: An Nlog(N) Method for Ewald Sums in Large Systems,” The Journal of Chemical Physics 98, no. 12 (1993): 10089–92. doi:10.1063/1.464397.
- T. F. Headen, P. L. Cullen, R. Patel, A. Taylor, and N. T. Skipper, “The Structures of Liquid Pyridine and Naphthalene: The Effects of Heteroatoms and Core Size on Aromatic Interactions,” Physical Chemistry Chemical Physics 20, no. 4 (2018): 2704–15. doi:10.1039/c7cp06689a.
- T. F. Headen and M. P. Hoepfner, “Predicting Asphaltene Aggregate Structure from Molecular Dynamics Simulation: Comparison to Neutron Total Scattering Data,” Energy & Fuels 33, no. 5 (2019): 3787–95. doi:10.1021/acs.energyfuels.8b03196.
- N. Michaud, ‐Agrawal, E. J. Denning, T. B. Woolf, and O. Beckstein, “MDAnalysis: A Toolkit for the Analysis of Molecular Dynamics Simulations,” Journal of Computational Chemistry 32, no. 10 (2011): 2319–27. doi:10.1002/jcc.21787.
- R. J. Gowers, M. Linke, J. Barnoud, T. J. E. Reddy, M. N. Melo, S. L. Seyler, D. L. Dotson, J. Domanski, S. Buchoux, I. M. Kenney, et al. “MDAnalysis: A Python Package for the Rapid Analysis of Molecular Dynamics Simulations,” in Proceedings of the 15th Python in Science Conference, edited by S. Benthall and S. Rostrup (Austin, TX: Scipy, 2016), 98–105.
- K. Oh, T. A. Ring, and M. D. Deo, “Asphaltene Aggregation in Organic Solvents,” Journal of Colloid and Interface Science 271, no. 1 (2004): 212–19. doi:10.1016/j.jcis.2003.09.054.
- K. Mannistu, H. Yarranton, and J. Masliyah, “Solubility Modeling of Asphaltenes in Organic Solvents,” Energy & Fuels 11, no. 3 (1997): 615–22. doi:10.1021/ef9601879.
- S. Badre, C. C. Goncalves, K. Norinaga, G. Gustavson, and O. C. Mullins, “Molecular Size and Weight of Asphaltene and Asphaltene Solubility Fractions from Coals, Crude Oils and Bitumen,” Fuel 85, no. 1 (2006): 1–11. doi:10.1016/j.fuel.2005.05.021.
- P. Painter, B. Veytsman, and J. Youtcheff, “Asphaltene Aggregation and Solubility,” Energy & Fuels 29, no. 4 (2015): 2120–33. doi:10.1021/ef5024912.
- J. Wang and J. Buckley, “A Two-Component Solubility Model of the Onset of Asphaltene Flocculation in Crude Oils,” Energy & Fuels 15, no. 5 (2001): 1004–12. doi:10.1021/ef010012l.
- S. Figueroa-Gerstenmaier, S. Giudice, L. Cavallo, and G. Milano, “A Molecular Model for H(2) Interactions in Aliphatic and Aromatic Hydrocarbons,” Physical Chemistry Chemical Physics 11, no. 20 (2009): 3935–42. doi:10.1039/b900176j.
- J. Murgich, “Intermolecular Forces in Aggregates of Asphaltenes and Resins,” Petroleum Science and Technology 20, no. 9–10 (2002): 983–97. doi:10.1081/LFT-120003692.
- X. Tan, H. Fenniri, and M. R. Gray, “Water Enhances the Aggregation of Model Asphaltenes in Solution via Hydrogen Bonding,” Energy & Fuels 23, no. 7 (2009): 3687–93. doi:10.1021/ef900228s.
- S. R. Stoyanov, C. X. Yin, M. R. Gray, J. M. Stryker, S. Gusarov, and A. Kovalenko, “Computational and Experimental Study of the Structure, Binding Preferences, and Spectroscopy of Nickel(II) and Vanadyl Porphyrins in Petroleum,” The Journal of Physical Chemistry. B 114, no. 6 (2010): 2180–88. doi:10.1021/jp908641t.
- L. Moreira da Costa, S. R. Stoyanov, S. Gusarov, P. R. Seidl, J. Walkimar de, M. Carneiro, and A. Kovalenko, “Computational Study of the Effect of Dispersion Interactions on the Thermochemistry of Aggregation of Fused Polycyclic Aromatic Hydrocarbons as Model Asphaltene Compounds in Solution,” The Journal of Physical Chemistry. A 118, no. 5 (2014): 896–908. doi:10.1021/jp408005h.
- Y. Aray, R. Hernández-Bravo, J. G. Parra, J. Rodríguez, and D. S. Coll, “Exploring the Structure-Solubility Relationship of Asphaltene Models in Toluene, Heptane, and Amphiphiles Using a Molecular Dynamic Atomistic Methodology,” The Journal of Physical Chemistry A 115, no. 42 (2011): 11495–507. doi:10.1021/jp204319n.
- S. Kumar, “Recent Developments in the Chemistry of Triphenylene-Based Discotic Liquid Crystals,” Liquid Crystals 31, no. 8 (2004): 1037–59. doi:10.1080/02678290410001724746.
- T. Bast and R. Hentschke, “Molecular Dynamics Simulation of a Micellar System: 2,3,6,7,10,11-Hexakis (1,4,7-Trioxaoctyl) Triphenylene in Water,” The Journal of Physical Chemistry 100, no. 30 (1996): 12162–71. doi:10.1021/jp953790l.
- Richard J. Bushby, Neville Boden, Colin A. Kilner, Owen R. Lozman, Zhibao Lu, Quanying Liu, and Mark A. Thornton-Pett, “Helical Geometry and Liquid Crystalline Properties of 2,3,6,7,10,11-Hexaalkoxy-1-Nitrotriphenylenes,” Journal of Materials Chemistry 13, no. 3 (2003): 470–74. doi:10.1039/b211133k.
- H. Groenzin and O. C. Mullins, “Asphaltene Molecular Size and Structure,” The Journal of Physical Chemistry A 103, no. 50 (1999): 11237–45. doi:10.1021/jp992609w.
- Oliver C. Mullins, Hassan Sabbah, Joëlle Eyssautier, Andrew E. Pomerantz, Loïc Barré, A. Ballard Andrews, Yosadara Ruiz-Morales, Farshid Mostowfi, Richard McFarlane, Lamia Goual, et al, “Advances in Asphaltene Science and the Yen–Mullins Model,” Energy & Fuels 26, no. 7 (2012): 3986–4003. doi:10.1021/ef300185p.
- P. V. Hemmingsen, A. Silset, A. Hannisdal, and J. Sjöblom, “Emulsions of Heavy Crude Oils. I: Influence of Viscosity, Temperature, and Dilution,” Journal of Dispersion Science and Technology 26, no. 5 (2005): 615–27. doi:10.1081/DIS-200057671.
- Erland L. Nordgård, Geir Sørland, and Johan Sjöblom, “Behavior of Asphaltene Model Compounds at W/O Interfaces,” Langmuir 26, no. 4 (2010): 2352–60. doi:10.1021/la902801c.
- P. Chakrabarti and R. Bhattacharyya, “Geometry of Nonbonded Interactions Involving Planar Groups in Proteins,” Progress in Biophysics and Molecular Biology 95, no. 1–3 (2007): 83–137. doi:10.1016/j.pbiomolbio.2007.03.016.
- G. B. McGaughey, M. Gagné, and A. K. Rappé, “π-Stacking Interactions. Alive and Well in Proteins,” The Journal of Biological Chemistry 273, no. 25 (1998): 15458–63. doi:10.1074/jbc.273.25.15458.
- S. P. Brown, I. Schnell, J. D. Brand, K. Müllen, and H. W. Spiess, “An Investigation of π-π Packing in a Columnar Hexabenzocoronene by Fast Magic-Angle Spinning and Double-Quantum 1H Solid-State NMR Spectroscopy,” Journal of the American Chemical Society 121, no. 28 (1999): 6712–18. doi:10.1021/ja990637m.
- D. A. Ballard, M. L. Chacón-Patiño, P. Qiao, K. J. Roberts, R. Rae, P. J. Dowding, Z. Xu, and D. Harbottle, “Molecular Characterization of Strongly and Weakly Interfacially Active Asphaltenes by High-Resolution Mass Spectrometry,” Energy & Fuels 34, no. 11 (2020): 13966–76. doi:10.1021/acs.energyfuels.0c02752.
- D. A. Ballard, P. Qiao, B. Cattoz, P. J. Dowding, S. Prevost, M. Alshamsi, T. Charpentier, K. J. Roberts, Z. Xu, and D. Harbottle, “Aggregation Behavior of E-SARA Asphaltene Fractions Studied by Small-Angle Neutron Scattering,” Energy & Fuels 34, no. 6 (2020): 6894–903. doi:10.1021/acs.energyfuels.0c00596.