
 ?Mathematical formulae have been encoded as MathML and are displayed in this HTML version using MathJax in order to improve their display. Uncheck the box to turn MathJax off. This feature requires Javascript. Click on a formula to zoom.
Abstract
This case study investigated the visual-motor coordination of an expert and a novice driver during high-speed cornering on an ice-racing track. The frozen track imposes unique task constraints on drivers due to the loss of traction. We Examined the coordination structure employed by the drivers to stabilize task goals in such an uncertain environment. The eye tracker system collected data on eye movements, head rotation, and steering wheel rotation. Coherent patterns of eye-head-steering were evaluated through Mutual Information with a time delay. The results showed that both drivers were forced to deal with unstable, shaky steering under the task constraints of losing traction. The novice driver employed a control strategy that suppressed both head and steering wheel movements. The expert driver exhibited rhythmic head rotation, which may have a functional role in dealing with disturbances by generating stable movement patterns. This study highlights human flexibility and adaptability in response to challenging and uncertain environments. The perception-action system of the expert driver actively generated movements, forming a functional and complementary coordination.
Introduction
Drivers’ gaze strategies during cornering
One approach to research on car driving is to examine the driver’s gaze behavior to identify control strategies. On straight roads, drivers tend to fixate their gaze on the focal point of the expansion of the optic flow field generated by the car’s motion (Cohen, Citation1978). On the other hand, during cornering, drivers employ a visual steering strategy that utilizes the tangent point (TP) (Land & Lee, Citation1994). The angle of the TP relative to the car’s traveling direction provides predictive information about the curvature of the corner and can be used for steering control.
However, the strategy of fixating the gaze on the TP is only consistently used in the limited case where the car’s trajectory follows the shape of the curve exactly (Authié & Mestre, Citation2011; Chattington et al., Citation2007; Kandil et al., Citation2009; Land & Lee, Citation1994; Lappi et al., Citation2013; Lappi & Lehtonen, Citation2013; Mars, Citation2008). In contrast, when driving on non-circuit regular roads, drivers continuously engage in visual search through active head rotation and eye movements (Land & Tatler, Citation2001; Lappi et al., Citation2017; van Leeuwen et al., Citation2017). An experienced driver on a winding country road never “stares” at any specific location or object for a particular time but instead continuously rotates their head and scans the visual field using a rapid saccade-fixate-saccade pattern (Lappi et al., Citation2017). Consequently, focusing solely on the gaze strategy of fixating on the TP proves inadequate for a comprehensive analysis of driving behaviors; it is imperative to investigate the interplay between eye movements, head rotation, and steering as suggested by previous studies (Land & Tatler, Citation2001; van Leeuwen et al., Citation2017; Wilson et al., Citation2007).
Visual-steering coordination during cornering
Recent approaches have demonstrated that the vision of racing drivers during high-speed practice is not controlled in isolation, but as part of an “embodied” car-driver system that incorporates eye movements, head rotation, and steering (Land & Tatler, Citation2001; van Leeuwen et al., Citation2017; Varela et al., Citation1991). A racing driver’s head rotation (in yaw) relative to the car’s axis was strongly coupled with the car’s rotation relative to the curve approximately 1 s later, while the relative angle between the gaze and head direction remained constant (Land & Tatler, Citation2001). In other words, the driver shifts their head while maintaining a constant relative angle between the head and the eyes, and the car rotates approximately 1 s after the head rotation. van Leeuwen et al. (Citation2017) replicated the study by Land and Tatler (Citation2001) using both novice and expert drivers. While novice drivers’ gaze behavior corresponded well to the TP strategy, expert drivers demonstrated a coupling between head rotation and steering, with a 1 s time delay, consistent with the findings of Land and Tatler (Citation2001). Furthermore, the frequency of expert drivers’ head rotation was twice that of novice drivers, with greater variability.
Flexible control: stabilizing performance by generating compensatory variability
Expert drivers exhibit greater variability in their movement system, despite better performance than novices. This suggests that they compensate for these variabilities by forming mutual coordination among variables in their car-driver system (Bernstein, Citation1967, Citation1996; Bootsma & van Wieringen, Citation1990; Kudo & Ohtsuki, Citation2008). Compensatory variability is the stabilization of performance in a motor system, whereby variation in one execution parameter compensates for variation in others (Bootsma & van Wieringen, Citation1990). The variability in human movements arises from the mechanical complexity of the human motor system and its redundant degrees of freedom, with over 100 mechanical degrees of freedom just at the skeletal joints. It is challenging to decide how to utilize these redundant degrees of freedom during a task. Movement variability has been discussed in relation to errors in motor performance (Schmidt et al., Citation1979), but Bernstein argued that the problem of redundant degrees of freedom could be solved by introducing compensatory variability among the components of a motor system (Bernstein, Citation1967, Citation1996; Kudo & Ohtsuki, Citation2008).
For example, in ball-throwing aimed at a stationary target, release parameters (i.e. the release point, the magnitude, and the direction of the release velocity vector) are coordinated in a complementary manner, reducing the variability of performance in tasks where accuracy is the goal (Kudo et al., Citation2000). Such compensatory coordination allows the system to consistently achieve performance outcomes. Therefore, variability in the motor system should not be immediately considered as noise or a random process but as emerging from an active and functional compensatory process. Several studies have suggested that variable movement, complementarily coordinated, can produce consistent outcomes (Arutyunyan et al., Citation1970; Bootsma & van Wieringen, Citation1990; Bril et al., Citation2010; Darling & Cooke, Citation1987; Kudo et al., Citation2000; Latash, Citation2008; Müller & Sternad, Citation2003; Nonaka, Citation2013; Vereijken et al., Citation1992). Thus, expert drivers may adapt to task constraints by forming mutually compensatory coordination within the car-driver system, consisting of eye, head, and steering movements (Kudo et al., Citation2000; Scholz & Schöner, Citation1999).
Current study
This case study aimed to describe the strategies that an expert driver uses to adapt to disruptive and uncertain environments by coordinating the degrees of freedom within the car-driver system. To this end, we examined how drivers utilize the degrees of freedom in the car-driver system to cope with the loss of traction on a corner of the ice-racing track.
Task constraints specific to ice-racing tracks
Paved and ice-racing tracks impose different task constraints on drivers. On the paved track, drivers may maintain a constant yaw angle of the car against the corner because the track provides sufficient traction. In contrast, during high-speed practice on an ice-racing track, drivers inevitably encounter disturbances on the road surface, resulting in slipping, skidding, and spinning on the ice. Consequently, the steering wheel and the car’s yaw rotation become uncoupled due to slipping. Thus, drivers might employ a different visual-motor control strategy on frozen tracks compared to those on paved tracks.
On an ice-racing track, the yaw angle against the curve fluctuates, forcing the driver to continually adjust the steering wheel to compensate for yaw angle fluctuations. Simultaneously adjusting visual search and steering constitutes a dual task, which can potentially cause interference. However, with sufficiently advanced driving skills, drivers may be able to handle uncertain cornering situations by establishing a coordinated pattern between visual search and steering rather than controlling these individually. Therefore, we can examine the eye-head-steering coordination of an expert driver in terms of a coordinative structure organized to stabilize the task goal (Kudo et al., Citation2000; Scholz & Schöner, Citation1999).
Objective and hypothesis of the current study
Given this background, we tested two drivers, an expert and a novice, on an ice-racing track during high-speed practice. Using an eye tracker, we collected data on eye movements, head rotation, and steering wheel rotation during the experiment. The results were analyzed with a focus on how drivers coordinated redundant variables (eye-head-steering) to stabilize the task goal (Kudo et al., Citation2000; Kudo & Ohtsuki, Citation2008; Scholz & Schöner, Citation1999). Our hypotheses are as follows:
On an ice-racing track, drivers’ steering exhibits large and unstable periodicity due to the loss of traction.
The novice driver employs a control strategy to adapt to the task constraints on the ice track by fixating and suppressing variability in steering, head rotation, and eye movements. The novice driver’s steering is not coordinated with the other two variables.
The expert driver employs a control strategy to adapt to the task constraints on the ice track by coordinating steering, head rotation, and eye movements with each other. Particularly, unstable steering forms coordination with the other two variables.
Mutual information (MI)
In the analysis, we calculated the MI for eye movements in the horizontal plane, head rotation in the horizontal plane, and steering angular velocity. We used MI as the measure of eye-head-steering coordination for the following reasons: Traditional quantitative patterns of drivers’ behaviors have mainly been represented by static measures, such as horizontal dispersion and dwell times in areas of interest aggregated over a trial (Foulsham et al., Citation2011; Underwood et al., Citation2002). However, these static statistical measures do not reveal how drivers’ visual and motor behaviors are coordinated based on control strategies during active driving behavior. Therefore, the present study employs MI to evaluate drivers’ visual-motor coordination during curve driving. MI is more robust to noise compared to cross-correlation functions previously used in time-series analysis of steering and eye movements (Afshani et al., Citation2019; Bonita et al., Citation2014). Intuitively, MI measures the information that two random variables share; it quantifies how much knowing one variable reduces uncertainty about the other. In other words, the higher the MI, the stronger the anticipatory relationship between the two variables. It is expressed by the following equation: where x and y are random variables, and P represents the probability density.
In practice, MI can serve as a robust index of correlation: the greater the MI, the stronger the correlation between the variables. MI’s significant advantage is that it accounts for both linear and non-linear dependencies (Lungarella & Pfeifer, Citation2001). For example, the degree of co-activation of a muscle pair that stabilizes the performance of a tracking task can be quantitatively assessed through MI (Svendsen et al., Citation2011). Furthermore, by continuously calculating MI for pairs of time-series data while varying the time delay, we can evaluate the interdependence between variables, considering the time delay.
We measured MI using two methods. The first is Auto Mutual Information (Auto MI), which calculates the MI between a time series and a delayed version of itself. We used Auto MI to characterize the three variables (eye movement, head rotation, and steering wheel angular velocity). Auto MI indicates the degree to which a data point at a given time correlates with other data points at various times. For example, when calculating Auto MI of a sine wave using a time delay, the MI value peaks when the delay corresponds to an integer multiple of the sine wave’s period, as the sine waves overlap entirely. Additionally, when white noise is added to the sine wave, the nearest data points have only a random relationship with each other, and the MI value approaches zero near a delay of 0 s. However, if the variables exhibit periodicity, peaks should be observed at delays other than 0 s. If eye movement, head rotation, and steering wheel rotation showed white noise-like fluctuations, MI values would be minimal, except at a delay of 0 s, indicating that Auto MI would lack periodicity.
The second method calculates Cross Mutual Information (Cross MI) from two different time series. For Cross MI, we quantified the relationship between each pair of variables in eye movement, head rotation, and steering wheel rotation. If there were no correlations, the MI values would be minimal, except at a delay of 0 s. Conversely, peaks should be observed at delays other than 0 s. When calculating both Auto MI and Cross MI, we created surrogate data pairs by randomly resampling each time series and used them to calculate Cross MI in the same way as for the real data. We statistically compared the average MI values between the real and surrogate data.
In the discussion, we will focus primarily on the visual-motor coordination exhibited by the expert driver in the second corner of the ice-racing course. The participants in this study were two drivers, an expert and a novice, who were expected to have significant differences in driving skills and basic control strategies. Therefore, our analysis aims to delineate the differences in their basic control strategies. We will then analyze the visual-motor coordination of both drivers during the second corner, focusing on the differences between participants.
Materials and methods
Participants
A 45-year-old expert driver (referred to as A), who had participated in dirt trial championships for 25 years, enrolled in our study. He won the Japanese Dirt Trial Championship for the fourth consecutive year. The Dirt Trial is similar to rally or rallycross but has two differences: (a) each car runs a time trial, and (b) each car runs on an unpaved dirt circuit of various shapes. He also had several experiences running on the ice-racing track where the experiment was conducted. On the other hand, participant B had experience participating in the Student Formula, a student engineering competition. Due to his limited experience with the ice-racing track, we considered him a novice. All participants provided written informed consent before starting the experiment, and the study was approved by the Ethics Committee of the University of Tokyo.
Experimental task
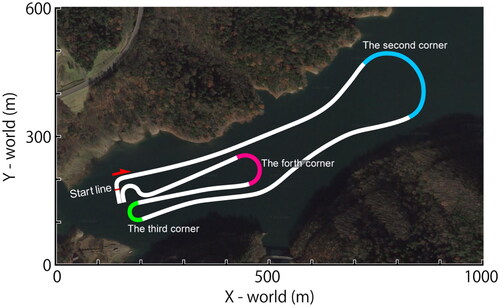
We conducted the experiment on an ice-racing track, which has a length of 2.35 km, at Lake Nukabira in Hokkaido, Japan. shows an overview of the track layout, including the second, third, and fourth corners. Each participant completed three laps of the track. The detailed analysis focused on the second corner, which is 262 m in length.
Figure 1. Overview of the track layout (in meters). The start line and driving direction are indicated by a red line and an arrow. The second, third, and fourth corners are shown with blue, green, and magenta lines, respectively.
We collected the participants’ visual field and eye movement data in the horizontal plane using a Mobile EyeMark Recorder System (NAC Image Technology Inc., Japan), which consists of a visual field camera (29.97 Hz) and an eye-tracking camera (60 Hz). We calculated the head rotation in the horizontal plane and the steering angular velocity by collecting the displacement of feature points from the visual field camera. Horizontal head rotation was detected using two feature points at the bottom of the windshield, as shown in . The steering angular velocity was calculated using four feature points on the outer edge of the steering wheel, also shown in . Three of the four feature points on the steering wheel were used to calculate the pivot position and diameter of the wheel, while the remaining point was used to detect the angular displacement of the wheel. The feature points were marked with tape lines and motion markers on the steering wheel. displays the time-series data for horizontal eye movements, horizontal head rotations, and the steering angular velocity, calculated using the above-mentioned procedure.
Figure 2. The image from the visual field camera attached to the head (A), fixation patterns of the expert (B), and novice (C) drivers on the second corner.
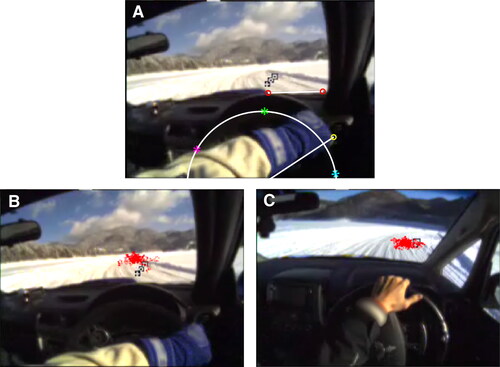
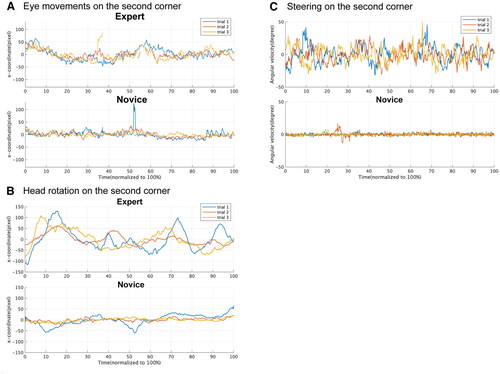
Figure 3. Time-series data of (A) horizontal eye movement, (B) horizontal head rotation, and (C) steering angular velocity at the second corner. The durations of the three trials were normalized to 100%.
Missing data at the second corner averaged < 5% for both the expert and novice drivers (Expert driver: steering = 3%, head rotation = 0%, eye movements = 3%; Novice driver: steering = 0%, head rotation = 0%, eye movements = 2%). When calculating basic statistics, the raw time-series data were used to avoid outliers in velocity. For the calculation of MI, Brownian bridge interpolation was applied to fill in missing data, using data points randomly sampled from the time series.
Results
Basic statistics
To examine the differences in driving skills between the two drivers, we performed unpaired t-tests comparing the lap times for three laps and the durations for the second, third, and fourth corners over three laps between the drivers (). The expert driver’s lap times and corner durations were significantly shorter than those of the novice. These results indicate that the expert’s driving skill is superior to that of the novice.
Table 1. Unpaired t-test for lap times and for the duration of three corners between drivers.
We performed F-tests on eye movement, head rotation, and steering angular velocity during the second corner to examine whether the variances in the expert driver’s movements for each variable were greater than those of the novice driver. The results showed that for all variables, the expert driver’s motions had significantly greater variance than those of the novice driver (). We also performed t-tests for the absolute velocities of eye movements, head rotation, and steering during the second corner. The results showed that for all variables, the expert driver was moving at a greater velocity than the novice driver ().
Table 2. F-test for eye movements, head rotation, and steering velocity between drivers.
Table 3. Two-sample t-test for the absolute velocity of eye movements, head rotation, and steering between drivers.
Time-series analysis using MI
We calculated MI values for eye movement, head rotation, and steering angular velocity during the second corner for both the expert and novice drivers. MI was continuously calculated while changing the time delay value for pairs of time-series data. We used two methods for measuring MI. The first method is Auto MI, which we used to evaluate the periodicity contained in each variable ( and ). The second method is Cross MI, which uses a pair of two different variables; we employed this method to evaluate the interdependence of variable pairs. Cross MI was calculated for three pairs of variables: eye movement × head rotation, head rotation × steering angular velocity, and eye movement × steering angular velocity ( and ). When calculating MI, we created surrogate data pairs by randomly resampling each time-series dataset, which were then used to calculate Cross MI in the same manner as the real data ( and ).
Figure 4. Mean Auto MI measured with respect to delay time. The x-axis displays delay time, and the y-axis displays MI values. The blue and red lines indicate the expert and novice drivers, respectively.
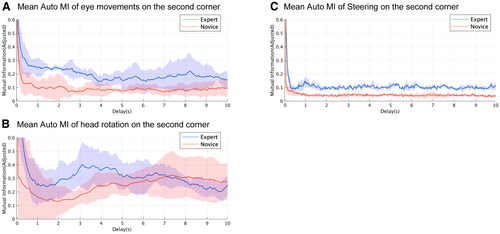
Figure 5. Mean Cross MI measured with respect to delay time. The x-axis displays delay time, and the y-axis displays MI values. The blue and red lines indicate the expert and novice drivers, respectively.
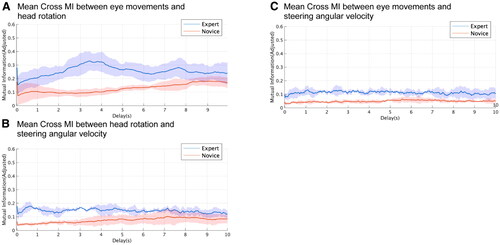
Table 4. Mean Auto MI of eye movement, head rotation, and the angular velocity of steering.
Table 5. Mean Cross MI of eye movement, head rotation, and the angular velocity of steering.
Auto MI
To examine the statistical significance of Auto MI, we performed paired t-tests on the average MI values within a range of 2 s delay time between the surrogate and real data (). All three variables exhibited statistically significant periodicity for the expert driver, while only the steering velocity was statistically significant for the novice driver.
We illustrate the periodicity of each variable for the expert driver, as shown in the plots of Auto MI ). The head rotation reached the first local maximum at a delay of approximately 3 s (), indicating that the expert driver’s head continued to rotate with a periodicity of approximately 3 s. The steering angular velocity also showed that the expert driver was steering with a periodicity of approximately 1 s (). As for the novice driver, the steering movements did not show a clear periodicity, although they were statistically significant ().
Cross MI
To examine the statistical significance of Cross MI, we performed paired t-tests using the above-mentioned procedure (). Both the expert and novice drivers exhibited statistically significant levels of periodicity for each pair of variables.
The Cross MI of the expert driver reflected the periodicity shown in the Auto MI (). The Cross MI between eye movements and head rotation showed a periodicity of approximately 3 s, indicating that eye movements were synchronized with head rotation ( and ). The Cross MI between steering and the other two variables reached the first local maximum at a delay of approximately 0.5 − 1 s, suggesting that these variables were synchronized with the steering (, and 5 C). As for the novice driver, Cross MI did not show a distinct periodicity compared to that of the expert driver ().
Discussion
This study examined the eye-head-steering coordination of an expert and a novice driver with the goal of identifying coordination structures organized to stabilize the task goal. First, we discuss the task constraints specific to the ice-racing track. We reveal that the ice track imposed particular driving behaviors on the two drivers, as evidenced by the results common between them. Secondly, we discuss how each participant adapted to the task constraints specific to the ice-racing track by employing different control strategies. Third, we discuss how the coordination structure of the expert driver was involved with compensatory variability in dealing with disturbances.
Task constraints specific to the ice-racing track
Previous studies on drivers’ visual-motor coordination during cornering have mainly been conducted on paved courses. On such courses, drivers tend to fixate their gaze near the TP, while maintaining a constant relative angle between the eyes and the head (Land & Tatler, Citation2001; van Leeuwen et al., Citation2017). The drivers also used a control strategy that coordinated the steering rotation approximately 0.8 s after turning their heads. When comparing expert and novice drivers, novice drivers tended to fixate on the TP for longer periods, while expert drivers showed more diverse fixation near the TP (van Leeuwen et al., Citation2017). Reflecting this diversity in fixation, expert drivers demonstrated more extensive head rotation and aggressive steering.
In comparing the driving behavior on paved courses (Land & Tatler, Citation2001; van Leeuwen et al., Citation2017) with that on the ice track, the most notable difference was the shaky, unstable steering. On paved courses, it has been suggested that drivers’ head rotation, steering wheel rotation, and yaw angle rotation of the car relative to the curve were in a relatively stable coupling (Land & Tatler, Citation2001; van Leeuwen et al., Citation2017). In our study, the results of Auto MI indicated that the steering of both drivers shared a common feature: containing large amounts of noisy, non-periodic patterns (), although the steering variance and velocity of the two drivers differed. Therefore, the unique constraints of ice tracks include the loss of traction, causing steering instability and a loss of correspondence between steering and vehicle yaw angle. This is consistent with our hypothesis (1).
Control strategies of the two drivers
We discuss the differences in the control strategies of the two drivers. The lap times and durations for the corners of the expert driver were significantly shorter than those of the novice driver (), and the expert driver’s movement variables showed significantly greater variance and velocity ( and ). Thus, it can be assumed that both drivers employed different control strategies based on their expertise and running speeds.
The novice driver’s head and steering rotations showed significantly smaller variances than those of the expert driver (), and the time-series data exhibited a narrower range than the expert’s, suggesting that the novice driver employed a control strategy that suppressed the steering angle and head rotation during cornering (). This is consistent with our hypothesis (2) and a previous study (van Leeuwen et al., Citation2017).
The expert driver’s head rotation and steering movements were significantly faster and showed significantly greater fluctuations than those of the novice driver ( and ). A notable feature of the expert’s driving behavior was the periodicity of the head rotation. The expert driver’s head maintained horizontal shifts in approximately 3 s cycles ( and ). This rigid periodic rotation was not observed in previous studies conducted on paved circuits (Land & Tatler, Citation2001; van Leeuwen et al., Citation2017). The eye movements synchronized with this periodic head rotation (). Additionally, although not as distinct as head rotation, steering rotation was also synchronized with the other two variables with a time delay of 1 s (). In summary, the movement variables of the expert driver were in a coupled relationship with each other and exhibited periodicity, with the most distinct periodicity being in the head rotation. The driver dealt with uncertain cornering situations by establishing a coordinated pattern between visual search and steering, rather than controlling these individually, which is consistent with our hypothesis (3).
Compensatory coordination of the perception-action system
The auto MI used in this study serves as a measure for assessing the predictability of future states within a given time series. Analyses of eye movements, head rotations, and steering time series collectively indicated that the expert driver exhibited higher auto MI values compared to the novice driver across a range of several seconds. This finding suggests that the movement patterns observed in the expert driver are more predictable than those observed in the novice driver.
In addition, in the context of cross MI, the expert driver demonstrated higher values relative to novice drivers in all the paires of the variables examined. Higher cross MI values signify higher ability to predict the values of other variables accurately when one variable’s value is known. Acquiring predictive information into one’s own movement patterns is instrumental for human motor control, particularly in managing a large amount of redundant and variable degrees of freedom inherent in musculoskeletal system (Bernstein, Citation1967), thereby contributing to superior motor task performance. From this perspective, it is plausible to posit that the expert drivers’ eye movements, head rotations, and steering actions may collectively constitute a predictive coordinative structure underpinned by compensatory variability.
Conclusion
This case study investigated the eye-head-steering coordination of drivers on an ice-racing track. This study aimed to reveal the control strategies of both an expert driver and a novice driver in uncertain and complex environments. Cornering on the ice track imposed unique task constraints on the drivers, resulting in unstable steering control and a loss of correspondence between steering and the car’s yaw angle. The novice driver employed a control strategy that suppressed both head and steering movements. Conversely, the expert driver employed a control strategy to form a periodic co-occurrence relationship between eye, head, and steering movements, which may have a functional role in dealing with disturbances by generating stable movement patterns. The perception-action system of the expert driver actively generated movements, forming a functional and complementary coordination.
Study limitations and future scope
Because variables that directly reflect task performance were not examined in the current study, we could not determine whether fluctuation components in the car-driver system contributed to the stabilization of task performance. By further exploring the relationship between global variables, such as the car’s translational and rotational motion (i.e. the yaw angle of the car against the corner), and the variables related to the driver’s perception and action, we could clarify whether complementary coordination helps stabilize task performance.
This case study examined valuable eye-tracking data on an ice-racing track with only two participants. To more comprehensively understand the control strategies for dealing with the loss of traction, further testing with more participants is required. Comparing good traction and frozen situations would be possible using a track of the same curvature. Additionally, using a driving simulator, as in the previous study (van Leeuwen et al., Citation2017), would allow for a systematic comparison of driving behaviors on ice tracks with paved circuits.
The study did not directly examine whether the expert driver was fixating their gaze on the TP on the corner. On the ice track, the angle of the car relative to the curve fluctuates constantly. Therefore, it is possible that the expert was tracking the TP by shifting their head from side to side in response to the changing angles of the car relative to the curve. The driving simulator would also allow us to directly verify whether fluctuation components of the car-driver system contribute to stabilizing the gaze on the TP.
The relationship between visual search, steering, and sensory information perceived through the seat will be an issue to be investigated in the future. Although this study focused on the relationship between eye movements and steering, posture as a basic orientation system (Gibson, Citation1966) depends on information about the support surface (Nomura et al., Citation2009; Stoffregen & Riccio, Citation1988). The sensory information used by the driver also includes a sense of balance and the somatosensory information perceived from the seat.
Authors’ contributions
KK and MS: conceived the study, designed the data collection procedures, and collected the data. NH analyzed the data and wrote the first draft. NH, MS, and KK revised the manuscript.
Acknowledgments
We are most grateful to the two drivers for participating in this study. We also thank Mr. Ryo Torigoe for his assistance in conducting the experiment and Dr. Koji Kadota for his valuable discussion.
Disclosure statement
The authors declare that the research was conducted in the absence of any commercial or financial relationships that could be construed as a potential conflict of interest.
Additional information
Funding
References
- Afshani, F., Shalbaf, A., Shalbaf, R., & Sleigh, J. (2019). Frontal-temporal functional connectivity of EEG signal by standardized permutation mutual information during anesthesia. Cognitive Neurodynamics, 13(6), 531–540. https://doi.org/10.1007/s11571-019-09553-w
- Arutyunyan, G. A., Gurfinkel, V. S., & Mirskii, M. L. (1970). Organization of movements on execution by man of an exact postural task. Biophysics, 14(6), 1162–1167.
- Authié, C. N., & Mestre, D. R. (2011). Optokinetic nystagmus is elicited by curvilinear optic flow during high speed curve driving. Vision Research, 51(16), 1791–1800. https://doi.org/10.1016/j.visres.2011.06.010
- Bernstein, N. A. (1967). The Co-Ordination and Regulation of Movements. Pergamon Press.
- Bernstein, N. A. (1996). On Dexterity and its development. In M. L. Latash and M. T. Turvey (Eds.), Dexterity and its Development (pp. 1–244). Lawrence Erlbaum Associates.
- Bonita, J. D., Ambolode, L. C., 2nd, Rosenberg, B. M., Cellucci, C. J., Watanabe, T. A., Rapp, P. E., & Albano, A. M. (2014). Time domain measures of inter-channel EEG correlations: A comparison of linear, nonparametric and nonlinear measures. Cognitive Neurodynamics, 8(1), 1–15. https://doi.org/10.1007/s11571-013-9267-8
- Bootsma, R. J., & van Wieringen, P. C. W. (1990). Timing an attacking forehand drive in table tennis. Journal of Experimental Psychology: Human Perception and Performance, 16(1), 21–29. https://doi.org/10.1037/0096-1523.16.1.21
- Bril, B., Rein, R., Nonaka, T., Wenban-Smith, F., & Dietrich, G. (2010). The role of expertise in tool use: Skill differences in functional action adaptations to task constraints. Journal of Experimental Psychology. Human Perception and Performance, 36(4), 825–839. https://doi.org/10.1037/a0018171
- Chattington, M., Wilson, M., Ashford, D., & Marple-Horvat, D. E. (2007). Eye-steering coordination in natural driving. Experimental Brain Research, 180(1), 1–14. https://doi.org/10.1007/s00221-006-0839-2
- Cohen, A. S. (1978). Eye movement behavior while driving a car: A review. Swiss Federal Institute of Technology, Department of Behavioral Science.
- Darling, W. G., & Cooke, W. G. (1987). Movement related EMGs become more variable during learning of fast accurate movements. Journal of Motor Behavior, 19(3), 311–331. https://doi.org/10.1080/00222895.1987.10735415
- Foulsham, T., Walker, E., & Kingstone, A. (2011). The where, what and when of gaze allocation in the lab and the natural environment. Vision Research, 51(17), 1920–1931. https://doi.org/10.1016/j.visres.2011.07.002
- Gibson, J. J. (1966). The senses considered as perceptual systems. Bloomsbury Academic.
- Kandil, F. I., Rotter, A., & Lappe, M. (2009). Driving is smoother and more stable when using the tangent point. Journal of Vision, 9(1), 11.1–11. https://doi.org/10.1167/9.1.11
- Kudo, K., & Ohtsuki, T. (2008). Adaptive variability in skilled human movements. Transactions of the Japanese Society for Artificial Intelligence, 23(3), 151–162. https://doi.org/10.1527/tjsai.23.151
- Kudo, K., Tsutsui, S., Ishikura, T., Ito, T., & Yamamoto, Y. (2000). Compensatory coordination of release parameters in a throwing task. Journal of Motor Behavior, 32(4), 337–345. https://doi.org/10.1080/00222890009601384
- Land, M. F., & Lee, D. N. (1994). Where do we look when we steer. Nature, 369(6483), 742–744. https://doi.org/10.1038/369742a0
- Land, M. F., & Tatler, B. W. (2001). Steering with the head: The visual strategy of a racing driver. Current Biology, 11(15), 1215–1220. https://doi.org/10.1016/S0960-9822(01)00351-7
- Lappi, O., & Lehtonen, E. (2013). Eye-movements in real curve driving: Pursuit-like optokinesis in vehicle frame of reference, stability in an allocentric reference coordinate system. Journal of Eye Movement Research, 6(1), 1–13. https://doi.org/10.16910/jemr.6.1.4
- Lappi, O., Lehtonen, E., Pekkanen, J., & Itkonen, T. (2013). Beyond the tangent point: Gaze targets in naturalistic driving. Journal of Vision, 13(13), 11–11. https://doi.org/10.1167/13.13.11
- Lappi, O., Rinkkala, P., & Pekkanen, J. (2017). Systematic observation of an expert driver’s gaze strategy—An on-road case study. Frontiers in Psychology, 8, 620. https://doi.org/10.3389/fpsyg.2017.00620
- Latash, M. L. (2008). Synergy. Oxford University Press.
- Lungarella, M., Pfeifer, R. (2001). Robots as cognitive tools: Information theoretic analysis of sensory-motor data. Proceedings of the 2001 IEEE-RAS International Conference on Humanoid Robotics, Tokyo, Japan, 245—252.
- Mars, F. (2008). Driving around bends with manipulated eye-steering coordination. Journal of Vision, 8(11), 10.1–11. https://doi.org/10.1167/8.11.10
- Müller, H., & Sternad, D. (2003). A randomization method for the calculation of covariation in multiple nonlinear relations: Illustrated with the example of goal-directed movements. Biological Cybernetics, 89(1), 22–33. https://doi.org/10.1007/s00422-003-0399-5
- Nomura, H., Muraguchi, K., Chiba, K., Inou, H., Fujita, M., Sawada, M., & Mishima, H. (2009). Posture supported by a well-adjusted seating system creates virtuous perception-action cycles [Paper presentation]. Oral Presentation at 15th International Conference on Perception and Action, University of Minnesota, USA, (July 14).
- Nonaka, T. (2013). Motor variability but functional specificity: The case of a C4 tetraplegic mouth calligrapher. Ecological Psychology, 25(2), 131–154. https://doi.org/10.1080/10407413.2013.780492
- Schmidt, R. A., Zelaznik, H., Hawkins, B., Frank, J. S., & Quinn, J. T. Jr. (1979). Motor-output variability: A theory for the accuracy of rapid motor acts. Psychological Review, 86(5), 415–451. https://doi.org/10.1037/0033-295X.86.5.415
- Scholz, J. P., & Schöner, G. (1999). The uncontrolled manifold concept: Identifying control variables for a functional task. Experimental Brain Research, 126(3), 289–306. https://doi.org/10.1007/s002210050738
- Stoffregen, T. A., & Riccio, G. E. (1988). An ecological theory of orientation and the vestibular system. Psychological Review, 95(1), 3–14. https://doi.org/10.1037/0033-295X.95.1.3
- Svendsen, J. H., Samani, A., Mayntzhusen, K., & Madeleine, P. (2011). Muscle coordination and force variability during static and dynamic tracking tasks. Human Movement Science, 30(6), 1039–1051. https://doi.org/10.1016/j.humov.2011.02.001
- Underwood, G., Chapman, P., Bowden, K., & Crundall, D. (2002). Visual search while driving: Skill and awareness during inspection of the scene. Transportation Research Part F: Traffic Psychology and Behaviour, 5(2), 87–97. https://doi.org/10.1016/S1369-8478(02)00008-6
- Varela, F. J., Thompson, E., & Rosch, E. (1991). The embodied mind: Cognitive science and human experience. The MIT Press.
- van Leeuwen, P. M., de Groot, S., Happee, R., & de Winter, J. C. F. (2017). Differences between racing and non-racing drivers: A simulator study using eye-tracking. PLOS One, 12(11), e0186871. https://doi.org/10.1371/journal.pone.0186871
- Vereijken, B., Whiting, H. T. A., & Beek, W. J. (1992). A dynamical systems approach to skill Acquisition. The Quarterly Journal of Experimental Psychology. A, Human Experimental Psychology, 45(2), 323–344. https://doi.org/10.1080/14640749208401329
- Wilson, M., Stephenson, S., Chattington, M., & Marple-Horvat, D. E. (2007). Eye movements coordinated with steering benefit performance even when vision is denied. Experimental Brain Research, 176(3), 397–412. https://doi.org/10.1007/s00221-006-0623-3