
 ?Mathematical formulae have been encoded as MathML and are displayed in this HTML version using MathJax in order to improve their display. Uncheck the box to turn MathJax off. This feature requires Javascript. Click on a formula to zoom.
Abstract
This study numerically investigates film-cooling performance and particle trajectories in AGTB (two rows of cylindrical holes equipped on suction side (SS) and pressure side (PS) of the leading edge, respectively) turbine cascade. Particle deposition on a turbine blade is analyzed by calculations of capture efficiency and impact efficiency. The turbulent flow is modeled by the Realizable k-ε turbulence model, and the discrete phase model (DPM) with user-defined functions (UDFs) is used to simulate the particle motions. An invasion efficiency is proposed to analyze the possibility of particle invasion into the film hole. Comparisons of various particles with diameters of 1 µm, 5 µm, 10 µm, 20 µm, and 50 µm, respectively, are conducted for four blowing ratios (0.53, 0.93, 1.31, 1.63) and three inlet flow angles (123°, 133°, and 143°). It is observed that with a small inlet flow angle and a large blowing ratio, the capture efficiency on the PS decreases. It is found that smaller particle size results in lower invasion efficiency, and larger particles are more likely to invade into the film-cooling hole especially at a low blowing ratio.
1. Introduction
The inlet temperature of gas turbines was significantly increased over the past 50 years. Film-cooling technology is widely used for gas turbine engines to ensure their operation under safe and efficient conditions. Film-cooling effectiveness is affected by many factors, such as injection angle, blowing ratio, film hole configuration, etc. Based on the k-ε turbulence model, Azzi et al. [Citation1] investigated the effect of compound angle injection on film-cooling effectiveness. Compared with experimental results, they found that the film hole with a compound angle provided better film-cooling performance. Singh et al. [Citation2] analyzed the effect of injection angles on film heating and cooling. They indicated that increasing the injection angle enlarged the recirculation zone, which accelerated the mixing of the secondary flow with the mainstream. Wang et al. [Citation3] studied the nonuniform distribution of film-cooling effectiveness for a conjugate heat transfer passage, and they found that the compound angle of 45° improved the lateral film-cooling effectiveness and provided a uniform cooling protection. An et al. [Citation4] found that a hole outlet with a middle bulge structure increased the lateral film-cooling effectiveness. Mazaheri et al. [Citation5] designed an antivortex hole configuration to investigate film-cooling performance under high blowing ratio. They proved that this novel configuration weakened the jet liftoff at a high blowing ratio and improved the average film-cooling performance.
Based on AGTB turbine cascade (as shown in [Citation6]), some studies investigated the effect of particle deposition on the film-cooling effectiveness. Ardey and Fottner [Citation6] experimentally studied flow fields of AGTB-B1, AGTB-S (double row slot hole), and AGTB-B2 (double row inclined hole). They found that the AGTB turbine cascade generated a large reversed flow area at the outlet of the pressure side (PS), and more coolant flow from the PS hole is permeating into the mainstream. Islami et al. [Citation7] performed a numerical investigation of leading-edge film cooling using different hole configurations. They found that the trenched hole enhanced the lateral cooling performance. Khajehhasani and Jubran [Citation8] conducted a numerical study to analyze the effect of new sister-shaped single-hole (SSSH) configurations on the film-cooling effectiveness. It was concluded that the proposed SSSH configurations significantly weakened the liftoff force.
The deposition of ash particles on turbine blade surfaces shows serious influence on turbine performance [Citation9] and engine reliability [Citation10]. Wang et al. [Citation11] reviewed the research progress of multiphase flow in turbine engines, and they indicated that the particle deposition on blade surfaces has significant influence on the service life of gas turbines. The deposition of molten particles increases the surface roughness of turbine components, which even blocks the film-cooling holes. Xu et al. [Citation12] found that increased blade roughness results in a higher deposition rate, whereas a smooth blade surface effectively reduces particle deposition. Mensch and Thole [Citation13] adopted molten wax to investigate particle deposition on a film-cooled turbine endwall. Results showed that at the film-cooling hole exits, the deposition rate decreased with increasing blowing ratio. Based on a particle deposition test, Wylie et al. [Citation14] demonstrated that the film-cooling passage was blocked by external ash particles, which reduced flow parameters significantly. Wang et al. [Citation15] numerically studied the effect of different blockage ratios of spherical blockage on film-cooling performance. They showed that high blockage ratio deteriorated the lateral film-cooling effectiveness. Pan et al. [Citation16] numerically investigated the deposition rate at different inlet Reynolds numbers using the discrete particle model (DPM) to track the trajectories of fine particles. They found that increasing the inlet Reynolds number resulted in a region extension of the maximum deposition rate on the rotating blade. Based on numerical simulations, Prenter et al. [Citation17] indicated that both steady and unsteady methods had a similar predicted trend in the deposition distribution of particles.
Two sticking models were developed and widely used to evaluate the particle-wall interaction in turbine engines. One model is the critical viscosity model, which calculates the sticking probability by considering particle viscosity. Sreedharan and Tafti [Citation18] proposed a critical viscosity model to predict sticking probability of sand particles on a wedge-shaped target. The sticking probability calculated by this model showed good agreement with experimental results. Singh and Tafti [Citation19] improved the critical viscosity model by considering the collision losses during the interaction between particles and the blade surface. Results showed that the capture efficiency increased with increasing particle temperature. Casaday et al. [Citation20] investigated many factors influencing the particle deposition rates by using the critical viscosity model. They found that ash particles deposited primarily in the stagnation region near the leading edge. The other method is a critical velocity model as shown in Ref. [Citation21]. In order to judge whether a particle sticks to the surface and is captured by the surface, this model compares the normal impact velocity of each particle with the capture velocity of each particle. Ai and Fletcher [Citation22] indicated that the capture efficiency calculated by the critical velocity model and particle removal mechanism showed good agreement with experimental results. Wang et al. [Citation23] evaluated particle deposition characteristics near the outlet of the fan-shaped hole by using the critical velocity model. They reported that these shaped hole configurations inhibited particle deposition. Wang et al. [Citation24] investigated the effects of deposition height and width on film-cooling characteristics, and they revealed that the deposition near the hole exit weakened the cooling performance. Wang et al. [Citation25] conducted numerical simulations of film cooling with and without a mist injection, and they found that 4.4% mist injection by mass remarkably increased the film-cooling effectiveness from the deposition location to the wall downstream. Wang et al. [Citation26] also analyzed mist film cooling with various boundary conditions, and they indicated that a combined effect of mist injection and deposition decreased the film-cooling effectiveness upstream x/d = 19.
However, the deposition mechanism of the fine particles at the blade leading edge has not been analyzed in detail. In this research, numerical evaluations are performed of the capture efficiency and impact efficiency on the leading edge of the two-dimensional AGTB configuration. Invasion efficiency is proposed to quantitatively evaluate invasion of particles into the film hole. Moreover, effects of particle size, inlet flow angle and blowing ratio are analyzed for various conditions.
2. Details of numerical simulation
2.1. Computational model and boundary conditions
The AGTB-B1 blade is used in a high-pressure turbine cascade, and this blade with a plenum is designed with two rows of film-cooling holes at the leading edge as shown in ). One row is on the PS while the other row is on the suction side (SS). Ardey and Fottner [Citation6] and Wang et al. [Citation24] experimentally investigated the aerodynamic data of this high-pressure turbine cascade, and more details of the AGTB-S blade geometry are illustrated in .
Figure 1. Geometry model and computational domain. (a) AGTB-B1 blade [28] in a cascade [29]. (b) Computational domain with boundary condition.
![Figure 1. Geometry model and computational domain. (a) AGTB-B1 blade [28] in a cascade [29]. (b) Computational domain with boundary condition.](/cms/asset/4cdd0173-4f78-4a61-a3b5-c950a2ad5675/unht_a_1713692_f0001_c.jpg)
Table 1. Cascade geometry and parameters.
The commercial software ANSYS FLUENT (ANSYS, Inc. Southpointe, Canonsburg, PA, USA) version 16.2 is adopted to predict particle trajectories and cooling performance at the leading edge of the AGTB-S configuration. ) presents the computational domain with boundary conditions. The periodic boundary condition is set on the sidewall of the cascade. In addition, the no-slip condition and adiabatic boundary condition are specified on the blade wall and other walls (like plenum walls and film hole walls). Pressure inlet and outlet conditions for the computational domain are specified according to experimental values in Ref. [Citation27]. In order to match other experimental conditions, the mainstream inlet turbulent intensity and turbulent viscosity ratio are given as 5% and 100, respectively. For the coolant inlet, both the turbulent intensity and turbulent viscosity ratio has lower values as 1% and 10, respectively.
shows experimental boundary conditions and particle properties prescribed with various blowing ratios (M) and mainstream inflow angles (β1). In addition, the total temperature at the mainstream inlet is 1,453 K, and the temperature ratio (Tt,c/Tt,1) of the coolant to the mainstream flow is 0.5 for all cases. Five particle sizes are taken into account in this research. At a surface injection with a total flow rate of 5.71 × 10⁻⁶ kg/s, particles (discrete phase) have the same inlet boundary conditions as the mainstream (the continuous phase). The stochastic random-walk model with 10 motion modes is used to track the trajectories of the discrete particles, and the particle discrete simulation model is obtained by using the Runge–Kutta method.
Table 2. Boundary conditions and particle properties.
2.2. Continuous phase simulation
For the continuous phase, the realizable k-ε turbulence model with enhanced wall treatment is employed to solve the compressible steady Navier–Stokes equations. The SIMPLEC algorithm is used to solve the pressure-velocity coupling in the continuous phase, and discretization of all equations is performed using the second-order upwind scheme. A residual of 10−5 is considered for all variables except for the energy equation (the residual of 10−7) to get converged results.
2.3. Discrete phase simulation
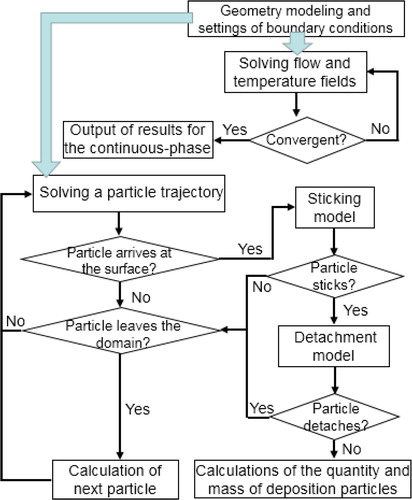
As an Euler–Lagrange approach, the discrete phase model (DPM) is used to track particles. shows the flowchart of the deposition simulation. Velocity field and temperature distribution for the continuous phase are computed for specific boundary conditions. After convergence of the continuous phase is achieved, the dispersed particles are released from the mainstream inlet. When the particles arrive at the blade surface, the user-defined functions (UDFs) developed in C language will provide a description of the particle-wall interaction. Finally, both the quantity and mass of deposition particles will be counted during every simulation.
Figure 2. Flowchart of the deposition computation.
Two forces are considered in the discrete phase to track an individual particle in the turbine passage as follows:
(1)
(1)
where, mp and up represent the mass and velocity of an individual particle, respectively. FD and FS are the drag force and Saffman lift force acting on a particle.
The equation of particle temperature Tp can be established as follows:
(2)
(2)
where Cp, Ap, and h represent particle specific heat, particle surface area, and the convective heat transfer coefficient on the particle surface. When the particles arrive at the blade surface, the particle-wall interaction is investigated based on the EI-Batsh model [Citation21].
For the sticking process, the particle capture velocity is calculated by the critical velocity model to determine whether a particle will stick to the surface or bounce off it. The particle capture velocity Vcr is modeled as:
(3)
(3)
(4)
(4)
(5)
(5)
(6)
(6)
where dp is the particle diameter, and ρp is the particle density. E and υ are the Young’s modulus and the Poisson ratio, respectively. The subscript s and p represent the blade surface and the particle, respectively. The Poisson ratio of both the particle and blade material are set as 0.27, and Ep is given by Ai and Fletcher [Citation22]:
(7)
(7)
where Tg represents the free stream gas temperature above the blade surface. Particulate sticking is analyzed by comparison of the particle normal impact velocity and the particle capture velocity. Particles will deposit on the blade surface if the particle normal impact velocity is smaller than the particle capture velocity.
If the wall friction velocity of the turbulent flow (ufri) is larger than the critical wall shear velocity (utc), the particle will detach from the surface. utc and ufri are defined as follows:
(8)
(8)
(9)
(9)
(10)
(10)
where Cu, WA, and Kc are the Cunningham correction factor, particle sticking constant and composite Young’s modulus, respectively. τω is the wall shear stress.
2.4. Analysis of grid independence
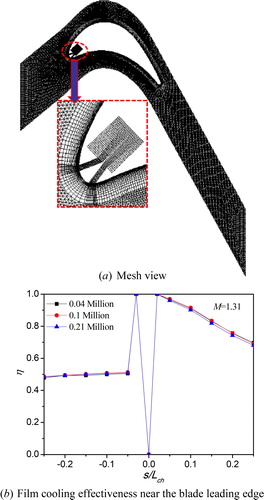
The two-dimensional computational domain is meshed using structured multiblock grids as shown in ). The mesh grids are generated and refined near the blade surface, and cell nodes of the first layer are placed at y+ ≈ 1. As shown in ), the grid sensitivity is investigated by a comparison of the film-cooling effectiveness (η) near the blade leading edge for three numbers of structured grids (0.04 million, 0.1 million, and 0.21 million cells). Simulated results from there three cases are almost overlapping, and the case with 0.1 million cells shows less difference of the film-cooling effectiveness on the SS compared to the one with 0.21 million cells. Finally, about 0.1 million cells are used for all the simulations.
Figure 3. Grid independence study. (a) Mesh view, (b) Film-cooling effectiveness near the blade-leading edge.
2.5. Validation of turbulence model
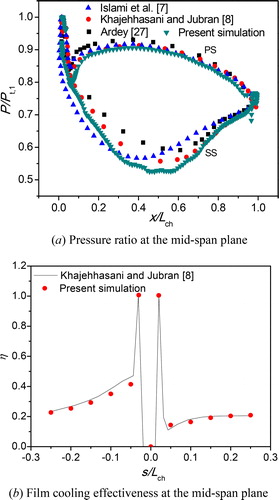
The realizable k-ε turbulence model with the enhanced wall treatment is applied in this study. In order to validate the accuracy of the model simulation, shows distributions of pressure ratio (P/Pt,1) along the blade surface mid span planes and film-cooling effectiveness at the mid-span plane. It is observed that the present results on both the suction and PSs are nearly consistent with experimental results in Ref. [Citation27] and simulated results in Refs. [Citation7,Citation8].
Figure 4. Model validation of the turbulence model using AGTB blade geometry.
2.6. Validation of particle deposition model
In order to investigate the interaction between the coolant air and particles from the mainstream, three parameters are defined as follows:
(11)
(11)
(12)
(12)
where the impact efficiency represents the ratio of the mass of particulates impacting on the surface to the total mass of particles (injected into the domain). The capture efficiency is the possibility of particles to stick on the wall.
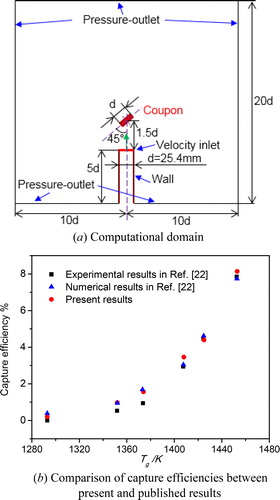
The particle capture efficiency is calculated by the particle deposition model developed using UDFs, and the results were validated with those in Ref. [Citation22]. These results have good agreement with both numerical and experimental results, and the error of the calculated results decreases as temperature increases as shown in . This particle deposition model is used at a high mainstream temperature of 1,453 K in this study.
Figure 5. Model validation of deposition model.
3. Results and discussion
3.1. Temperature distribution
shows film-cooling effectiveness distributions for various inlet flow angles at blowing ratios of 0.53, 0.93, 1.31, and 1.63. For the inlet flow angle of β1=133°, the film-cooling effectiveness on the SS (S/Lch<0) increases with the increase of the blowing ratio. This is because more coolant air is suppressed to form a better cooling protection of the wall, when the blowing ratio is increased. For the film-cooling effectiveness on the PS, a similar trend is also observed in most positions. Compared with the β1=133° case, the lower inlet flow angle (β1–10°) case shows lower film-cooling effectiveness distribution on the SS. The effectiveness values on the PS are obviously reduced for the blowing ratio of 0.53. The film-cooling effectiveness on the SS is improved by increasing the inlet flow angle in all cases. In addition, the effectiveness values on the PS significantly increase at the blowing ratio of 0.53.
Figure 6. Comparison of film-cooling effectiveness distributions for the cases with various inlet flow angles at four blowing ratios.
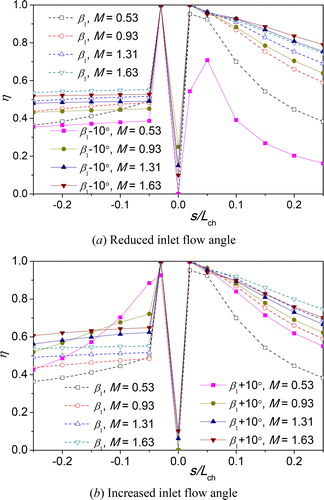
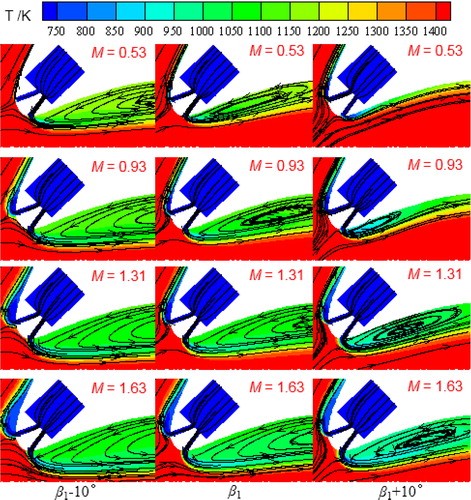
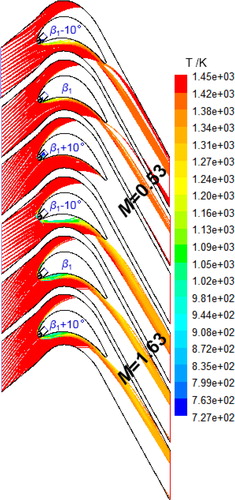
In order to explain the results and findings, plots streamlines and temperature contours near the leading edge for the cases with various inlet flow angles at four blowing ratios. A flow recirculation zone close to the PS is observed, which results in an obvious reduction of the film-cooling effectiveness near the leading edge in the case with β1+10˚. Compared with the flow recirculation zone in the cases with β1 and β1–10°, it is found that a larger inlet flow angle (β1+10°) weakens the intensity of the flow recirculation. In addition, the film-cooling effectiveness on the SS increases with increasing blowing ratio, and the coolant air provides better cooling protection for the SS than for the PS. This is because flow recirculation cannot be formed on the SS due to suppression from the mainstream.
Figure 7. Streamlines and temperature contours near the leading edge for the cases with various inlet flow angles at four blowing ratios.
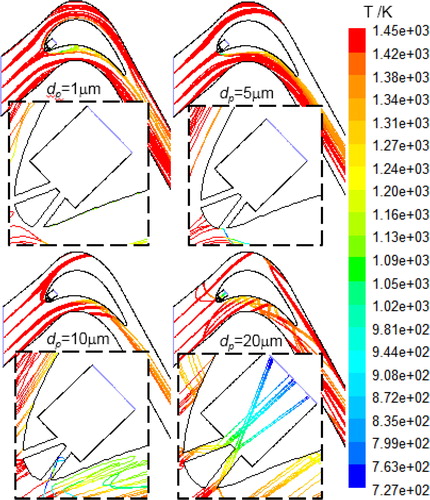
shows the effect of four particle sizes on trajectories of the motion of particles with M= 0.93 and β1=133˚. When the mainstream is mixed with small-size particles (dp = 1 µm, dp = 5 µm), few particles arrive at the blade surfaces. With increasing particle size, more particle collisions occur on the PS of the blade wall. Invasion of particles into the film-cooling hole is observed for dp = 10 µm, and more particles flow into the injection cavity of the coolant air for dp = 20 µm.
Figure 8. Particle trajectories for various particle diameters M= 0.93 and β1=133˚.
For cases with dp = 0.93 µm and β1=133°, comparisons of particle trajectories and temperature contours are conducted for various particle diameters as shown in . It is easily found that the increase in the particle diameter enhances the flow recirculation near the PS, and the particles in high mainstream temperature are cooled down by the coolant air injected through the film hole. Using particles with a diameter of 0.93, comparisons of particle trajectories and temperature variations for various inlet flow angles are conducted for M= 0.53 and 1.63 as shown in . It is found that the particle flow becomes narrow after the blade PS, when the inlet flow angle increases from β1–10° (123°) to β1 (133°). For the inlet flow angle of β1+10° (143°) at the blowing ratio of 0.53, most particles deposit on the PS and few particles flow through the end edge of the blade. For cases with a high blowing ratio (M= 1.63), results also indicate that increasing the inlet angle may increase the deposition of the particles, which is most likely because a large inlet angle results in a bigger impact area for particles.
Figure 9. Comparisons of particle trajectories and temperature variations for various particle diameters M= 0.93 and β1=133˚.
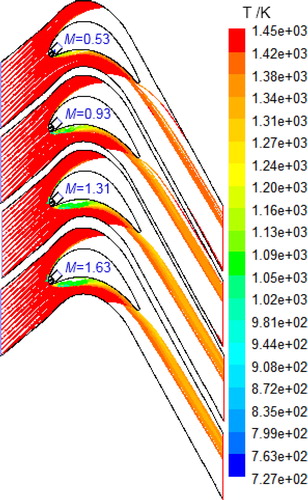
Figure 10. Comparisons of particle trajectories and temperature variations for various inlet flow angles at M=0.53 and 1.63, dp=0.93.
For various particle sizes, comparisons of impact and capture efficiencies in different zones are conducted as shown in . The impact efficiency in all the cases increases with the increase in particle size due to influence of flow inertia force. Results also show that the impact efficiency on the PS is significantly higher than in other zones. Based on the results for three inlet flow angles, the increase in the inlet flow angle (from β1–10° to β1+10°), the largest impact efficiency is increased. For the 50 µm particles with an inlet flow angle of β1+10°, the impact efficiencies on both the pressure and SSs are more than 200%, which reveal that most particles with a diameter of 50 µm impact on the wall more than twice.
Figure 11. Comparisons of impact and capture efficiencies in different zones based on various particle sizes.
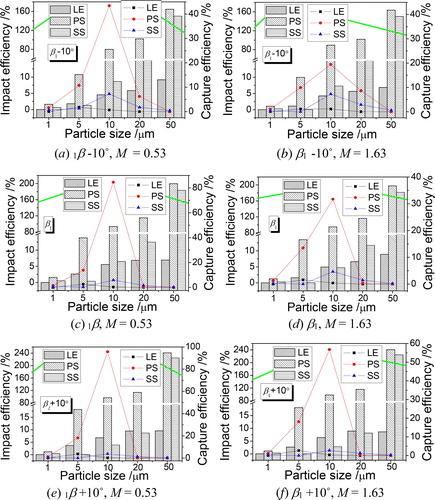
From line charts, the capture efficiency of the 1 µm particles in three zones is close to 0, when the blowing ratio is 0.53. This result indicates that most particles with a size of 1 µm show strong following behavior compared to those with other sizes. It is observed that the particle size of 10 µm at a certain blowing ratio shows the largest capture efficiency on the pressure and SSs, whereas the corresponding particle size is 5 µm at the leading edge. These results indicate that capture efficiencies in different zones are sensitive to the particle size. With increasing inlet flow angle (from β1–10° to β1+10°), the capture efficiencies for 10 µm particles both on the PS and at the leading edge increase significantly, whereas on the SS decreases appear.
presents comparisons of impact and capture efficiencies in different zones at four blowing ratios of 0.53, 0.93, 1.31, and 1.63. The effects of the inlet flow angle are investigated by using two particle sizes of 1 µm and 10 µm. From the results shown in e), it is found that the capture efficiency for the small particle size (1 µm) has the same value as the impact efficiency in all the zones. This result proves that all the 1 µm particles will deposit on the wall without any departure, when the particles contact the wall. The case with the inlet flow angle (β1) of 133° shows the lowest capture efficiency at the leading edge, and the capture efficiency will increase when the inlet flow angle changes. For all the inlet flow angles, the capture efficiency on the SS decreases with an increase in the blowing ratio. However, when the inlet flow angle decreases, the capture efficiency on the PS decreases significantly by increasing the blowing ratio.
Figure 12. Comparisons of impact and capture efficiencies at different blowing ratios based on various inlet flow angles.
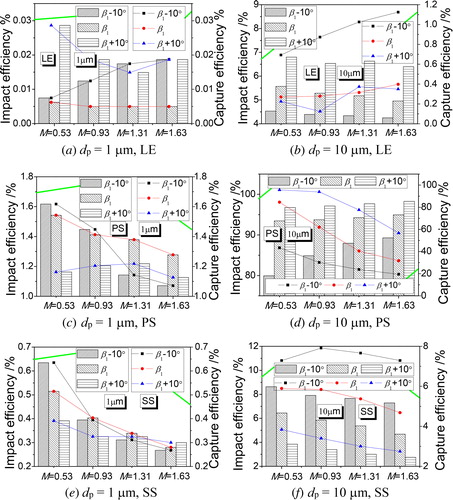
Compared with the results of the 1 µm particles, the capture efficiency for the 10 µm particles is clearly different from the impact efficiency in all cases. This finding reveals that the 10 µm particles have distinctly different movement trajectories from the mainstream. After particles contact the wall, some of them will depart from the surface. It is observed that lower inlet flow angles obtain higher capture efficiencies on the SS and at the leading edge, whereas decreasing the inlet flow angle can decrease the capture efficiency on the PS. For the PS, it is found that the capture efficiency also decreases by increasing the blowing ratio.
3.2. Invasion efficiency
In order to investigate the quantity of particles inside the film hole, a new concept of invasion efficiency is proposed. This parameter represents the possibility of particles to invade into the film hole, and the invasion efficiency can be calculated by the following equation:
(13)
(13)
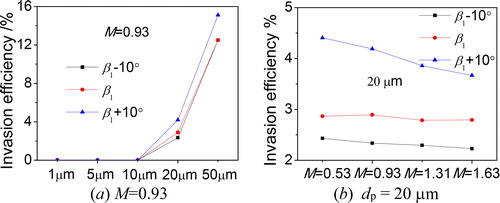
shows comparisons of invasion efficiencies for five particle sizes (1–50 µm) and four blowing ratios (0.53, 0.93, 1.31, and 1.63). It is found that at the blowing ratio of 0.93, a larger inlet flow angle shows higher invasion efficiency, and the particle invasion happens for a particle size above 10 µm. When the particles with 20 µm size are used, the particle invasion efficiency is increased with an increase in the blowing ratio. In addition, it is observed that the particle invasion efficiency is sensitive to the blowing ratio for a case with larger inlet flow angle. It is concluded that lower invasion efficiency can be obtained by using smaller particle size and lower blowing ratio.
Figure 13. Comparisons of invasion efficiencies under various particle sizes, inlet flow angles, and blowing ratios. (a) M=0.93. (b) dp=20 μm.
4. Conclusions
Based on the CFD technique coupled with a DPM, film-cooling effectiveness was numerically analyzed for two rows of cylindrical holes equipped on SS and PS of the leading edge, respectively. The deposition of ash particles was investigated based on calculations of capture efficiency and impact efficiency. A new parameter, named invasion efficiency, was proposed to analyze the invasion of particles into the film hole.
For the study of film-cooling effectiveness, lower distribution values are observed on the SS when the inlet flow angle is decreased by 10°, which indicates that the film-cooling effectiveness on the SS can be improved due to the increase of the inlet flow angle. Due to the suppression from the mainstream, an increase of the inlet flow angle and the blowing ratio will weaken the intensity of the recirculation on the SS.
For the analysis of the particle deposition on the wall surface, it is found that more particles will deposit on the PS by increasing the inlet flow angle and the blowing ratio. For the 50 µm particles, an inlet flow angle of 143° (β1+10°) shows more than 200% impact efficiencies on both the pressure and SSs. A lower inlet flow angle results in lower capture efficiency on the PS, and higher capture efficiencies both on the SS and at the leading edge. It is also observed that increasing the blowing ratio decreases the capture efficiency of the PS.
Some particles with a size of above 10 µm will invade into the film-cooling hole, For particles with 20 µm size, increasing the blowing ratio results in an increase of the particle invasion efficiency. In addition, an increase of the inlet flow angle also shows a larger possibility of the particle invasion into the film hole.
| Nomenclature | ||
| A | = | Surface area, m2 |
| C | = | Particle specific heat, kJ/kg K |
| Cu | = | Cunningham correction factor |
| dp | = | Particle diameter, µm |
| D | = | Hole diameter, mm |
| E | = | Young modulus, Pa |
| F | = | Force, N |
| FD | = | Drag force, N |
| FS | = | Saffman lift force, N |
| h | = | Convective heat transfer coefficient, W/m2 K |
| H | = | Vane height, mm |
| k | = | Kinetic energy of turbulence, m2/s2 |
| Kc | = | Composite Young modulus |
| L | = | Hole length, mm |
| m | = | Mass, kg |
| M | = | Blowing ratio, =(ρV)c /(ρV)1 |
| Ma | = | Mach number |
| N | = | Hole distance, mm |
| P | = | Pressure, Pa |
| PS | = | Pressure side |
| Re | = | Reynolds number |
| s | = | Coordinate along the blade surface, mm |
| SS | = | Suction side |
| T | = | Temperature, K |
| t′ | = | Cascade pitch, mm |
| Tu | = | Turbulent intensity, % |
| u | = | Streamwise velocity component, m/s |
| ufr | = | Wall friction velocity of turbulent flow, m/s |
| utc | = | Critical wall shear velocity, m/s |
| V | = | Velocity magnitude, m/s |
| WA | = | Particle sticking constant |
| x, y, z | = | Coordinate direction distance, mm |
| Greek symbols | ||
| α | = | Inclination angle, deg |
| β | = | Flow angle, deg |
| βs | = | Staggered angle, deg |
| ε | = | Turbulence dissipation rate, m2/s3 |
| η | = | Adiabatic film-cooling effectiveness, = (Taw-T1)/( Tc-T1) |
| ρ | = | Density, kg/m3 |
| τ | = | Stress tensor, N/m2 |
| Subscripts | ||
| 1 | = | Inlet flow |
| 2 | = | Outlet flow |
| aw | = | Adiabatic wall |
| c | = | Coolant flow |
| ch | = | Chord |
| cr | = | Critical value |
| g | = | Free stream gas |
| p | = | Particle property |
| is | = | Isentropic condition |
| s | = | Blade surface |
| t | = | Turbulent |
Additional information
Funding
References
- A. Azzi, M. Abidat, B. A. Jubran, and G. S. Theodoridis, “Film cooling predictions of simple and compound angle injection from one and two staggered rows,” Numer. Heat Transf. A Appl., vol. 40, no. 3, pp. 273–294, Jul. 2001. DOI: 10.1080/10407782.2001.10120637.
- K. Singh, B. Premachandran, M. R. Ravi, B. Suresh, and S. Vasudev, “Prediction of film cooling effectiveness over a flat plate from film heating studies,” Numer. Heat Transf. A Appl., vol. 69, no. 5, pp. 529–544, November 2016. DOI: 10.1080/10407782.2015.1090232.
- J. Wang, C. Gu, and B. Sundén, “Investigations of film cooling and its nonuniform distribution for the conjugate heat transfer passage with a compound inclined angle jet,” Numer. Heat Transf. A Appl., vol. 69, no. 1, pp. 14–30, September 2016. DOI: 10.1080/10407782.2015.1023156.
- B. T. An, J. J. Liu, X. D. Zhang, S. J. Zhou, and C. Zhang, “Film cooling effectiveness measurements of a near surface streamwise diffusion hole,” Int. J. Heat Mass Transf., vol. 103, pp. 1–13, Dec. 2016. DOI: 10.1016/j.ijheatmasstransfer.2016.07.028.
- K. Mazaheri, K. C. Kiani, and M. Karimi, “Application of a modified algebraic heat-flux model and second-moment-closure to high blowing-ratio film-cooling and corrugated heat-exchanger simulations,” Appl. Therm. Eng., vol. 124, pp. 948–966, Sep. 2017. DOI: 10.1016/j.applthermaleng.2017.06.093.
- S. Ardey and L. Fottner, “A systematic experimental study on the aerodynamics of leading edge film cooling on a large scale high pressure turbine cascade,” ASME 1998 International Gas Turbine and Aeroengine Congress and Exhibition, ASME, New York, NY, USA, Paper No. 98-GT-434, pp. V004T09A074, 1998. DOI: 10.1115/98-GT-434.
- S. B. Islami, S. P. A. Tabrizi, B. A. Jubran, and E. Esmaeilzadeh, “Influence of trenched shaped holes on turbine blade leading edge film cooling,” Heat Transf. Eng., vol. 31, no. 10, pp. 889–906, Jul. 2010. DOI: 10.1080/01457630903550317.
- S. Khajehhasani and B. Jubran, “Numerical evaluation of the performance of the sister-shaped single-hole schemes on turbine blade leading edge film cooling,” ASME Turbo Expo 2015: Turbine Technical Conference and Exposition, ASME, New York, NY, USA, Paper No. GT2015-44121, pp. V05BT12A053, 2015. DOI: 10.1115/GT2015-44121.
- C. Giehl, R. Brooker, H. Marxer, and M. Nowak, “An experimental simulation of volcanic ash deposition in gas turbines and implications for jet engine safety,” Chem. Geol., vol. 461, pp. 160–170, Jun. 2017. DOI: 10.1016/j.chemgeo.2016.11.024.
- C. R. Cosher and M. G. Dunn, “Comparison of the sensitivity to foreign particle ingestion of the GE-F101 and P/W-F100 engines to modern aircraft engines,” ASME Turbo Expo 2016: Turbine Technical Conference and Exposition, ASME, New York, NY, USA, Paper No. GT2016-56052, pp. V001T01A001, 2016. DOI: 10.1115/GT2016-56052.
- J. Wang, M. Vujanovic, and B. Sunden, “A review of multiphase flow and deposition effect in film-cooling gas turbine,” Therm. Sci., vol. 22, no. 5, pp. 1905–1921, Sep. 2018. DOI: 10.2298/TSCI180108258W.
- W. W. Xu, K. H. Zhu, J. J. Wang, Y. J. Lin, and Q. Li, “Modeling and numerical analysis of the effect of blade roughness on particle deposition in a flue gas turbine,” Powder Technol., vol. 347, pp. 59–65, Apr. 2019.
- A. Mensch and K. Thole, “Simulations of multiphase particle deposition on a gas turbine endwall with impingement and film cooling,” J. Turbomach., vol. 137, no. 11, pp. 111002, Nov. 2015. DOI: 10.1115/1.4031177.
- S. Wylie, A. Bucknell, P. Forsyth, M. McGilvray, and D. R. H. Gillespie, “Reduction in flow parameter resulting from volcanic ash deposition in engine representative cooling passages,” J. Turbomach., vol. 139, no. 3, pp. 031008, Mar. 2017. DOI: 10.1115/1.4034939.
- J. Wang, K. Tian, K. Zhang, J. Baleta, and B. Sundén, “Effect of spherical blockage configurations on film cooling,” Therm. Sci., vol. 22, no. 5, pp. 1933–1942, Feb. 2018. DOI: 10.2298/TSCI171229257W.
- J. N. Pan, J. J. Wang, S. F. Chen, X. X. Zhang, and S. Liu, “Numerical study of inlet Reynolds number in fine particles deposition processes in a flue gas turbine,” Powder Technol., vol. 339, pp. 506–520, Nov. 2018. DOI: 10.1016/j.powtec.2018.08.032.
- R. Prenter, A. Ameri, and J.P. Bons, “Computational simulation of deposition in a cooled high-pressure turbine stage with hot streaks,” J. Turbomach., vol. 139, no. 9, pp. 091005, Feb. 2017.
- S. S. Sreedharan and D. K. Tafti, “Composition dependent model for the prediction of syngas ash deposition in turbine gas hotpath,” Int. J. Heat Fluid Flow, vol. 32, no. 1, pp. 201–211, Feb. 2011. DOI: 10.1016/j.ijheatfluidflow.2010.10.006.
- S. Singh and D. Tafti, “Particle deposition model for particulate flows at high temperatures in gas turbine components,” Int. J. Heat Fluid Flow, vol. 52, pp. 72–83, Apr. 2015. DOI: 10.1016/j.ijheatfluidflow.2014.11.008.
- B. P. Casaday, A. A. Ameri, and J. P. Bons, “Numerical investigation of ash deposition on nozzle guide vane endwalls,” Trans. Asme J. Eng. Gas Turbines Power, vol. 135, no. 3, pp. 032001, Jul. 2013. DOI: 10.1115/1.4007736.
- H. El-Batsh and H. Haselbacher, “Numerical investigation of the effect of ash particle deposition on the flow field through turbine cascades,” ASME Turbo Expo 2002: Power for Land, Sea, and Air, ASME, New York, NY, USA, Paper No. GT2002-30600, pp. 1035–1043, 2002. DOI: 10.1115/GT2002-30600.
- W. G. Ai and T. H. Fletcher, “Computational analysis of conjugate heat transfer and particulate deposition on a high pressure turbine vane,” J. Turbomach., vol. 134, no. 4, pp. 041020, Jul. 2012. DOI: 10.1115/1.4003716.
- C. H. Wang, J. Z. Zhang, and J. H. Zhou, “Investigation of particle deposition characteristics in vicinity of laidback fan-shaped film cooling holes,” Flow Turbul. Combust., vol. 97, no. 2, pp. 591–607, Feb. 2016. DOI: 10.1007/s10494-015-9697-y.
- J. Wang, P. Cui, B. Sundén, and M. Vujanović, “Effects of deposition height and width on film cooling,” Numer. Heat Transf. A Appl., vol. 70, no. 6, pp. 673–687, Aug. 2016.
- J. Wang, P. Cui, B. Sundén, and R. Yang, “Effects of deposition locations on film cooling with and without a mist injection,” Numer. Heat Transf. A Appl., vol. 70, no. 10, pp. 1072–1086, Oct. 2016. DOI: 10.1080/10407782.2016.1230395.
- J. Wang, Q. Li, B. Sundén, J. Baleta, and M. Vujanović, “Two-phase flow simulation of mist film cooling with deposition for various boundary conditions,” Numer. Heat Transf. A Appl., vol. 71, no. 9, pp. 895–909, Jun. 2017. DOI: 10.1080/10407782.2017.1326790.
- S. Ardey, “3D-Messung des strömungsfeldes um die filmgekühlte vorderkante einer referenzschaufel,” Ph.D. thesis, University of the Armed Forces, Munich, Germany, 1998.
- D. E. Bohn and K. A. Kusterer, “Aerothermal investigations of mixing flow phenomena in case of radially inclined ejection holes at the leading edge,” J. Turbomach., vol. 122, no. 2, pp. 334–339, Apr. 2000. DOI: 10.1115/1.555456.
- S. J. Wolff, “Aerodynamische effekte bei vorderkanten-filmkühlausblasung an hochbelasteten turbinengittern unter dem einfluss periodisch instationärer zuströmung,” Ph.D. thesis, University of the Armed Forces, Munich, Germany, 2003.