
 ?Mathematical formulae have been encoded as MathML and are displayed in this HTML version using MathJax in order to improve their display. Uncheck the box to turn MathJax off. This feature requires Javascript. Click on a formula to zoom.
Abstract
The flow and temperature fields in packed beds are rather complex but are of great importance since they will influence macroscopic parameters and the overall performance of the packed bed system. Regions with either too high or too low velocity are not preferred since they will decrease the heat and mass transfer characteristics of packed beds. The residence time distribution (RTD) is a way to assess the characteristics of the flow maldistribution, where a narrower distribution is closer to the ideal plug flow with less dispersion. In this article, the RTD in three typical structured packed beds, namely, the simple cubic (SC) packing, the body-centered cubic (BCC) packing and the face-centered cubic (FCC) packing, are studied by using ANSYS FLUENT. Results show that, firstly, the RTD curve can be used to diagnose the flow pattern in packed beds where the skewed peak indicates the channeling effect and a long tail relates to recirculation. It is revealed secondly that, FCC packing has the narrowest RTD curve in the studied structures, BCC packing comes second and SC packing has the flattest RTD curve, which demonstrates that the flow uniformity in FCC packing is the best. For the same packing form, the flow is less maldistributed at higher velocity. Finally, it is shown that the packing form with less dispersion, which behaves more like the ideal plug flow, has a more uniform distribution of the particle-to-fluid heat transfer coefficient near the particle surface.
1. Introduction
Packed bed reactors are widely used in chemical industry due to their high specific surface area offered for the reactions and low cost [Citation1]. To date, many of the mathematical models of packed bed reactor are based on the assumption of plug flow which does not consider the flow inhomogeneity [Citation2]. However, this is not the case in real packed beds due to the complex geometry and the flow inhomogeneity has a big influence on the macroscopic parameters. The flow inhomogeneity is also an important issue in other devices such as heat exchangers. For example, Pasquier et al. [Citation3] studied the fluid flow distribution inside printed circuit heat exchanger headers and found that by introducing a novel header, the flow nonuniformity of the heat exchanger can be reduced by 91% and the heat transfer performance can be improved. Therefore, the estimation of flow inhomogeneity is of great importance and can support the development of better reactors.
The flow in the packed beds is rather complex. There exist regions with low flow resistance and others with high flow resistance. The low flow resistance can lead to a channeling effect, allowing a major portion of the fluid to flow through this pathway. Wall effect is one of the channeling effects in packed beds since the porosity near the wall is higher than in the bulk of the packed bed and hence the flow resistance is lower. Research has shown that the local velocity near the wall can be as high as 8 times the superficial velocity [Citation4]. The channeling effect is not good for the heat and mass transfer together with the reaction characteristics since the flow doesn’t have enough time to be in contact with the particles. Therefore, some modified structures were established to avoid the channeling effect [Citation5]. On the other hand, recirculation and stagnation occur in regions with high flow resistance. The flow going into these regions can also reduce the heat transfer and reaction characteristics since the change in the related parameters cannot be transferred to the downstream in time. From above, one can understand that the flow inhomogeneity is crucial for the overall energy efficiency of the packed bed reactor system.
The residence time distribution (RTD) is a common way to capture and diagnose the flow inhomogeneity. By giving a tracer signal at the inlet, the tracer concentration is monitored at the outlet. If the flow behaves as the ideal plug flow, which means a uniform velocity distribution in the cross sections along the flow direction, then the tracer signal obtained at the outlet is the same as the given one at the inlet but with a delay in time, when the molecular diffusion is neglected. However, if the flow is non-uniform with some channeling and stagnation inside it, then the tracer signal obtained at the outlet will be time-dependent. The tracer signal obtained at the outlet, which is expressed as the RTD curve, is used to estimate the flow maldistribution.
Typically there are two methods to receive the RTD curve, namely experimental measurement and a numerical study. Gupta and Bansal [Citation6] carried out RTD response experiments in packed bed reactors with different tube-to-particle diameter ratios and with different particle shapes to assess their effects on the axial dispersion coefficient. Menon et al. [Citation7] experimentally studied the flow characteristics in a typical packed bed electrochemical reactor under both non-electrolyzing conditions and electrolyzing conditions. The hydrodynamics of an upflow anaerobic fixed bed reactor were determined by tracer response experiments and by calculating the RTD curves at different volumetric flow rates [Citation8]. A non-ideal tracer detection technique was employed to study the flow pattern in a plate heat exchanger (PHE) by RTD curves since the deviation from the ideal plug flow will influence the heat-induced changes which is of significance in a PHE [Citation9]. An experimental study was also carried out in micro-structured plate reactors [Citation10]. The results showed that the zig-zag channel can obtain narrower distribution of RTD than the straight channels. Channels which can obtain narrow RTD and minimize dispersion were recommended. Liu et al. [Citation11] employed a steady symmetrical impinging stream technology to increase the particle’s residence time in the main active area to enhance the heat and mass transfer in an impinging stream reactor. Atmakidis and Kenig [Citation12] employed a tracer-injected method in numerical simulation which imitates the experimental process to study the RTD curves in packed beds with small tube-to-particle ratios to assess the influence of the wall effect. Another method called the post processing method was also adopted in their research and the results of the two methods were compared. Pawlowski et al. [Citation13] studied RTD in monolithic porous columns reconstructed from X-ray tomography data by computational fluid dynamics (CFD) modeling and made comparison with the experimental results. The RTD in multi-orifice baffled tubes was numerically studied where the concentration-time profile of the tracer was analyzed [Citation14]. Guo et al. [Citation2] revealed that there is a relationship between the velocity distribution in a cross section and the RTD curve by CFD simulations.
Researches have shown that the pore structure of packed beds can influence the flow fields as well as the temperature fields. Dixon and Wu [Citation15] studied the influence of thermowell, which is inserted into the center of randomly packed beds in the axial direction, on the velocity and temperature fields by carrying out pore-scale simulations. Results showed that, the pore structure near the thermowell was changed and axial temperature profiles were different to the un-instrumented beds. Jebakumar et al. [Citation16] carried out Lattice-Boltzmann simulations to study the flow past stationary particles in a channel to determine the influence of the particle on the flow structure. Yang et al. studied the fluid flow and heat transfer in structured packed beds by both experiment [Citation17] and numerical simulation [Citation18]. They found that the local and macroscopic characteristics of the structured packed beds with different packing configurations behave in quite a different way. Wang et al. [Citation19] carried out pore-scale simulations to study the velocity and temperature profiles in both simple cubic (SC) packing and the grille-sphere composite packed bed (GSCPB). The mechanism of heat transfer enhancement in GSCPB was revealed. The parametric study of the effect of packing parameters on the hydrodynamic characteristics in GSCPBs was further studied by Hu et al. [Citation20, Citation21]. Qian et al. [Citation22] studied the heat and mass transfer characteristics together with methane steam reaction performances in GSCPBs with different channel-to-particle diameters. A hollow structured packed bed (HSPB), which is a hybrid of the structured and randomly packed bed, proposed by Guo et al. [Citation23, Citation24] was used to increase the overall heat transfer characteristics in packed beds. Dasgupta and Atta [Citation25] performed numerical simulations to study the velocity distributions and flow maldistributions in packed beds with simple cubic (SC) packing and face-centered cubic (FCC) packing.
To the best of our knowledge, the flow maldistribution and its influence on heat transfer in different packing configurations of packed beds have not been fully studied. Therefore, the purpose of this article is to assess the flow pattern through RTD curves in three typical structured packed beds including the simple cubic (SC) packing, the body-centered cubic (BCC) packing and the face-centered cubic (FCC) packing. Then attempt to reveal the relationship between the RTD and the heat transfer is carried out. In this article, the physical models and the numerical methods including the simulation of RTD are described in Section 2. The results and discussion are presented in Section 3. Conclusions are organized in Section 4.
2. Numerical methods and RTD analysis
In this article, three typical structured packed beds including the simple cubic packing (SC), the body-centered cubic packing (BCC), and the face-centered cubic packing (FCC) were investigated. The physical models and numerical methods adopted in this article are described in this section.
2.1. Computational models
shows the schematic diagram of a packed bed which is orderly stacked by spheres. In the structured packed bed, the packing forms can be the SC, BCC or FCC forms, whose periodic packed cells are shown in . In the packed bed systems, the particles are supposed to have a higher temperature than the inlet flow, whereas the tube wall is adiabatic. In order to reduce the calculation amount, only one of the periodic flow channels is chosen for each configuration and walls all around are set as symmetric boundaries. For the sake of numerical simulations, the packed sections are extended to gain a fully developed and uniform flow at the inlet and avoid the backflow at the outlet. The computational domains for the three packing configurations are shown in and the corresponding parameters are listed in . To clarify, the length of the periodic cell in the three packing configurations varies from each other. However, in order to make a comparison between different configurations, the same packed section’s length (L2) is preferred. In this article, the packing configurations only consist of whole particles. As a result, different numbers of the periodic cell were chosen for different structures to guarantee a similar bed length which varied from 120 to 122.88 mm.
Figure 1. Schematic diagram and periodic cells of the structured packed beds.
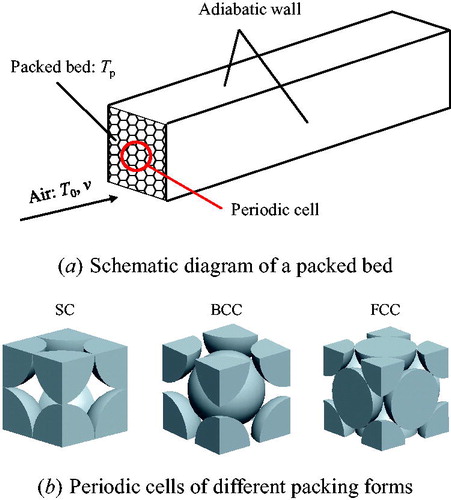
Figure 2. Computational domains for the three configurations.
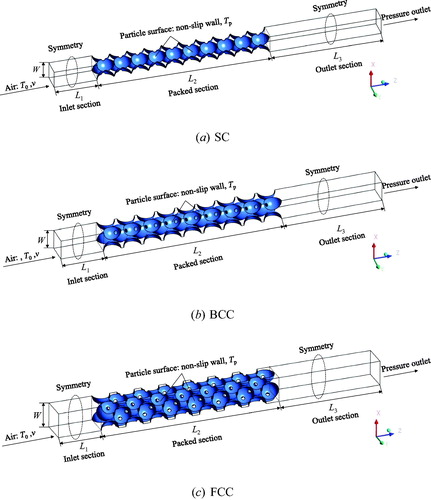
Table 1. Parameters in the computational models.
The Reynolds number in this article is defined as
(1)
(1)
where ρf is the fluid density, v is the inlet velocity, ε is the porosity of the packed bed, dh is the hydraulic diameter and μ is the dynamic viscosity of the fluid. The hydraulic diameter dh is defined as
(2)
(2)
where Vgas and Vt refer to the fluid volume and the total volume of the packed section, respectively. Ap represents the surface area of the particles.
The heat transfer coefficient is defined as
(3)
(3)
where q refers to the heat flux between the particle and the fluid, Tp and Tf are the temperature of the particle surface and the fluid, respectively.
2.2. Solution procedure and boundary conditions
In the simulations, air is adopted as the working fluid. The inlet is set as a velocity inlet while the outlet is a pressure outlet. The particle surfaces are set as non-slip walls with a constant temperature of 333 K. Air of 300 K flows into the computational domain and absorbs the heat carried by the particle surfaces until a balance is achieved.
The commercial software ANSYS FLUENT is employed to solve the three-dimensional Navier–Stokes and energy equations [Citation26]. In this article, the inlet velocity for the different configurations is supposed to be the same. Two inlet velocities of 1 m/s and 1.76 m/s are studied. When the inlet velocity equals to 1 m/s, the corresponding Reynolds numbers in SC, BCC and FCC forms are 1046, 806, and 740, respectively, which are in the range of turbulent flow (for SC packing, Re > 430; for BCC packing, Re > 350; for FCC packing, Re > 250 [Citation27]). The RNG k–ε turbulence model and scalable wall functions are adopted for the internal turbulent flow. The RNG k–ε turbulence model is applicable to the small-scale eddies, which are independent of the larger-scale phenomena that create them, and it is more suitable for modeling turbulent flow in complex geometries [Citation28]. The SIMPLE algorithm is used to handle the pressure-velocity coupling. The second-order upwind scheme is selected for the convective terms in the momentum, energy and turbulence equations. In order to guarantee convergence of the steady state, the residual of the calculation should be less than 10−6.
2.3. Mesh sensitive study
In order to avoid a poor mesh quality at the contact point between particles, a bridge model with the bridge diameter equal to 20% of the particle diameter is adopted since researches have shown that the bridge model can not only obtain reliable marcoscopic parameters, such as the pressure drop and the heat transfer coefficient, but also can acquire the corresponding flow fields [Citation29, Citation30].
For the calculation models, the commercial software ANSYS ICEM CFD is used to generate the mesh. A tetrahedral mesh is adopted due to the complex flow domain. The results are sensitive to the mesh dimension near the particle surfaces [Citation29]. Therefore, four grid systems of varying grid size near the particle surface (1/30 dp, 1/60 dp, 1/75 dp, and 1/100 dp) are chosen during the grid independence test. The Nusselt number (Nu) and friction factor (f) are calculated for different mesh dimensions. The maximal element size near the particle surface of 1/75 dp is adopted ultimately due to insignificant variations of the Nusselt number and friction factor. The details of the grid independence test can be found in our previous study [Citation19].
2.4. Numerical method validation
A similar packed bed model reported by Calis et al. [Citation31] and Romkes et al. [Citation32] is chosen to check the accuracy of the numerical method. The friction factor and Nusselt number are calculated and compared with the reference values. An average deviation of 3.94% and 0.43% for the friction factor and Nusselt number, respectively, indicates the reliability of the present method. Detailed information of this part can also be found in our previous study [Citation19], which is not going to be repeated here.
2.5. RTD by the tracer method
In the present study, the tracer method, which imitates the conventional experimental procedure, for the RTD determination is adopted. In the experimental procedure, a non-diffusive tracer is injected into the packed bed reactor. Although several input types including the pulse, periodic and random injections could be used, the most often used one in practice is the pulse injection (Dirac pulse), because it gives the RTD directly. An injection is considered as instantaneous, when its duration is less than 3% of the whole mean residence time within the system [Citation12]. The concentration of the tracer is recorded at the outlet of the packed bed.
A similar approach is used also in the CFD modeling. After the steady flow field is obtained, a non-diffusive tracer is injected into the computational domain using a Dirac function and the species transport equation is solved. The concentration of the tracer is calculated and followed until it completely exits the computational domain. The duration time of the tracer injection is less than 1% of the whole mean residence time [Citation12]. To clarify, the influence of molecular diffusion on the RTD characteristics is negligible. From the tracer concentration averaged over the cross section in the computational domain, the RTD function can be calculated using the following equation [Citation12]:
(4)
(4)
where Cave is the average tracer concentration of the cross section and t is the time. The mean residence time (MRT) τ and the variance of the residence time distribution (VRTD) σt can be calculated by the following equations:
(5)
(5)
(6)
(6)
Here, VRTD is used to assess the degree of flow non-uniformity and how far the flow deviates from the ideal plug flow. The smaller the VRTD, the closer is the flow pattern to an ideal plug flow [Citation33]. In this article, a series of cross sections along the axial direction were created and the tracer concentrations versus the time were monitored. After that, the RTD curves were obtained and the MRT and VRTD were calculated.
3. Results and discussion
In this section, the flow fields, the temperature fields and the residence time distributions in the three packing structures will be described in details.
3.1. Flow fields
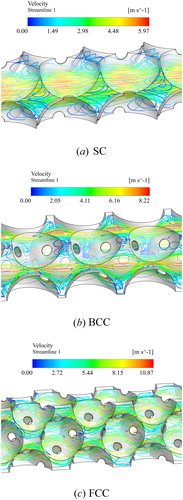
The flow fields in the three packing configurations are analyzed when the inlet velocity equals 1 m/s. shows the streamlines in the different packing configurations. From , one can see that there is a straight passage inside the SC structure where the velocity is high. However, recirculation occurs between the upstream particles and the downstream particles. The recirculation occupies a large proportion of the whole flow space. In the BCC packing, the maximum velocity is higher than that in SC packing but the high velocity region is much smaller. This indicates that the particle configuration of BCC packing has a fiercer disturbance but a less channeling effect compared with the SC packing. Also some backflow can be found in the BCC packing. As can be seen from , no obvious recirculation is found in the FCC packing, which is much different from SC and BCC packing forms. However, due to a small porosity, the maximum velocity in FCC packing can be as high as 10.87 times the inlet velocity. From these facts, one can learn that the recirculation occurs mostly when the distance between the upstream particles and the downstream particles is small, as in SC and BCC packing forms.
Figure 3. Streamlines in different packing configurations (v = 1 m/s).
3.2. Temperature fields
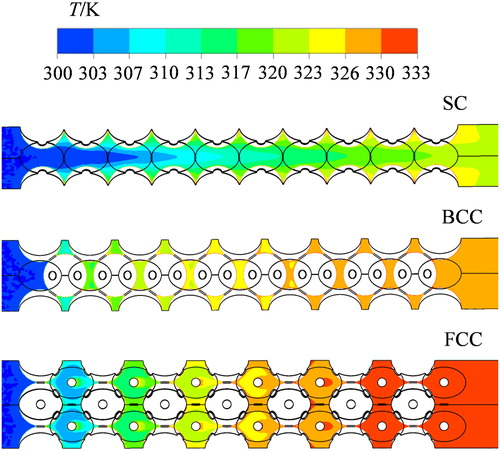
In the numerical simulations, the particle surfaces are assumed to have a constant temperature of 333 K, while the inlet temperature is 300 K. In this case, heat is transferred from the particle surfaces to the fluid. Therefore, the related heat transfer is the one between the particle and the fluid, which might be a quite important parameter in real applications. The temperature fields and the distributions of wall heat transfer coefficient on the particle surface in the three configurations are analyzed in this part. shows the positions of the studied cross sections and the selected particles. Here, the shown diagonal cross sections are used to analyze the temperature profiles and the marked particles are selected to study the wall heat transfer coefficient in the fully developed region. shows the temperature contours of the diagonal cross sections in three packing forms. From , it is obvious that the temperature rise becomes much more rapid from SC packing to BCC packing and to FCC packing. In the SC packing, the temperature of the central line increases gradually and hasn’t reached the same temperature as the particle surfaces until the end of the flow passage. This is because the leakage in the central passage in the SC packing is quite obvious, which means that the heat carried by the particle surface cannot be transferred to the fluid efficiently. In the BCC packing, although the temperature of the outlet is still lower than that of the particle surface, it is higher than the outlet temperature of the SC packing, indicating a stronger heat transfer in the BCC packing. In the FCC packing, the flow temperature has almost reached the equilibrium value ahead of the outlet, which demonstrates that the particle-to-fluid heat transfer coefficient has the highest value in FCC packing.
Figure 4. Positions of the diagonal cross sections and the selected particles.
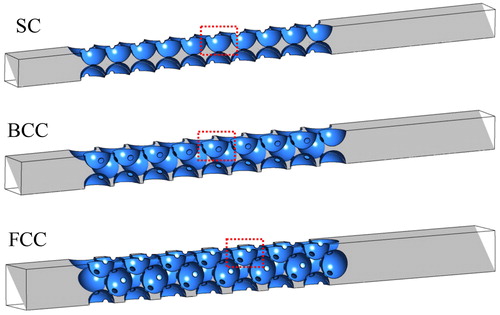
Figure 5. Temperature contours of the diagonal cross sections in the three configurations (v = 1 m/s).
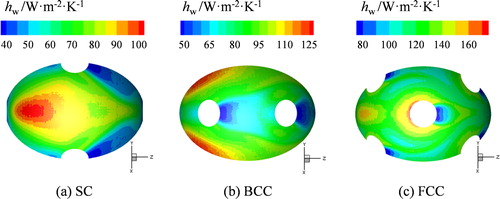
shows the distributions of wall heat transfer coefficient in the selected particle surfaces in three packing forms. From , it can be seen that the average wall heat transfer coefficient (hw) is becoming higher and higher from SC packing to BCC packing and to FCC packing, which results in the temperature profiles displayed in . Besides, in the SC packing, the variation of wall heat transfer coefficient is obvious where area with both high values and low values covers a considerable proportion of the whole particle surface. In the BCC packing, though the deviation of wall heat transfer coefficient can still be seen, it’s not so significant as in the SC packing. In the FCC packing, the distribution of the wall heat transfer coefficient is quite uniform where most region of the surface has the wall heat transfer coefficient near the mean value, which indicates that the heat transfer between the particle and the fluid is good.
Figure 6. Distributions of wall heat transfer coefficient in the three configurations (v = 1 m/s).
3.3. Residence time distributions
In the analysis of RTD, the tracer concentration is monitored at the outlet in principle. However, in the computational domain of the numerical simulations, the empty outlet section amid the outlet and the packed section can change the RTD curve of the packed section. In order to assess the influence just of the packing unit, the cross sections picked up in the middle of the packed section were used in the analysis instead. The area-weighted average value of the tracer’s concentration on these cross sections were monitored when a unity tracer concentration was injected into the packing at the first time step and then became zero during the remaining time period. The monitoring process was finished when at all cross sections, the accumulative tracer concentration with time reached unity, which means that all tracers have passed through the cross sections. In the SC packing, 12 cross sections are created in one periodic cell. In the BCC packing, the number of cross sections in one periodic cell is 10 and it is 16 in the FCC packing. Despite all these data, only part of the cross sections in the 4th periodic cell is used in the analysis to assess the flow pattern since the flow here is fully developed and hence can represent the RTD characteristics of the packing structure.
3.3.1. Residence time distribution in SC packing
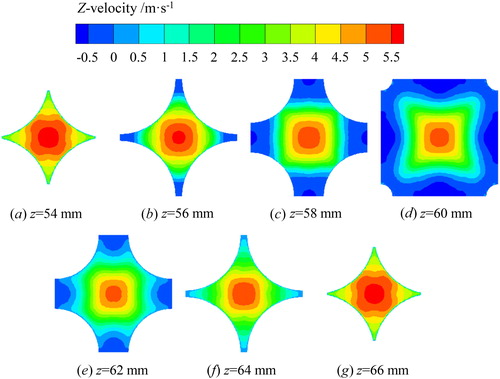
shows the RTD curves of 7 cross sections with the interval distance equal to 2 mm in the 4th periodic cell of SC packing. In the first cross section with z = 54 mm, the RTD curve is the thinnest and the highest. As the flow moves forward, the RTD curve first becomes wider and flatter and then returns to be thinner and taller until it reaches the second place at the last cross section. The results indicate that in one periodic cell of SC packing, the flow inhomogeneity increases first and then decreases. This phenomenon is closely related to the flow pattern in the packing structure. depicts the axial velocity (Z-velocity) contours in the related cross sections shown in . The flow moves almost along the axial direction in cross sections of z = 54 mm and z = 66 mm which are located on the particles’ middle cross section, as can be seen in . When the flow passes through the other cross sections, recirculation occurs, which means that negative velocity appears. As shown in , the negative velocity comes out around the edge of the cross section and it covers an increasing proportion of the whole cross-sectional area. The flow maldistribution in these cross sections can easily be seen. Therefore, the residence time distributions in these cross sections are becoming wider. As the flow continues, the area with negative velocity fades out gradually. As a result, the flow uniformity increases and the RTD curve becomes narrower and taller. It is remarkable that although the velocity field exhibits periodicity in the fully developed region, the RTD curve behaves in an aperiodic way since the RTD curve is a reflection of the flow inhomogeneity of the total flow channel and the flow non-uniformity anywhere will influence the whole residence time distribution.
Figure 7. RTD curves of various cross sections in the fourth periodic cell in SC packing (v = 1 m/s).
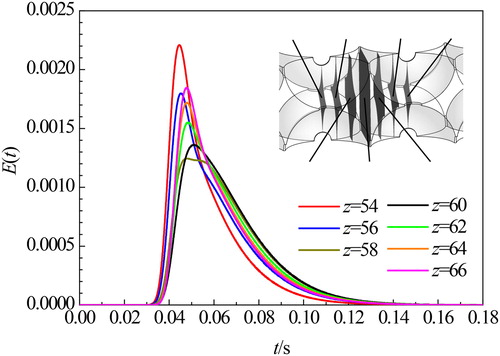
Figure 8. Contours of the Z-velocity of cross sections in SC packing (v = 1 m/s).
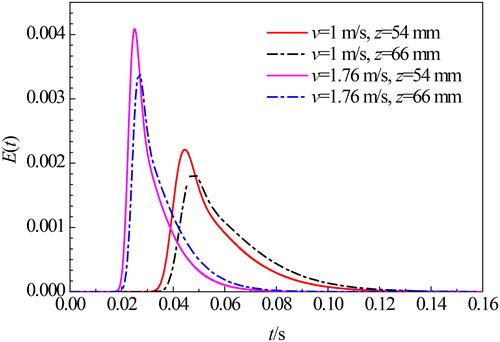
shows the RTD curves at two inlet velocities. It is found that the mean residence time (MRT) for v = 1.76 m/s is less than that for v = 1 m/s and the RTD curve for v = 1.76 m/s is thinner and taller at the same position. This indicates that the flow inhomogeneity is reduced at higher inlet velocity. What can be further found in is that the RTD curves of the SC packing show an evident asymmetry. The skewed peak is a result of the channeling effect occurring in the central flow passage and the long tail corresponds to the recirculation. Therefore, the shape of the RTD curve can be used to diagnose the flow pattern inside the structure.
Figure 9. RTD curves for two inlet velocities of the SC packing.
The MRT and VRTD for the two inlet velocities are listed in , where both variables with different velocities show similar variations in a periodic cell. The VRTD, which is calculated by the RTD curve, can be used as a quantitative indicator to assess the flow inhomogeneity. Smaller VRTD means that the flow is more uniform and is closer to the ideal plug flow. From , it is found that, at the same inlet velocity, the VRTD increases as the flow passes through a periodic cell due to the non-uniformity inside it. Besides, the VRTD has a lower value at the higher inlet velocity. Although the case with higher velocity can behave more like the ideal plug flow and the energy efficiency is expected to be higher, the pressure drop and MRT should also be taken into consideration to choose the optimal operation situation.
Table 2. MRT and VRTD of different cross sections in the SC packing.
3.3.2. Residence time distribution in BCC packing
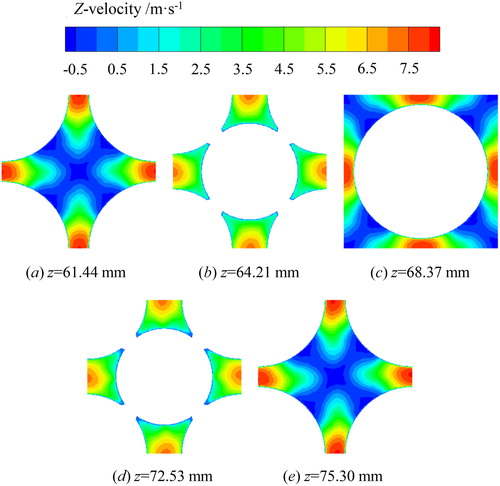
depicts the RTD curves of five cross sections in the 4th periodic cell in BCC packing when the inlet velocity is equal to 1 m/s. From , it can be seen that the RTD curves of the first cross section (z = 61.44 mm), the last cross section (z = 75.30 mm) and the middle cross section (z = 68.37 mm) are lower and flatter than those of z = 64.21 mm and z = 72.53 mm. Contours of the Z-velocity of the mentioned cross sections are displayed in . Apparently, there are negative velocities in cross sections of z = 61.44 mm, z = 75.30 mm and z = 68.37 mm, which makes the ranges of the velocity distribution wider and the RTD curves wider and flatter. As can be seen from , the negative velocities of the cross sections correspond to recirculations since they are located between the two particles in series. From , the ranges of the velocity distribution in cross sections of z = 64.21 mm and z = 72.53 mm are narrower compared with the above three cross sections. As a result, the corresponding RTD curves are thinner and taller. One can also see from that the RTD curves in BCC packing is asymmetric and has a long tail which is a reflection of the recirculation.
Figure 10. RTD curves of various cross sections in the fourth periodic cell in BCC packing (v = 1 m/s).
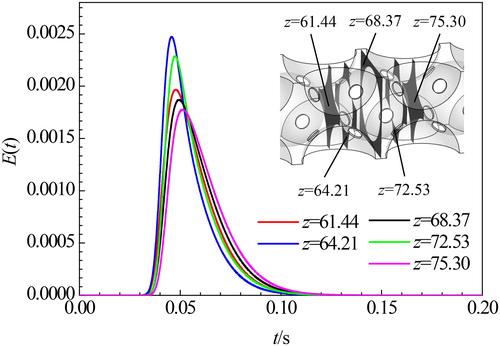
Figure 11. Contours of the Z-velocity of cross sections in BCC packing (v = 1 m/s).
The quantitative indicators of the BCC packing are listed in . As can be seen, after the flow advances for a periodic cell, the VRTD becomes larger. This is a general principle for all packing structures as long as the flow is non-ideal plug flow.
Table 3. MRT and VRTD of different cross sections in the BCC packing.
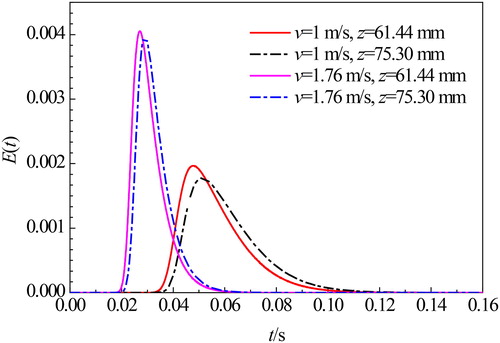
shows the RTD curves for two inlet velocities. The longer tail of v = 1 m/s makes it to deviate more from the ideal plug flow and the degree of flow inhomogeneity becomes higher, compared with the case of v = 1.76 m/s. The MRT and VRTD which show the same trend are listed in .
Figure 12. RTD curves for two inlet velocities of the BCC packing.
3.3.3. Residence time distribution in FCC packing
shows the RTD curves in FCC packing for an inlet velocity of 1 m/s. The curves show that the RTD of the FCC packing are very similar to a normal distribution. In contrast to SC and BCC packings, no tails are found here. This can be verified by the flow field displayed in , where almost no backflow occurs. The contours of the Z-velocity in the mentioned cross sections are depicted in . Here, it is obvious that the negative velocity is restricted to a very small proportion of the whole area and much more uniform velocity distributions are found in FCC packing compared to SC packing and BCC packing. Besides, the differences between all cross sections are not so significant as for the other two packing forms. shows the RTD curves of the cross sections z = 73.88 mm and z = 90.85 mm for the inlet velocities of 1 m/s and 1.76 m/s. All RTD curves present the similar shape, except for the expectation of the distribution, the amplitude and the variance. For the same inlet velocity, the RTD curve of the downstream cross section becomes lower and wider. For the same cross section, the RTD curve of the higher velocity is taller and thinner. The MRT and VRTD of FCC packing are listed in .
Figure 13. RTD curves in various cross sections in the fourth periodic cell in FCC packing (v = 1 m/s).
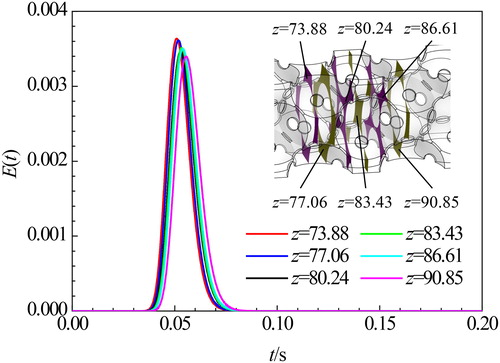
Figure 14. Contours of the Z-velocity of cross sections in FCC packing (v = 1 m/s).
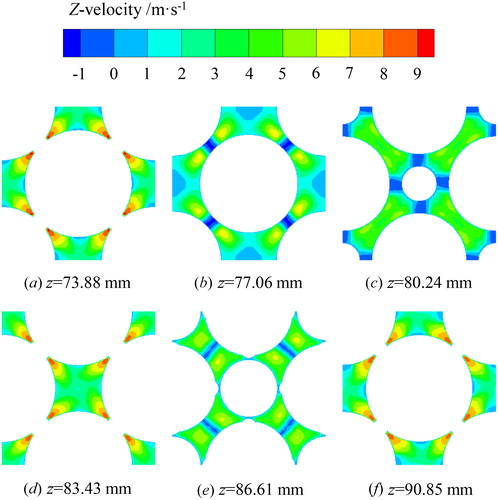
Figure 15. RTD curves for two inlet velocities of the FCC packing.
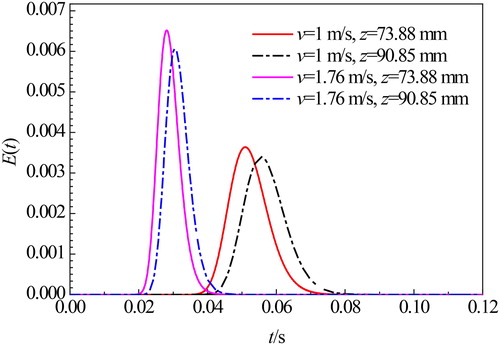
Table 4. MRT and VRTD of different cross sections in the FCC packing.
3.3.4. Comparison between three configurations
Although the inlet velocity in the three packing structures is the same, the various porosities make the internal velocities to differ from each other. For the same inlet velocity, the order of the internal velocity is FCC > BCC > SC, and as a result, the mean residence time is FCC < BCC < SC. In order to compare the RTD characteristics, a normalized time () is adopted here, which is calculated as the flow time divided by the mean residence time. Then the RTD curves versus the normalized time are drawn. The selection of the cross section positions is another problem in the comparison. Here two schemes are chosen. One is to compare the RTD curves at the same relative position, and the other is at the same absolute position. For the first scheme, the middle cross section and the end cross section of the 4th periodic cell in SC, BCC, and FCC packings are selected. This might be more suitable to explore the RTD and plug flow characteristics in the view of mechanism. For the second scheme, similar locations in SC, BCC and FCC packings (z equals to 100.00 mm, 100.25 mm, and 100.40 mm, respectively) are chosen. This method might appeal to the real applications more since if there are three kinds of packed beds with the same packing height, one will find out which one behaves more like the ideal plug flow. The results here can be helpful for the design of a packed bed reactor. shows the comparisons of RTD curves in the three packing configurations at three cross sections with different locations. From , it can be seen that the RTD curve of FCC packing is always the highest and the thinnest one and these show symmetric characteristics around their MRTs, which indicates that the flow pattern in FCC packing is the closest one to the ideal plug flow. In all cases, the RTD curves of the SC packing are the widest. However, the RTD curve at the end cross section in the 4th periodic cell of the SC packing, shown in , has a skewed peak due to the channeling effect captured in this cross section. In SC and BCC packing forms, the highest tracer concentrations come ahead of the MRTs and long tails appear, which show a varying degree of backflow inside the structures.
Figure 16. Comparisons of RTD curves in different packing configurations (v = 1 m/s).
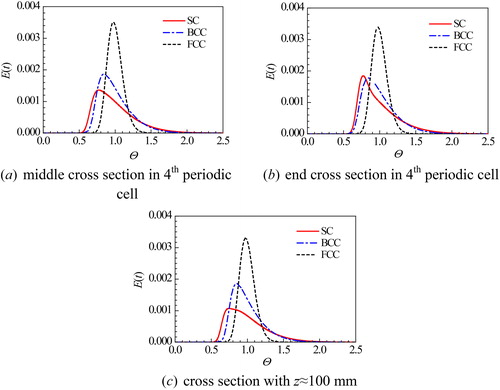
A more convincing result can be found from the VRTDs, which are shown in . Here, only the values of the cross sections of z ≈ 100 mm are given. It can be clearly seen that the VRTD of FCC packing is the smallest, while the VRTD of BCC packing comes second. The VRTD of SC packing has the largest value. The result is consistent with .
Table 5. Comparison of VRTD in different packing configurations.
The contours of mass fraction of the tracer (tracer concentration) at cross sections of z ≈ 100 mm for different residence times are shown in . As can be seen in , in SC packing, most tracer comes out at =0.75. For all times, it is the central part that has a higher tracer concentration. Similar to the velocity distribution, the distribution of the tracer concentration has a wide range in one cross section. When
=1.5, there is still tracer concentration on the cross section, which indicates the long tail in SC packing. , showing the cases in BCC packing, also shows that it is the
=0.75 case which has the highest tracer concentration instead of
=1. In contrast to the SC packing, the channeling effect can hardly be found in BCC packing since higher tracer concentration appears in all part of the cross section rather than at a certain location like the SC packing. Besides, when
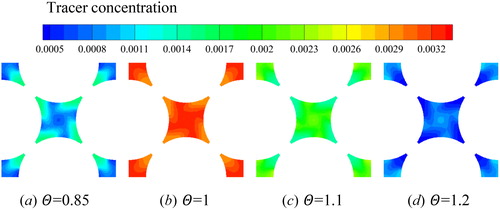
equals 1.5, the tracer concentration is close to zero, demonstrating that the tail is smaller compared with the SC packing. The tracer concentration in FCC packing, shown in , is much more different from the other two packing configurations. An extraordinary evenly-distributed tracer concentration is found in the cross section at all times. The highest tracer concentration appears at
=1. Furthermore, as time moves on, the tracer concentration reaches the highest value in a very short time and reaches zero promptly.
Figure 17. Contours of tracer concentration varying with time in SC packing (z = 100 mm).
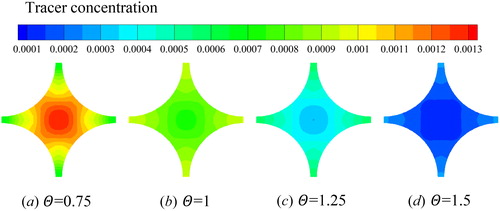
Figure 18. Contours of tracer concentration varying with time in BCC packing (z = 100.25 mm).
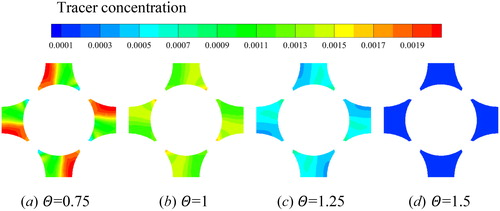
Figure 19. Contours of tracer concentration varying with time in FCC packing (z = 100.40 mm).
From the above RTD analysis, it can be inferred that there is a relationship between the flow maldistribution and the heat transfer performance. For flow with smaller VRTD, which represents a less dispersion and a more plug flow like flow, the distribution of the heat transfer between the particle and the fluid is supposed to be more uniform and a better heat transfer characteristic is expected. This can be helpful for the design of packing structure in real applications.
4. Conclusions
In this article, the flow inhomogeneity and heat transfer characteristics in simple cubic (SC) packing, body-centered cubic (BCC) packing and face-centered cubic (FCC) packing were numerically studied by the method of residence time distribution (RTD). The results are useful for estimation of flow maldistribution in packed beds with different packing configurations. The major findings are as follows:
The RTD curve can be used to diagnose the flow pattern in packed beds. In SC packing, the RTD curve has a skewed peak before the mean residence time (MRT), which means that there exists a channeling effect. After the MRT, there is a long tail indicating a recirculation inside it. In BCC packing, there is also a long tail since recirculation can also be obviously seen in this packing configuration. For FCC packing, the RTD curve is narrow and nearly symmetrical, which shows that the flow pattern is close to the ideal plug flow.
The variance of the residence time distribution (VRTD) can be used as an evaluation factor to assess the flow inhomogeneity. Smaller VRTD corresponding to narrower RTD curve means that the flow uniformity is better. In the studied packing structures, FCC packing has the lowest VRTD while SC packing has the highest value. For the same packing configuration, a higher velocity corresponds to a lower VRTD.
The local heat transfer between the particle and the fluid near the particle surface is more uniformly distributed in packing structure with less flow inhomogeneity. In the studied packing forms, FCC packing has the most uniform wall heat transfer coefficient and the strongest heat transfer.
| Nomenclature | ||
| Ap | = | surface area of particles, m2 |
| Cave | = | average tracer concentration |
| dp | = | particle diameter, m |
| dh | = | hydraulic diameter, m |
| h | = | heat transfer coefficient, W/(m2·K) |
| hw | = | wall heat transfer coefficient, W/(m2·K) |
| L1 | = | length of the inlet section, m |
| L2 | = | length of the packed section, m |
| L3 | = | length of the outlet section, m |
| q | = | heat flux, W/m2 |
| Re | = | Reynolds number based on the hydraulic diameter |
| T0 | = | temperature of the inlet air, K |
| Tf | = | temperature of the air, K |
| Tp | = | temperature of the particle surface, K |
| Vgas | = | volume of the fluid, m3 |
| Vt | = | volume of whole packed bed, m3 |
| v | = | inlet velocity, m/s |
| W | = | width of the computational domain, m |
| z | = | Z coordinate, mm |
| Greek symbols | ||
| ε | = | porosity of the packed bed |
| μ | = | dynamic viscosity of air, kg/(m·s) |
| = | normalized residence time | |
| ρf | = | density of air, kg/m3 |
| = | variance of residence time distribution, s2 | |
| τ | = | mean residence time, s |
| Abbreviations | ||
| BCC | = | body-centered cubic |
| CFD | = | computational fluid dynamics |
| FCC | = | face-centered cubic |
| GSCPB | = | grille-sphere composite packed bed |
| HSPB | = | hollow structured packed bed |
| MRT | = | mean residence time |
| PHE | = | plate heat exchanger |
| RTD | = | residence time distribution |
| SC | = | simple cubic |
| VRTD | = | variation of residence time distribution |
Additional information
Funding
References
- M. E. Taskin, A. G. Dixon, and E. H. Stitt, “CFD study of fluid flow and heat transfer in a fixed bed of cylinders,” Numer. Heat Transf. A Appl., vol. 52, no. 3, pp. 203–218, 2007. DOI: 10.1080/10407780601149896.
- B. Y. Guo, A. B. Yu, B. Wright, and P. Zulli, “Simulation of turbulent flow in a packed bed,” Chem. Eng. Technol., vol. 29, no. 5, pp. 596–603, 2006. DOI: 10.1002/ceat.200500292.
- U. Pasquier, W. X. Chu, M. Zeng, Y. T. Chen, Q. W. Wang, and T. Ma, “CFD simulation and optimization of fluid flow distribution inside printed circuit heat exchanger headers,” Numer. Heat Transf. A Appl., vol. 69, no. 7, pp. 710–726, 2016. DOI: 10.1080/10407782.2015.1090771.
- T. Atmakidis and E. Y. Kenig, “CFD-based analysis of the wall effect on the pressure drop in packed beds with moderate tube/particle diameter ratios in the laminar flow regime,” Chem. Eng. J., vol. 155, no. 1-2, pp. 404–410, 2009. DOI: 10.1016/j.cej.2009.07.057.
- J. Yang, J. Wu, L. Zhou, and Q. Wang, “Computational study of fluid flow and heat transfer in composite packed beds of spheres with low tube to particle diameter ratio,” Nucl. Eng. Des., vol. 300, pp. 85–96, 2016. DOI: 10.1016/j.nucengdes.2015.10.030.
- R. Gupta and A. Bansal, “Effect of bed configuration on dispersion in a packed-bed reactor,” Ind. Eng. Chem. Res., vol. 49, no. 19, pp. 9525–9528, 2010. DOI: 10.1021/ie901376s.
- S. H. Menon, G. Madhu, and J. Mathew, “Modeling residence time distribution (RTD) behavior in a packed-bed electrochemical reactor (PBER),” Int. J. Chem. Eng., vol. 2019, pp. 1–9, 2019. DOI: 10.1155/2019/7856340.
- D. Méndez-Romero, A. López-López, R. Vallejo-Rodríguez, and E. León-Becerril, “Hydrodynamic and kinetic assessment of an anaerobic fixed-bed reactor for slaughterhouse wastewater treatment,” Chem. Eng. Process., vol. 3, no. 50, pp. 273–280, 2011. DOI: 10.1016/j.cep.2011.02.002.
- C. G. Gutierrez, E. F. Dias, and J. A. Gut, “Investigation of the residence time distribution in a plate heat exchanger with series and parallel arrangements using a non-ideal tracer detection technique,” Appl. Therm. Eng., vol. 10, no. 31, pp. 1725–1733, 2011. DOI: 10.1016/j.applthermaleng.2011.02.015.
- A. Cantu-Perez, S. Bi, S. Barrass, M. Wood, and A. Gavriilidis, “Residence time distribution studies in microstructured plate reactors,” Appl. Therm. Eng., vol. 5, no. 31, pp. 634–639, 2011. DOI: 10.1016/j.applthermaleng.2010.04.024.
- X. Liu, S. Yue, L. Lu, W. Gao, and J. Li, “Flow simulation and experimental study of a dynamic asymmetric impinging stream,” Numer. Heat Transf. A Appl., vol. 12, no. 73, pp. 863–880, 2018. DOI: 10.1080/10407782.2018.1470812.
- T. Atmakidis and E. Y. Kenig, “Numerical analysis of residence time distribution in packed bed reactors with irregular particle arrangements,” Chem. Prod. Process. Model., vol. 1, no. 10, pp. 17–26, 2015. DOI: 10.1515/cppm-2014-0021.
- S. Pawlowski, N. Nayak, M. Meireles, C. Portugal, S. Velizarov, and J. Crespo, “CFD modelling of flow patterns, tortuosity and residence time distribution in monolithic porous columns reconstructed from X-ray tomography data,” Chem. Eng. J., vol. 350, pp. 757–766, 2018. DOI: 10.1016/j.cej.2018.06.017.
- D. González-Juárez, J. Solano, R. Herrero-Martín, and A. Harvey, “Residence time distribution in multiorifice baffled tubes: A numerical study,” Chem. Eng. Res. Des., vol. 118, pp. 259–269, 2017. DOI: 10.1016/j.cherd.2016.12.008.
- A. G. Dixon and Y. Wu, “Flow and heat transfer in narrow fixed beds with axial thermowells,” Numer. Heat Transf. A Appl., vol. 11, no. 76, pp. 811–829, 2019. DOI: 10.1080/10407782.2019.1673084.
- A. S. Jebakumar, V. Magi, and J. Abraham, “Lattice-Boltzmann simulations of flow past stationary particles in a channel,” Numer. Heat Transf. A Appl., vol. 5, no. 76, pp. 281–300, 2019. DOI: 10.1080/10407782.2019.1630240.
- J. Yang, J. Wang, S. S. Bu, M. Zeng, Q. W. Wang, and A. Nakayama, “Experimental analysis of forced convective heat transfer in novel structured packed beds of particles,” Chem. Eng. Sci., vol. 6, no. 71, pp. 126–137, 2012. DOI: 10.1016/j.ces.2011.12.005.
- J. Yang, Q. W. Wang, M. Zeng, and A. Nakayama, “Computational study of forced convective heat transfer in structured packed beds with spherical or ellipsoidal particles,” Chem. Eng. Sci., vol. 2, no. 65, pp. 726–738, 2010. DOI: 10.1016/j.ces.2009.09.026.
- J. Y. Wang, J. Yang, Z. L. Cheng, Y. Liu, Y. Chen, and Q. W. Wang, “Experimental and numerical study on pressure drop and heat transfer performance of grille-sphere composite structured packed bed,” Appl. Energy, vol. 227, pp. 719–730, 2018. DOI: 10.1016/j.apenergy.2017.07.140.
- Y. X. Hu, J. Yang, J. Y. Wang, and Q. W. Wang, “Investigation of hydrodynamic and heat transfer performances in grille-sphere composite pebble beds with DEM-CFD-Taguchi method,” Energy, vol. 155, pp. 909–920, 2018. DOI: 10.1016/j.energy.2018.05.018.
- Y. Hu, J. Wang, J. Yang, I. Mudawar, and Q. Wang, “Experimental study of forced convective heat transfer in grille-particle composite packed beds,” Int. J. Heat Mass Transf., vol. 129, pp. 103–112, 2019. DOI: 10.1016/j.ijheatmasstransfer.2018.09.103.
- P. Qian, J. Y. Wang, Z. H. Wu, J. Yang, and Q. W. Wang, “Performance comparison of methane steam reforming in a randomly packed bed and a grille-sphere composite packed bed,” Energy Convers. Manage., vol. 193, pp. 39–51, 2019. DOI: 10.1016/j.enconman.2019.04.052.
- Z. Guo, Z. Sun, N. Zhang, M. Ding, and Y. Zhou, “Influence of flow guiding conduit on pressure drop and convective heat transfer in packed beds,” Int. J. Heat Mass Transf., vol. 134, pp. 489–502, 2019. DOI: 10.1016/j.ijheatmasstransfer.2019.01.066.
- Z. Guo, Z. Sun, N. Zhang, M. Ding, H. Bian, and Z. Meng, “Computational study on fluid flow and heat transfer characteristic of hollow structured packed bed,” Powder Technol., vol. 344, pp. 463–474, 2019. DOI: 10.1016/j.powtec.2018.11.101.
- S. Dasgupta and A. Atta, “Analysis of single phase Newtonian and non-Newtonian velocity distribution in periodic packed beds,” Chem. Eng. J., vol. 324, pp. 182–193, 2017. DOI: 10.1016/j.cej.2017.04.120.
- Fluent. 14.5. Theory Guide. Canonsburg, PA: ANSYS Inc., 2012.
- S. S. Bu, J. Yang, Q. T. Dong, and Q. W. Wang, “Experimental study of flow transitions in structured packed beds of spheres with electrochemical technique,” Exp. Therm. Fluid. Sci., vol. 60, pp. 106–114, 2015. DOI: 10.1016/j.expthermflusci.2014.09.001.
- M. Nijemeisland and A. G. Dixon, “CFD study of fluid flow and wall heat transfer in a fixed bed of spheres,” AICHE J, vol. 5, no. 50, pp. 906–921, 2004. DOI: 10.1002/aic.10089.
- S. S. Bu, J. Yang, M. Zhou, S. Y. Li, Q. W. Wang, and Z. X. Guo, “On contact point modifications for forced convective heat transfer analysis in a structured packed bed of spheres,” Nucl. Eng. Des., vol. 5, no. 270, pp. 21–33, 2014. DOI: 10.1016/j.nucengdes.2014.01.001.
- A. G. Dixon, M. Nijemeisland, and E. H. Stitt, “Systematic mesh development for 3D CFD simulation of fixed beds: contact points study,” Comput. Chem. Eng., vol. 7, no. 48, pp. 135–153, 2013. DOI: 10.1016/j.compchemeng.2012.08.011.
- H. Calis, J. Nijenhuis, B. Paikert, F. Dautzenberg, and C. Van Den Bleek, “CFD modelling and experimental validation of pressure drop and flow profile in a novel structured catalytic reactor packing,” Chem. Eng. Sci., vol. 4, no. 56, pp. 1713–1720, 2001. DOI: 10.1016/S0009-2509(00)00400-0.
- S. Romkes, F. Dautzenberg, C. Van den Bleek, and H. Calis, “CFD modelling and experimental validation of particle-to-fluid mass and heat transfer in a packed bed at very low channel to particle diameter ratio,” Chem. Eng. J., vol. 1, no. 96, pp. 3–13, 2003. DOI: 10.1016/j.cej.2003.08.026.
- Z. Cao, J. Deng, W. Yuan, and Z. Chen, “Integration of CFD and RTD analysis in flow pattern and mixing behavior of rotary pressure exchanger with extended angle,” Desalin. Water Treat., vol. 33, no. 57, pp. 15265–15275, 2016. DOI: 10.1080/19443994.2015.1072739.