Abstract
Based on material published between 1989 and 2018 in this paper high performance liquid chromatography and electromigration techniques used in studies of natural dyes that can be found in historical objects are rewieved. Different aspects of analysis have been discussed: the stationary and mobile phase, the choice of sample solvent, methods of extraction and detection, including sensitivity parameters, such as LOD and/or LOQ. The discussed dyes have been divided into three categories (a) red antraquinone dyes along with dyes extracted from bark and tree juices, (b) yellow flavonoid dyes and saffron and (c) blue indigoid dyes. The main markers (chromophores or auxochromes) typical for each dye source were presented which allows to identify specific species of source plants and animals. The first part of the study involved the analysis of most critical findings when it comes to HPLC or represented an significant analytical approach. The second part of the study is focused on different aspects of electromigration techniques application in analysis of natural dyes with special attention paid on such parameters as the running buffer/mobile phase composition and sample solvent. Detection methods along with LOD and LOQ comparison in HPLC and electromigration techniques were also discussed. Methods of sample preparation, such as hydrolysis and extraction, used in HPLC and electromigration techniques were also briefly discussed.
Introduction
The knowledge of a chemical composition of samples from historical objects is of paramount importance in the process of their conservation. It allows, for example, to choose a proper method of filling losses in the painting layer or understand visual changes that occurred on the surface of the dyed material throughout centuries. Moreover, the knowledge of old painting techniques might help to prevent or decelerate negative physiochemical changes in painting layers by the proper choice of methodology of conservation and storing of historical objects. Humankind had long been fascinated by colors and sourcing them from the world around. Dyeing, unlike other disciplines, has always been a domain between chemistry and art, which required colormen to have specific skillset. Continuously developing analytical techniques, particularly chromatographic ones allow us to “go back in time”, study methods of the old masters and even recreate “secret” dyeing procedures, passed on from generation to generation. As analytical methods developed, a sample amount needed for analysis and taken from historical objects was significantly reduced—from 1 mg to ca. 0.1 mg or even less. Knowing the source of the dye is useful when dating historical objects, but also helps to establish their geographical origin. Dye trade flourished up until the late 19th century and trade routes intersected in many a place on Earth. Natural dyes played a significant part in various art disciplines; most notably in costumology, painting, ceramics or decorative elements of interior design: carpeting, curtains, upholstery.
Red natural dyes have been known and highly esteemed since ancient times. When it comes to the source of origin, one can distinguish animal dyes and plant dyes. Until the late 16th century, the most popular sources of red dye were animals such as kermes insect, polish and armenian cochineal, however once America had been discovered, dye industry was dominated by the american cochineal. Among the plant sourced red dyes the most commonly used were madder, mainly due to the easy sourcing process and thus its low price. Dye lac was commonly used in Persian carpets, while the Turkish ones were dyed using madder dye.[Citation1] Red dyes also include those sourced from bark or juices of caesalpinia, sandal tree as well as dragon’s blood. Yellow dyes are only sourced from plants and it is the largest group of dyes. The most expensive yellow source of dye is to this day sapphron. Blue dyes are a small group that includes plant-sourced dyes such as Indigo and woad as well as animal dyes such sourced from Murex mollusk. Tyrian purple is the oldest dye known to mankind and its use dates back to 1600 BC.[Citation2,Citation3]
Wouters was the pioneer in studying organic dyes in historical objects. In 1985, using RP-HPLC, he separated anthraquinones found in madder[Citation4] and in 1989 coccoid insect dyes.[Citation5] In 1991 he separated indigo derivatives in blue dyes. It was not until 1996 that laccaic acids found in lake dyes were analyzed by Halpine.[Citation6] These were the first key publications that formed foundations for further development of advanced chromatographic techniques of studying dyes in historical objects. Since then, along with the progress of analytical methods, the quality of separation of individual compounds, selectivity and quantity of substances in coloring extracts have increased.
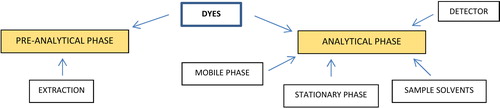
Publications regarding analysis of dyes from historical objects can be classified in two kinds which represent two most important alanytical steps (see ). The focus of the first kind is an analytical phase and development of parameters of chromatographic analysis such as: choice of mobile and stationary phases, temperature of the column, detection method, etc. The aim of these studies is obtaining the highest resolution of sample compounds. Second kind of papers focuses on the pre-analytical phase (extraction), the aim of which is to obtain the most efficient extraction of the coloring agent from as small a sample as possible. Combining high sensitivity of the analyses with selective and efficient extraction have become the fundamentals necessary for statistical data evaluation studies of natural dyes in historical objects using Principal Component Analysis (PCA).
Figure 1. Identification of dyes—analytical scheme.
Of the five review articles on the use of chromatographic techniques in the research on historical dressing dyes, four of them focus only on HPLC[Citation7–10] and one aimed exclusively a comparison of extraction methods in liquid chromatography techniques.[Citation11] In addition to publications, dye monographs should be mentioned. A comprehensive study of the chemistry of natural dyes including methods of their identification was published by D. Cardon (2007) and H. de Graaf (2004).[Citation2,Citation3]
For the last nearly 20 years advanced liquid chromatography has been the most popular technique in studies of natural dyes in historical objects. It is an effective and sensitive yet costly and time consuming method, which is the reason why majority of objects it has been used on and described in publications are the highest class historical objects. The current state of the art as well as conservation community emphasize the significance of the research step during routine conservation work, even for lower class historical objects. The analysis of compounds from historical objects, including dyes, should therefore be effective, sensitive as well as fast, easy and inexpensive, using as small a sample as possible.
Nowadays, the main alternative to HPLC are electromigration techniques (ET). During last years there has been an increase in interest and use of electromigration techniques for studying food and pharmaceutical dyes, which demonstrates their strong potential and some evident advantages over classical chromatographic techniques. However, from 2003 to 2018, only eight papers describing the use of ET for the study of dyes from works of art have been published. It seems, however, that the advantages of CE over HPLC still have not been fully utilized. To the best of our knowledge there has not been a scientific review covering the use of electromigration techniques in studying works of art and comparison to the well established HPLC.
First and foremost the “keywords” used in this publication must be defined and explained. A “marker” is a substance characteristic for a particular “source of a dye”, present regardless of the method of extraction used and external factors, such as age of the plant or dyeing method. A marker is a substance the content of which is characteristic for a particular “kind” (or “species”) and allows to distinguish key types of plants or animals used as “source of a dye”. A “dye” is an extract obtained from different “species” of plants and animals (“sources”). A “dye” can be, however, also a set of substances present in the extract that are able to color a material (“chromophores”). According to the typical definition a “chromophore” is a part of a molecule that is responsible for its color (e.g., a set of conjugated double bonds, aromatic ring and so on). However, in many papers dealing with dyes a “chromophore” is a substance (that means the entire molecule containing a “chromophore” according to the above typical definition) which determines the properties of a “dye” (or its “source”). The latter definition can be useful in discussion on dyes so we decided to keep it throughout the text.
Red dyes
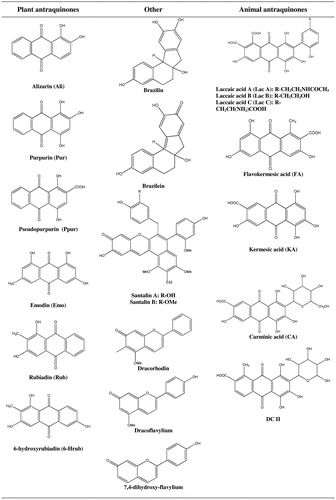
Despite overwhelmingly large number of anthraquinones present in nature, only a small number of them are chromophores—substances that determine red dyeing properties, obtained from certain plants and animals. Natural anthraquinone derivatives have different moieties (functional groups) in R1–R8 positions (see ).
Figure 2. Structures of antraquinones used in dyeing.
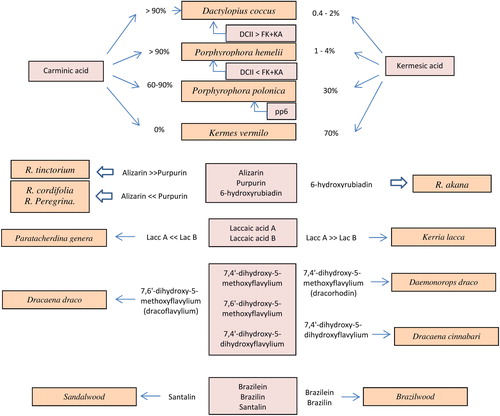
The study of the chemical composition of different species of cochineal is still one of the most discussed subjects in many publications and up to now keeps fascinating scientists. For most of them the identification process is based on defining relative percentage presence of individual compounds and comparison with the standard matrices. Wouters[Citation4] was the first to determine relative content of CA and KA in the four most common variants of cochineal.
According to Wouters: (a) Kermes vermilio contains the highest quantity of KA (70%) yet it does not contain CA, (b) Polish cochineal contains around 30% KA and 60–90% CA, (c) Armenian cochineal and American cochineal contain more than 90% CA and small quantities of KA (0.4–4%). One of the main issues when determining markers for cochineal species was large variability of such substances concentration as FK and KA within individual species connected with relatively high standard deviations observed during analyses. For example, relative percent of FK and KA was found to be 5.8% and together with standard deviation RSD = 5.7%. Due to this fact, scientists looked for other specific markers to characterize each species. Wouters[Citation4,Citation5] was the first to point out the importance of specific markers such as DCII, DCIV and DCVII. Serrano et al.[Citation12] who, combining mathematical dimension of the PCA analysis with high sensitivity detection HPLC-DAD-MS, as first conducted a factor analysis for three components: kermesic acid, flavokermesic acid and DCII. It was then possible to distinguish between Polish, Armenian and American cochineal. In addition, the Authors obtained almost a fingerprint (a unique chemical composition for each of the cochineal species), using a soft extraction method.
Also Polish cochineal was not easy to distinguish from the other two species. Only Lech et al.[Citation13] managed to determine a new marker called pps6. It was a significant improvement due to the use of novel methodology (HPLC-DAD/MS and soft extraction with HCOOH).
As for red dyes obtained from plants the most commonly used source was madder. Its popularity can be mainly attributed to the easy process of obtaining the dye and, as a result, a low price. Identification of main species of madder is based on comparison between relative quantities of selected markers, the composition of which is unique for each species. Numerous compounds found in the extract of madder are di- and trihydroxyanthraquinones.[Citation4,Citation6,Citation14–21] Wouters selected five key anthraquinones, composition of which varied from one species of madder to another. Based on the quantity of alizarin, purpurin, pseudopurpurin, munistein, rubiadin, he characterized three species of madder: R. tinctorium, R. munistta, R. peregrine.[Citation4] The results obtained by Wouters were confirmed by Mouri et al.[Citation16]. They concluded that in order to distinguish between the four species of madder R. tinctorium, R. akana, R. cordifola, R. peregine not five but three key markers were sufficient: Ali, Pur and 6-HRUBA. It is still difficult to distinguish between R. cordifola and R. peregrine due to the very similar chemical profile of both extracts.[Citation16]
To summarize the above mentioned findings: (i) Rubia akane, contrary to the other species, contains significant amount of 6-hydroxyrubiadine, (ii) Rubia tinctorium—contains mostly alizarin, (iii) Rubia cordifolia and Rubia Peregrina (wild madder) contain residue amounts of alizarin and 6-hydroxyrubiadin, but significant amounts of its derivatives: pseudopurpurines and munistein.[Citation16] Other anthraquinones might (but do not have to) be present in trace quantities and their presence says more about the technique of dyeing and age of the plant than allows for distinguishing between the plants. Mouri and Laursen excluded a number of anthraquinones that demonstrate high variability and are dependent on external factors. According to them the presence of ruberythric acid means that the dyeing process used fresh madder roots that had not undergone fermentation to alizarin. The presence of rubiadin—which was considered a marker for Mild madder was also identified in other species of madder.[Citation16] Its content might therefore depend on the dyeing method used during a particular process. Correct interpretation of the results is not easy, because chemical composition of the dyeing extract depends on many factors such as age of the plant, time of cutting, method of extraction (for instance, young plants contain significantly higher amounts of alizarin).[Citation22] Contrary to yellow flavonoid dyes, the content of glycosade form in the extract does not have an apparent impact on correct characteristic of a particular madder species. Knowledge of the composition of glycoside forms of anthraquinones is useful mainly in monitoring chemical changes occurring during the dyeing process.
The main chromophores of the laccaic dye are laccaic acids—A, B, C, E. The most common source of laccaic dye is Kerria lacca; a less common one is Paratachardina.[Citation1] The extract of Kerria lacca contains a richer chemical composition of laccaic acids and higher amount of Lac A. The profile of Paratachardina on the other hand is less rich chemical composition of laccaic acids and mainly contains Lac B. Hence, its dyeing performance is much lower than that of Kerria lacca.[Citation1,Citation5,Citation6,Citation20,Citation21]
In addition to the animal red dyes and species madder, in practice, those obtained from the bark of trees were also used. Although they used to give relatively unstable color, they were often used in the Middle Ages as a cheaper substitute for expensive animal dyes. The source of these dyes are some exotic trees that can be mainly found in Asia and South America.[Citation23,Citation24] Daemonorops draco is the most popular tree from which bark a dragon blood is obtained. Other species (Dracaena cinnabari, Dracaena draco) can be distinguished from each other based on the content of flavylium derivatives.[Citation25,Citation26] Dyes from the bark of the brazilwood tree were a cheaper substitute for cochineal. The Brazilian tree color extract contains a specific marker (brazilin), while the sandalwood tree extract contains santalin.[Citation26–28]
The summary of achievements in the field of extracting specific markers from various sources of red dyes is shown in .
Figure 3. Identification scheme of red natural dyes and their sources.
Red dyes—analysis with HPLC
Functional groups of different polarity as well as skeleton structure of anthraquinones make those compounds highly hydrophobic, which is why the RP-HPLC is an effective method to separate them. In this type of chromatography, the mechanism of retention is based mainly on hydrophobic interactions between hydrocarbon parts of the analytes and the stationary phase. Hence, not surprisingly, the choice of the proper hydrophobic stationary phase as well as the mobile phase composition play a crucial role in the development of the separation method. Moreover, several authors have raised that a column temperature is also a significant factor contributing to the effective separation of antraquinones.[Citation6,Citation29–34]
First research dealing with the subject of red dyes separation were those by Wouters et al.[Citation4,Citation5] published in 1985 and 1989 and later works by Halpine,[Citation6] Novotna et al.,[Citation20] Ackacha et al.[Citation21] and Blanc et al.,[Citation29] Sanyova et al.[Citation18] They described application of HPLC in studying dyes from historical objects using mainly UV-Vis and DAD detectors and were able to identify key anthraquinones typically found in cochineal, laccaic dye or madder (see ). As for detection methods in the analysis of red dyes, the UV-Vis detector is still popular.[Citation4–6,Citation18,Citation20,Citation25,Citation38,Citation41] This is justified—the standards of the analyzed anthraquinone compounds are relatively inexpensive, readily available and, apart from poor purpurin stability in organic solvents, they give characteristic absorbance spectra. The UV-Vis detector is cheaper and probaly is still more common than the MS detector,[Citation1,Citation12,Citation13,Citation15–17,Citation30,Citation36,Citation37,Citation39,Citation40] also it offers relatively good sensitivity, usually better than DAD.
Table 1. Red dyes—sources, markers, extraction conditions and HPLC separation conditions.
Octadecyl stationary phases are the most widely used for separation of this class of analytes of both plant and animal origin. The literature data (examples are presented in the ) show that in the case of red dyes analysis C18 or C8 (occasionally) columns were used, mostly with particle size of 5 µm.
An unquestionable achievements in research on stationary phases used for the separation of the antraquinone dyes were presented by Nowik et al.[Citation14] who investigated a series of twenty one C18 stationary phases and the influence of a kind of analyte functional groups and their conformations on the separation of 30 antraquinoids. Except for an extensive discussion on separation abilities of different columns the authors also reported that for acidic anthraquinones (CA, KA, FA) the best stationary phases were those containing aromatic and phenyl groups. Nowik et al. have also formulated an important conclusion that some antraquinones with a high chelating potential are sensitive to the presence of impurities in a stationary phase silica support. An evaluation of effectiveness of stationary phases with different functional groups for the separation of antraquinons emphasizes good results of some calixarene and aromatic phases (caltrex Resorcinarem, Luna Phenyl-Hexyl, Pursuit XRs DP—see ), but worse in nitro, cyano, PED, diol or cyclodextrine phases.[Citation14,Citation15] The authors emphasized the necessity of a compromise since various properties of the compounds make perfect separation of all of them under identical chromatographic conditions impossible. For example, using Luna phenyl-hexyl column it was possible to separate FK and CA at the expense of worse resolution of more hydrophobic antraquinones (Pseudo, Pur, Munist). All the results described by the above researchers unequivocally show that one cannot indicate the proper solution for the effective separation of these compounds and the analyst should be aware of viarious nuances often connected with the characteristics of the chromatographic columns.
Figure 4. Chromatograms of a red wool sample from 15th century tapestry identified using Pursuit XRs DP column with UV detection at wavelength of λ = 254 nm. Peak “A” is an impurity of formic acid used in mobile phase.[Citation14]
![Figure 4. Chromatograms of a red wool sample from 15th century tapestry identified using Pursuit XRs DP column with UV detection at wavelength of λ = 254 nm. Peak “A” is an impurity of formic acid used in mobile phase.[Citation14]](/cms/asset/a04d8d72-b210-49d2-a6ca-9160bf755e58/batc_a_1743640_f0004_b.jpg)
A breakthrough in the analysis of red dyes was introduction of the mass detector which played a major role in research on identification of cochineal species. Until then it was difficult to distinguish between individual species of cochineal due to the very similar chemical composition and a large diversity within the species. It has been reported that the typology of a given dye is determined by the residual amounts of some markers, the composition of which is a fingerprint of sorts. Wouters[Citation5] has already mentioned this fact in his first publication. Despite subsequent findings of Peggie and Serrano,[Citation12,Citation36] carminic acid derivatives such as DCII, DCIII, DCIV, DCVII, DDFK and DDCA were described and separated by Stathoupoulou et al.[Citation37] Mass detector proved to be useful for identification of many unknown derivatives of antraquinones that could be found in residual amounts in 0.2–0.3 mg samples of American as well as Polish cochineal. shows the example of the results obtained by Lech et al.[Citation13] who using a sensitive QTOF detector were able to identify structures of five markers found exclusively in Polish cochineal (pp2, pp6, pp7, pp10, pp12) and structures of new CA derivatives found in fabrics dyed using the American cochineal (dc1-dc9).
Figure 5. Differentiation of American and Polish cochineal by LC-MS: (a) UV chromatogram (287 nm) of extract from American cochineal, (b) UV–VIS (287, 435, and 495 nm) and MS chromatograms (extracted negative ion) of extract from Polish cochineal.[Citation13]
![Figure 5. Differentiation of American and Polish cochineal by LC-MS: (a) UV chromatogram (287 nm) of extract from American cochineal, (b) UV–VIS (287, 435, and 495 nm) and MS chromatograms (extracted negative ion) of extract from Polish cochineal.[Citation13]](/cms/asset/f2220bc9-6b53-466d-b50c-31b910f5a56c/batc_a_1743640_f0005_b.jpg)
According to the literature survey, there is no doubt that Zorbax (Phenyl, Eclipse Plus, SB, RX) were the columns most commonly used in the examination of carminic acid derivatives. A milestone was the introduction of reduced diameter columns and UHPLC systems to take advantage of using smaller particles of the stationary phases which was shown by Serrano et al.[Citation12,Citation30,Citation39] who also successfully employed acidified mobile phases to resolve carminic acid and DCII derivative in the presence of numerous different dyes.
The characterization of lake dye with the use of HPLC-DAD was presented by several groups: Wouters,[Citation42] Halpine,[Citation6] Novotna,[Citation20] Trojanowicz[Citation41] and with the use of HPLC-MS—by Ackacha,[Citation21] Gawryś,[Citation43] and Santos.[Citation1] All publications characterized exclusively Keria lacca species; in 2015 (Snatos et al.) an attempt to characterize two different sources of lake dye (Kerria lacca and much less popular Paratachordina) was made using HPLC-DAD-MS method in combination with PCA analysis.[Citation1]
Probably due to the complicated composition (resins), as well as problems with obtaining material for research (trees under protection) there exists just a small number of scientific papers on the identification of natural dyes obtained from the bark of trees. Sousa et al.[Citation25] have shown that HPLC-DAD proved to be an effective method when identifying different tree species of dragon’s blood (namely: Dracaena cinnabari, Dracaena draco, Daemonorops draco), brazilwood and sandalwood. Based on anthocyanin markers: 7,4′-dihydroxy-5-methoxyflavylium (dracorhodin, Daemonorops draco), 7,6′-dihydroxy-5-methoxyflavylium (dracoflavylium, Dracaena draco), 7,4′-dihydroxy-5-dihydroxyflavylium (Dracaena cinnabari) three basic species of dragon’s blood source could be distinguished. The first comprehensive publication on the identification of a red dye obtained from the brazilwood and sandal trees was the work of Surowiec et al. In this particular case, the chemical composition of individual extract components was not determined, only the differences between profiles of individual dye sources were indicated.[Citation26] Later, using a mild method of extraction, Monhita et al. composed a full chromatographic profile of a model material dyed using a brazilwood bark. They identified main dying compounds—brazilein and brazilin—using a Lichrocart Purospher Star RP-18 column and DAD-MS detection.[Citation27]
Blanc et al.[Citation29] and Serrano et al.[Citation12] indicated that good solubility of the dyes in different typically used solvents is not so obvious and this parameter should also be taken into account. According to the studies by Blanc et al., alizarin and purpurin do not dissolve in MeOH/H2O (50/50 by volume), but for example both demonstrated solubility in 100% water and 100% methanol. Meanwhile, most research published to date described MeOH/H2O (50/50) as a universal solvent. Blanc et al. in their work used 0.1 M SDS as a sample solvent. Serrano et al. proved the effect of sample diluent on DCII and CA resolution. Instead of the standard mixture, MeOH/H2O they used MeOH/H2O with 0.3% of perchloric acid obtaining satisfactory resolution of all tested compounds.
Red dyes—analysis with electromigration techniques
Puchalska et al.[Citation44] were pioneers in the field of separation of natural dyes from historic objects by electromigration techniques. Simultaneously the authors were the first to identify red dyes using a coupled technique—CE-MS. They identified five major anthraquinones: Ali, Emo, Pur, CA, La, with Emo remained unseparated. The analysis took only 10 minutes. Due to the wide range of hydrophobicity and the difference in polarity of the analyzed anthraquinones, proper selection of the buffer is not straightforward. For analysis by CE-MS, 20 mM ammonium carbonate (pH 9.0) was used as the separation buffer, in the case of CE-UV-Vis 5 mM sodium phosphate (pH 8.5). Separation buffer should allow stable ionization and proper mobility of all analytes. In the case of anthraquinone dyes analysis, alkaline pH buffers (pH > 8) are used, since they provide a stable transformation of phenolic forms of anthraquinones (such as Emo, Pur) into corresponding anions. However, in low pH buffer, uncharged acids (CA, LA) migrate together with the more hydrophobic antraquinones (Pur and Ali), which consequently worsens the resolution of the analyzed compounds. Buffer concentration and its pH affects the selectivity, surface area, peak heights and migration time of the anthraquinones. Generally, an increase in the concentration of the running buffer resulted in increased surface area of antraquinones and improved their resolution as well as signals height.
Although the research of Puchalska et al. were groundbreaking, the methodology developed by them was applied only for model samples, not for authentic historical objects. This was achieved by Lopez et al.[Citation45] who successfully applied CE to analyze authentic samples from historic maps. They were able to separate only three key antraquinones responsible for distinguishing the species of madders (Ali, Pur) and cochineal (CA). Their analysis also included dyes from other groups (indigo, gambogic acid, crocetin) and it is worth mentioning that the total analysis time was only 17.5 min using 40 mM sodium tetraborate buffer solution (pH 9.25). They demonstrated that CE was a very fast and easy alternative for identification of natural dyes by HPLC-DAD. The sample needed for the analysis by CE was smaller, the authors used a brush soaked with 0.1 M SDS for sampling.
Surowiec et al.[Citation46] separated five major anthraquinones—Ali, Emo, Xanto, Pur, CA using CE with UV-Vis and MS detections. In addition to anthraquinones, the mixture of natural dyes also contained flavonoids. Good resolution and relatively short analysis time (15 minutes) were achieved due to the introduction of organic solvent into the separation buffer (40 mM ammonium acetate pH 9.5 with 40% ACN).
There are two significant drawbacks of using CE in comparison to HPLC. Firstly, due to a chemical character of the analytes only maximum five red dues could be separated and secondly the sample solvent turned out to be a significant parameter in CE of red dyes. Properly selected it should provide electrophoretic mobility of all analytes present in the sample, and in practice it should be similar to the composition of the separation buffer. Also it should provide complete solubility of the analytes and guarantee their photochemical stability. Both sample solvent and BGE should be compatible in the terms of avoiding analyte precipitation, because the peak broadening and selectivity loss might occur (in HPLC, this problem was partially solved by increasing the column temperature).[Citation14] In the identification of red dyes, various media were used like purely organic (100% MeOH), water-organic (H2O/ACN 80/20) and aqueous (0.1 M SDS) for extraction of the analytes into the liquid phase.[Citation44–46]
Puchalska[Citation44] and Surowiec[Citation46] compared the LOD values (as a signal to noise ratio, S/N) of the red dyes from the anthraquinone group obtained with CE-UV-Vis and CE-MS (see ). According to Puchalska et al., LOD data indicate that CE (regardless of the choice of detector) was a more sensitive technique for polar anthraquinones such as LA and CA (LOD 0.15 − 0.36 μg/mL), poorer sensitivity was observed for Pur and Ali (LOD 0.52–1.20 μg/mL). The results obtained by Surowiec diverge from Puchalska’s data, especially in the case of CA and Pur. Probably the higher LOD for Pur was associated with incomplete solubility Pur in ACN/H2O mixture. Surowiec et al. reported high RSD values of peak areas for Pur (RSD = 14.3%), Emo (RSD = 2.0%). However, when comparing the LOD data obtained in both Puchalska and Surowiec studies with the corresponding HPLC/UV-VIS and HPLC/MS results, one can notice at least several times worse sensitivity obtained by capillary electrophoresis methods which can be attributed to much smaller sample volume and the detector construction (short optical path).[Citation44,Citation46]
Table 2. LOD for anthraquinones obtained with CE-UV-Vi and MS from the publications by Surowiec[Citation46] and Puchalska.[Citation44]
Red dyes—micellar electrokinetic chromatography
Trojanowicz et al. were pioneers in the study of natural dyes from historic objects using the micellar electrokinetic chromatography (MEKC). By combining MEKC with DAD spectrophotometric detection, they identified three anthraquinone dyes (Pur, Ali, CA) and five flavonoid dyes as presented in .[Citation50] Buffer consited of 20 mM sodium tetraborate, 50 mM SDS, 1 mM 1,3-diaminepropane. 1,3-diaminepropane was used as an “organic solvent” based on earlier research of Liang et al.[Citation51] As the content of the 1,3-diaminopropane in the running buffer was examined up to 3 mM only, which corresponded to ca. 0.025% by volume, it is hard to compare it to the typical amounts of solvents added to the BGE. Moreover, as it is a diamine compound it might have some special influence on the capillary-BGE-analyte system. However, the mechanism of such an effect on the separation was not commented in the above mentioned papers. The great advantage of Trojanowicz’s work is the use of the developed methodology for testing original samples from historic objects and comparing the results with those obtained using HPLC-DAD and HPLC-FLD.[Citation32,Citation43,Citation50] In comparison to HPLC, CE provided a comparable detectability and better efficiency of separation.[Citation50]
Table 3. Red dyes—sources, markers, extraction conditions and separation conditions by electromigration techniques.
Comprehensive and significant contribution in the field of research on natural red historical dyes was presented by Maguregui et al.[Citation49] In their experimental setup the mixture of standard red dyes had virtually all key markers including: Ali, Pur, CA, LA A, LA B, LA C, Quin, Sant, Brazil, Draco. The elaborated methodology allowed to distinguish to key sources of red dye such as madder beetle, cochineal, dragon’s blood, brazilian or sandalwood, wax dye. The running electrolyte used was 20 mM borax (pH 9), 20 mM SDS and 10% acetonitrile. All colorants were separated in less than 13 min with a good baseline resolution. The authors also tested the performance of 7 extraction solvents. Maguregui drew attention to the importance of organic solvent content in the separation of laccaid acids, which could not be successfully resolved without the addition of an organic modifier. Another advantage was the use of an idetification procedure for the material from the original antique object (see )—it should be emphasized here that the chosen matrix (17th century oil painting) was difficult in terms of the number of possible artifacts. Another important advantage of the proposed method is the reduced sample amount needed to carry out an analysis (in the nanogram range).
Figure 6. Electropherogram showing the presence of madder lake in a non attributed 17th century oil painting, property of the Diocesan Holy Art Museum of Bilbao. Buffer: 20 mM borax (pH 9) with 20 mM SDS and 10% acetonitrile, detection at 254 nm.[Citation49]
![Figure 6. Electropherogram showing the presence of madder lake in a non attributed 17th century oil painting, property of the Diocesan Holy Art Museum of Bilbao. Buffer: 20 mM borax (pH 9) with 20 mM SDS and 10% acetonitrile, detection at 254 nm.[Citation49]](/cms/asset/ef60ddb7-dcdd-4b19-a1db-f6e15db83148/batc_a_1743640_f0006_c.jpg)
Later Ahmadi’s[Citation47,Citation48] reports were a breakthrough in the area of significant lowering the limit of detection (LOD from 13 ng/ml to 400 ng/ml)—from now on electromigration techniques could compete with classical liquid chromatography techniques (HPLC-MS). The separation parameters in MEKC-LIF were optimized for the separation of antraquinon dyes: Pur, CA, Emo, Ali and flavonoid dyes in 20 mM borate buffes with 20 mM SDS. Ahmadi et al. drew attention to na problem of low photochemical stability of purpurin, which was more easily degraded at high buffer pH (above pH 9.24).
In addition to the undoubted advantages, disadvantage of the LIF detector is its price and the necessity of having several lasers in order to achieve a certain universality of the method. LIF detector is a selective detector while the nature of identified compounds in samples taken from historic objects shows quite a large variety in terms of absorbtion of light and fluorescence. Most of the anthraquinone dyes fluoresce, and using a laser of λex = 407 nm allowed for the analysis of both red and yellow dyes. Thanks to the MEKC connection with the LIF detector it was possible to use capillaries with a reduced inner diameter (Leff = 50 cm and a dc = 10 μm) together with higher voltage applied without the risk of excessive Joule heat generation.[Citation47,Citation48]
In MEKC, the solvent of the sample of the red dye mixture consisted of water (H2O, BGE) and solvent (MeOH, DMSO).[Citation47–50] In the case of anthraquinones, the effect of the sample solvent on selectivity was found to be more significant than typically in CE and it was particularly evident in the case of more hydrophobic anthraquinones. Also, in MEKC, the sample solvent has a much greater effect on peak parameters than in the case of classical liquid chromatographic techniques. For most of the analyzed anthraquinone dyes, higher stability and better peak parameters were obtained in electrolytes of alkaline pH (the best in the range from pH 8.5 to 9.24). The main problems in the identification of anthraquinones are related to the poor photochemical stability of purpurin, which decomposes when irradiated with UV-Vis light (fading of the solution can be observed while chemical decomposition purpurin to phthalic acid occurs—see ). The higher buffer pH the faster is the decomposition process.[Citation47] Simultaneous analysis of purpurin and other anthraquinones was often associated with quite onerous optimization of pH of both sample solvent and separation buffer. According to the latest published data, the complete solubility and photochemical stability of all anthraquinones are provided by aprotic solvents such as DMSO or DMF. Unfortunately, due to unfavorable properties (high viscosity, low electroosmotic mobility, UV cutoff at λ = 268 nm), they cannot be fully used in electromigration techniques. For several years, DMSO has been used in the NACE and MEKC studies only as an additive to the separation buffer and/or sample solvent.
Figure 7. Separation of selected dyes showing the degradation of purpurin: (a) 5.0 µg/mL Ali, (b) 10 µg/mL Pur, (c) 10 µg/mL CA, (d) 0.5 μg/mL morin; 18 kV, 20 mM borate buffer + 20 mM SDS, pH 9.24. (I) fresh solution, (II) same solution after 1 h.[Citation47]
![Figure 7. Separation of selected dyes showing the degradation of purpurin: (a) 5.0 µg/mL Ali, (b) 10 µg/mL Pur, (c) 10 µg/mL CA, (d) 0.5 μg/mL morin; 18 kV, 20 mM borate buffer + 20 mM SDS, pH 9.24. (I) fresh solution, (II) same solution after 1 h.[Citation47]](/cms/asset/92129b32-6d05-475f-8bde-5575c917856c/batc_a_1743640_f0007_b.jpg)
Yellow dyes
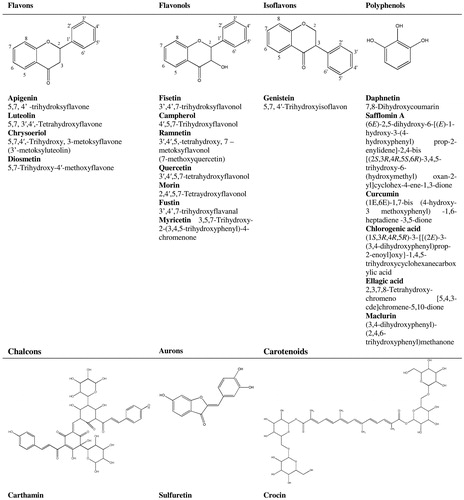
The main source of yellow dyes are plants containing color substances belonging to the chemical class called flavonoids (latin word for yellow is flavus). Flavonoids are compounds very widespread in nature, extracted from many species of plants, mostly dissolved in the cell juice in the form of flavonoid glycosides or other conjugates (e.g., sulphates). Of the many plants, only a small group is the biological source of the yellow dye. The most frequently reported in the literature plants are: reseda luteola (Reseda luteola), saw-wort (Serratula tinctoria), dyer’s greenweed (Genista tinctoria), a young fustik (Cotinus coggygria), persian berries (Rhamnus spp.), old fustik (Chlorophora tinctoria) and quercitron (Quercus tinctoria). Flavonoids responsible for the coloring properties of a given plant belong to the group of flavones, flavonols and isoflavones.[Citation52] The main markers of flavonoid dyes are as follows (see and ): (a) flavones: apigenin, luteolin, (b) isoflavones: genistein, (c) flavonols: fisetin, kaempferol, rhamnetin, morin, quercetin, rutin, mesclurin. The main markers of Cotinus cyggygria are fisetine and sulfuretine,[Citation53] Reseda luteola—significant amounts of apigenin, luteolin and chrysoeriol and lut-7-o-glc. Seratulla tinctoria, unlike reseda in addition to significant amounts of apigenin and luteolin, also contains chlorogenic acid.[Citation54] In the case of Genista tinctoria, genistein is a stable marker resistant to aging.[Citation55] Persian berries contain rhamnetin, old fustic—morolin and mesclurin, quercitron—ellagic acid. Daphne gnidium in addition to flavonoids (Api, Lut, Que, 3,7-di-O-glc) is characterized by the presence of coumarins (daphnetin, daphnin).[Citation56] The most resistant to fading are flavones and isoflavones. Objects in which these substances have been identified are still of permanent color even several hundred years after dyeing.
Figure 8. Identification scheme of yellow natural dyes and their sources.
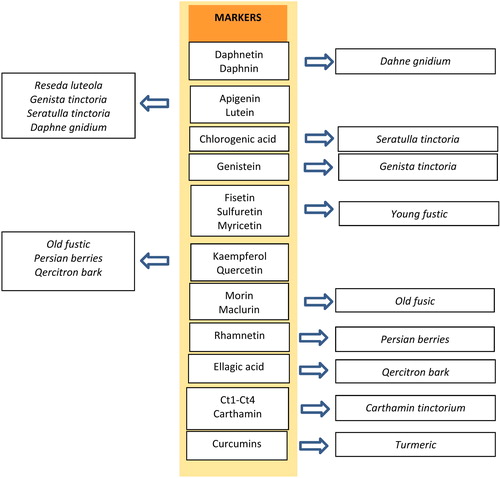
Figure 9. Yellow natural dyes that can be found in works of art.
Flavonols differ from flavones by an additional hydroxyl group at C3 carbon. If the 3-hydroxy group is conjugated to a sugar or other moiety, the flavonol derivative is stable to photo-oxidation. Most flavonols are synthesized in plants as glycosides and during in dyeing process many are subsequently converted by endogenous enzymes to their light-unstable aglycones. Adverse chemical transformations were prevented by modification of the dyeing process (for example by heating the buds (S. japonica). Quercetin, kaempferol and isorhamnetin are the most common flavonols and occur (usually as 3-O-conjugates) in many plants, so if one wishes to identify the plant that was used as a dyestuff for a particular object, it is important to extract the dyed object in a way that does not cleave the conjugated flavonol that is, by soft extraction.[Citation57] The chromatographic profile of yellow dyes depends strictly on the selection of the extraction method. In the case of extraction under strong acid conditions, all glycosides and other conjugates present in the sample hydrolyze to the suitable aglycones. In the process of soft extraction using weaker acids in the post-extraction mixture, we have a full chemical profile of the dye which includes both aglycones and flavonoid glycosides.
In addition to the analysis of glycoside flavonoid derivatives, interest in the analysis of hydroxy acids is growing. Zhang[Citation52] proved that hydroxybenzoic acids are products of degradation of 3-hydroxyflavonoles. According to Zhang, benzoic acids could not be created in the dyeing bath, due to the fact they are soluble in water and they would have to be removed at the stage of rinsing with water. So, it was suggested that the mechanism of benzoic acids formation can be dual: (1) firstly they can be produced in reactions catalyzed by a metal ion present in the fabric, that is in the fiber-metal-dye complex; (2) secondly, they can be created due to the influence of air and light. The position of hydroxy groups in benzoic acids is strictly dependent on flavonoid that undergoes degradation, for instance: 3,4-dihydroxybenzoic acid is the main product of decomposition of quercetin, 2,4-dihydroxybenzoic acid—maurin and 4-hydroxybenzoic acid—kaempferol.[Citation17,Citation52] As evidenced by research by Colombini,[Citation58] in samples dyed after ageing (conditions: RH 50%, T = 35.5 °C, λ = 280 nm) the level of main markers (flavonoles) drops and new, not previously found in freshly dyed material, hydroxybenzoic acids appear. The presence of benzoic acids helps to read results of very old, faded samples correctly, where dyed material might be completely degraded (see ). The knowledge on hydroxy acids can also be useful when distinguishing between other, non-flavonoid dyes, such as chalcons that, unlike flavonoles, do not degrade to benzoic acids.[Citation17,Citation31,Citation58]
Table 4. Aglycons and degradation products of most important yellow dyes.[Citation58]
Among the plants in which source of a yellow dye are non-flavonoid substances are saffron (Crocus savitus) and turmeric (Curcuma longa). The main saffron markers are carthamin (responsible for the red color) and four trans crociny isomers (designated as Ct1-Ct4). They are compounds that exist in the extract regardless of the age of the plant. It should be emphasized that saffron due to the direct dyeing mechanism (without the need for using mordants) fades quickly and is not resistant to increased wetness. Objects colored with saffron often have a barely visible yellow color. Ct1-Ct4 compounds are specific colorless markers, occurring even in very old historic buildings. Ct1-Ct4 isomers allow to distinguish saffron from other less popular plants with a similar composition as gardenia.[Citation59]
Yellow dyes—identification with HPLC
When identifying yellow dyes, an important aspect is the count of the identified compounds (). The analyzed substances might include not only flavonoid aglycones as well as their glycosides and other conjugates. The final composition of the post-extraction mixture depends on the chosen method of extraction. It is especially visible in the context of flavonoid dyes. When more aggressive acid conditions are applied, most glycosides undergo hydrolysis to their respective aglicons.[Citation17,Citation36,Citation55,Citation56,Citation58,Citation66,Citation67] When weaker acids are used, the chromatographic profile of the extract is far more rich as it contains aglicons as well as flavonoid glycosides.[Citation30,Citation52,Citation54,Citation60–62] The relative efficiencies of EDTA, and formic acid extraction methods for rutin, quarcetin and luteolin they are even three times larger compared by the relative efficiencies of HCl extraction (analyzing extracts of dyed samples of silk using HPLC DAD-MS).[Citation60] Examples of the influence of the extraction mixture composition on the number of identified analytes are shown in the , which presents chemical composition of different color extracts obtained from model fabric samples dyed with weld.
Table 5. Yellow dyes—sources, markers, extraction conditions and HPLC separation conditions.
Table 6. Change of sample composition depending on the acid in the extraction mixture on the sample of weld.
Along with the development of mild extraction methods, the number of analyzed compounds (mainly glycosides) increased, and thus the requirements regarding the selectivity and sensitivity of the apparatus used increased. Detection of flavonoids and their derivatives with a spectrophotometric detector requires appropriate resolution as well as appropriate standards. The effective identification of glycosides, in the case of using the UV-Vis detector, is difficult because indistinguishability of the spectra of the glycosidic forms and their respective aglycones, as well as the high cost or commercial unavailability of most of the standards. Where patterns are not available or selectivity is insufficient, the identification of dyes in a sample requires the use of combined detection techniques that provide additional structural information such as molecular weight, functional groups (MS, NMR or IR detector).
Progress in identification of natural dyes has been made in two areas: 1. refining methods of sample preparation (pre-analytical phase, optimization of extraction conditions) and 2. optimization parameters of chromatographic separation, mainly through applying different stationary phases and increasingly more sensitive detectors, including combined techniques (analytical phase). Here, the most important pioneering works were done by Wouters et al.,[Citation4] Halpine et al.,[Citation6] Szostek et al.,[Citation21,Citation43] Zhang et al.[Citation52,Citation60,Citation63] and their achievements are summarized in the .
In the analysis of the yellow dyes the importance of the column parameters in increasing sensitivity has been presented in publications by Surowiec et al.[Citation67] Along with reduction of column diameter, symmetry and peak heights increased, therefore improving the limit of detection (LOD) which suggest a great potential in using miniaturized separation techniques.[Citation67,Citation69] Looking at the analyses of flavonoid aglicons some tendencies can be observed, regardless of chromatographic conditions. Halpine was the first to observe that some important flavonoids elute together, like Lut and Que or Api and Kae. Those are the key compounds for identifying yellow dyes. The same issue was discovered by other researchers (). In addition, in the presence aglycons and their glycosides, aglycones which are small and more hydrophobic elute later on reversed phase HPLC columns.[Citation30,Citation53,Citation57,Citation62]
Table 7. Flavonoid retention times on different columns and detection parameters as reported by different authors.
The UHPLC was a great advance in improving the sensitivity of the detection of yellow dye markers. When comparing the LOD values for flavonoids (Api, Lut) obtained with HPLC-DAD and UHPLC-DAD, a ca. 3–5 fold reduction in LOD can be observed but only for apigenin and luteolin, while LOD of alizarin, purpurin and indigotin was not affected by switching from HPLC to UHPLC.[Citation30]
It is believed that only a full chromatographic profile including both flavonoids and their glycosides allows to get answers to questions regarding the geographical location, staining mechanism or technology of the dying which problems have been bothering art historians and conservators. Introduction of coupled techniques like HPLC-UV-Vis/MS helped to explain some difficult issues related to the aging of works of art, e.g., photodegradation, fading of dyes etc. Some subtle differences in the qualitative or quantitative composition caused by aging could be related to the flavonoids glycosides or other conjugates.[Citation57,Citation72,Citation73]
The knowledge on hydroxy acids can also be useful when distinguishing between other, non-flavonoid dyes, such as chalcons that, unlike flavonoles, do not degrade to benzoic acids.[Citation17,Citation31,Citation58] Due to small quantities of the acids in examined samples, an important factor was high detection sensitivity obtained using MS and MRM mode. An advantage of the latter methodology was its ability to distinguish the isomers of hydroxy acids.[Citation17,Citation31]
Saffron is currently the most expensive natural pigment, although it is most often used as a spice. It is usually distinguished from other yellow colorants because of characteristic set of yellow dyes. From publications since 1989, five key papers describing the identification of main markers in saffron can be distinguished and the HPLC conditions are summarized in . Most publications describe the extraction of saffron under conditions typical to other yellow dyes, that is, under acidic conditions.[Citation6,Citation29,Citation61,Citation65] Saffron is an expensive and unstable dye (textiles quickly fade), hence it was not so popular in dyeing. Saffron coloring of fabrics uses a different fiber-to-dye bonding method (direct dyeing) and isolation process do not require hydrolysis, but only extraction, i.e., using DMSO. The best results in terms of resolution and time of analysis using a UV-Vis detector were achieved by Mantzourius, who identified the characteristic compounds present in red (carthamin and crocetin) and yellow saffron (Safflomin A, yellow B and Ct1-Ct4) in one chromatogram.[Citation65] Saffron markers are denoted as Ct1-Ct4 which correspond to: trans-4-GG-crocin, trans-4-ng-crocin, trans-3-Gg-crocin and trans-2-G-crocin. Although they are colorless, their presence is independent of the age of the sample and can be a fingerprint of saffron dye. Han et al. employed UHPLC-DAD/MS in the study of dyes used in Chinese fabrics, including saffron.[Citation59] Knowledge of the chemical properties of saffron dyes has been extended to esterification and isomerization of saffron components, simultaneously the limit of detection of trace compounds have been reduced in such an analytical system. Thanks to this, based on the difference in the qualitative composition of the cis and trans isomers, it was possible to distinguish gardenia and saffron which was difficult to perform before.
Table 8. Extraction and chromatographic conditions in identification of saffron markers.
Yellow dyes—analysis with electromigration techniques
Capillary electrophoresis
So far only three publications reported the use of CE for the study of yellow dyes in historic objects (see ). The first most comprehensive publication dedicated to the purpose of testing yellow dyes in historic objects is the publication of Surowiec et. al. Using CE-DAD/MS they analyzed 6 dyes, including 5 flavonoids: Rha, Que, Api, Lut, Mor and one of the hydroxyacids: gallic acid. An ammonium ion based buffer was chosen for the separation because of its ability to form complexes with polyphenolic compounds and increase their effective negative charge and size. The factors that determined the properties of flavonoid migration are flavonoid subclass and degree of hydroxylation of the B-ring (usually a larger number of hydroxyl groups at B-ring increased the migration time of flavonoids).[Citation46]
Table 9. Identification of yellow dyes by electromigration techniques—extraction and separation conditions.
Using CE-UV-Vis, Lopez et. all identified yellow dyes—crocetin and gambogic acid, occurring respectively in the saffron and in Garcinia hamburu and, in another publication—the indole derivatives in natural sepia. Their methodology of sample preparation and analysis has been confirmed in the research of original samples from historical maps.[Citation45,Citation75]
The choice of sample solvent turned out to be also an important parameter. Flavonoids present in yellow dyes are more or less hydrophobic compounds. The choice of solvent is then not simple, particularly considering the fact that flavonoids belong to relatively unstable compounds. Typically ACN/H2O (20/80) was used to isolate flavonoids while for indole derivatives, crocetin and gambogic acid − 0.1 M SDS was a proper choice.[Citation45,Citation46,Citation75]
Surowiec et al. compared the sensitivity parameters of the flavonoids method obtained for CE-UV-VIS and CE-MS which is summarized in the . CE-UV-VIS LOD was in the range of 1.0–3.9 μg/mL, while in CE-MS it was 10-fold lower 0.3–0.9 μg/mL.[Citation46]
Table 10. Example of CE separation results with spectrophotometric and mass detectors as reported in [Citation46]. See text for details.
Until now, among the analyzed mixture of flavonoid compounds in samples from historic objects, only aglycones (flavones and flavonols) were included, there were no their glycosides.[Citation46] Flavonoid glycosides are much larger molecules and have lower negative charge (lower charge-to-size ratio), so one can assume they would migrate faster toward the detector than their aglycones assuming the presence of cathodic EOF.[Citation76]
Undoubtedly the use of a mass detector with CE turned out to be more important in identifying flavonoids than anthraquinones. In the analysis of flavonoid colorants the number of identified compounds and insufficient resolution of key flavonoid dyes was problematic, which resulted in the difficulties in obtaining the informative spectra of overlapping peaks (e.g., Lut, Que, Api). Introduction of CE-MS did not solve all of the problems of separation of structural isomers of flavonoids such as Mor and Que—in such a case it was necessary to compare the migration time and UV-Vis absorption spectra of the particular compounds ().[Citation46]
Micellar elecrokinetic chromatography
Despite the high interest in the MEKC technique and progress in the field of identification of natural flavonoids in various fields of science (for example in pharmacology[Citation77]), there were only two publications in the field of works of art research ().[Citation48,Citation50] Rha, Que, Kae, Lut, Api were separated by MEKC-UV-Vis while Kae, Lut, Api, Myr, Que, Mor were identified by MEKC-LIF.[Citation46,Citation48,Citation50] In MEKC the differences in migration of flavonoids are mainly governed by their hydrophobicity.[Citation78] In the case of neutral or hydrophobic substances, to which flavonoids belong, apparent electrophoretic mobility is the result of their own electrophoretic mobility and partition between micelles and the surrounding buffer. Trojanowicz et al. used 20 mM borate buffer (pH 8.5) containing 50 mM SDS and 1,3-diaminepropane (1 mM) as a separation electrolyte, while Ahmadi − 20 mM borate buffer (pH 8.0) with 20 mM SDS. Borate buffer was often employed in separation of flavonoids due to its ability to create anionic complexes with compounds possessing neighboring hydroxyl groups such as luteolin or quercetin.[Citation79,Citation80] The optimization of separation was achieved by change of the buffer pH, parameters of organic solvents and surfactant (SDS) and finally detection parameters in UV or LIF detectors.[Citation48–50] The migration of flavonoids and their resolution is mostly influenced by buffer characteristics (pH and concentration), surfactant (concentration) and type of organic solvents (MeOH or ACN).[Citation48] The increase in ACN content usually improve the flavonoid signal (peak height), but at a higher concentration (about 20–30%) organic solvent tended to suppress the fluorescence signal of the analytes.[Citation50] Sample solvent plays also an important role in analysis of flavonoids. In the case of MEKC-LIF analysis, a mixture of DMSO and a running buffer was used as a sample solvent while in MEKC-UV-Vis a standard MeOH/H2O mixture was a good choice. Detection limits for flavonoids () in MEKC-LIF are typically a few nanograms per mililiter (0.7–7.2 ng/mL) and are comparable to the results obtained with HPLC-MS (0.5–2 ng/mL). MEKC-LIF turned out to be superior to other electromigration techniques, which is represented by the following LOD data: CE-UV-Vis (1.0–3.9 μg/mL), CE-MS (0.3–0.9 μg/mL), CE-LIF (0.7–7.2 ng/mL).
Table 11. Limit of detection for flavonoids (electromigration techniques versus liquid chromatography) in [μg/mL].
Of the key flavonoids, fisetin (old fustik) and genistein (Genista tinctoria) have not been identified so far, and no attempts have been made to analyze flavonoid glycosides. It would be necessary to broaden the base of identified flavonoid dyes by aglycone glycosides, which are crucial in the determination of dye sources and provenance of the sample. According to the latest literature, the optimization of the flavonoid and their glicosides separation conditions in MEKC is achieved by using mixed micelles (SDS and SC) or addition of cyclodextrins (instead of organic solvents). The addition of cyclodextrins aims to reduce the interaction of the analyte with the micelles, which consequently leads to improving the resolution of the most hydrophobic compounds.[Citation77]
Blue dyes
Blue dyes can be divided into animal and plant dyes based on their source (see and ). One of the most common natural dyes sourced from plants is indigo. The main sources of indigo are Indigofera tinctoria and Isatis tinctoria. Distinguishing between synthetic indigo, Indigofera tinctoria and Isatis tinctoria is relatively easy as it requires determination of indigotin percentage:[Citation42,Citation81–85] Indigofera tinctoria contains slightly more than ten percent, while Isatis tinctoria only a few percent. The only animal blue dye is Tyrian purple. This blue-violet dye is obtained from some species of mollusks, such as M. Brandaris, M. Trunculus (Murex) T. Haemastoma (rock-shell). The main coloring component of Tyrian purple is 6,6′-dibromindigotin (6,6′-DBI).[Citation42,Citation51,Citation81,Citation83,Citation85–88]
Figure 10. Structures of natural blue dyes—indigo derivatives.
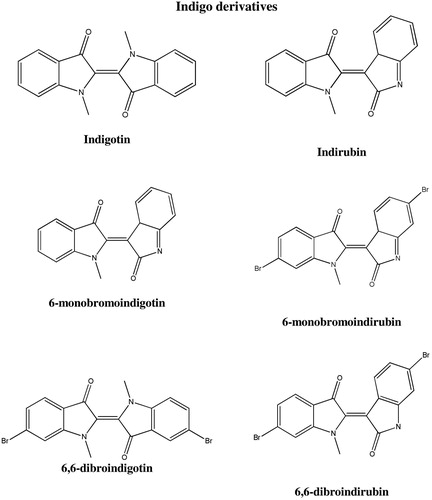
Figure 11. Blue dyes—dye source identification scheme.
The process of dyeing with indigoid dyes is a complex process of chemical transformations based on redox reactions. Indigo dyes are so called vat dyes characterized by high fading and washing resistance.
Indigo is generated in damaged leaves through oxidation of products of hydrolysis of relevant precursors to indoxyl. In the case of Indigofera tinctoria, the main precursor of indigo is indican (indoxyl-β-d-glycoside), in Isatis tinctoria—indican, isatan B (indoxyl-β-ketogluconate) and isatan C.
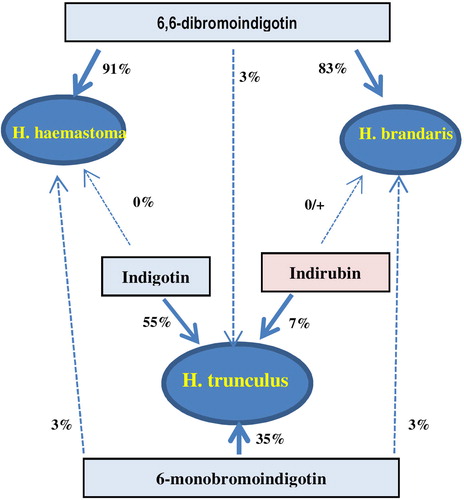
Isatan C, through chemical reactions, transmutes into isoindirubin (red color) and isoindigo (brown color); hence Isatis tinctoria dyed fabrics have a reddish blue tint (in contrast to those dyed with Indigofera tinctoria). The main coloring component of Tyrian purple is 6,6′-dibromindigotine (6,6′-DBIN) which can not be found in living molusc and is generated from precursors (chromogenes) present in the subcranial gland in the same way as indigo in plants. Indigo precursors are important compounds when identifying the source of the blue dye. presents the percentages of the most important blue plant and animal dyes.[Citation42,Citation51,Citation81,Citation83,Citation85–88]
Table 12. Indigo derivatives content in different dye sources.
Blue dyes—analysis with HPLC
Blue dyes used in historical dyeing belong to a small family of natural products of 8 main compounds (indigo chromophores) and 5 indigo precursors, indigo being the most well-known and the main component. The difference in chemical structures of indigoids rely mainly on the connectivity of two indole moieties.[Citation89] According to the literature data HPLC was predominantly used for analysis of these compounds ().
Table 13. Identification of blue dyes by HPLC—extraction and separation conditions.
In their pioneering work Wouters and Verhecken (1991) separated four basic chromophores of blue dyes: IND, INR, 6-MBI, 6,6-DBI in about 15 minutes. It was then that 6-MBI in M. trunculus was identified for the first time. Based on differences in content of the above four indigoids, in Murex trunculus, Murex brandaris and Thais haemastoma were characterized as dye sources.[Citation42]
Koren separated (in about 20 min) and identified up to 7 key derivatives of indigotine and indirubin using similar elution conditions as Wouters and Verhecken. The way the reference material was prepared was interesting in both works. Wouters and Verhecken used ready-to-use extracts as a reference material. Koren used a raw material—crude extract of mollusks containing colorless precursors of indigo and indorubin derivatives. The purple color was created during the dyeing process—that is, complex chemical transformations from precursors to the corresponding bromo derivatives. Therefore, the chemical profile of Koren’s samples were much “richer” than Wouters’.[Citation86]
Among nine identified compounds—indigo derivatives and precursors—Koren indicated three key compounds useful in identification of mollusks species: MBI, DBI and 6-BIS. A very interesting finding was that for a particular species of murex there was a characteristic ratio of relative concentrations of MBI and DBI. For Brandaris, that ratio (MBI/DBI) was roughly 30/70, for Haemastoma: 30/100. Neither of the species contained indirubin. Trunculus, contrary to the other species, contained significant amounts of MBI. Using LC it was possible to determine the contents of 6-BIS for the first time, which allowed to distinguish two species Brandaris and Haemastoma from Trunculus.The content of 6-BIS in Brandiris and Haemastoma is 30–40% and in Trunculus—merely a few percent. Koren put also particular attention to the influence of external factors on the content of individual components in dyed materials. Important factors included not only age and sex of the mollusks but also the conditions in which the animal lived, that is water pH, salinity and temperature.[Citation86]
Maugard et al. separated as many as 13 compounds from the extract of Isatin tinctoria in one chromatographic run (40 minutes). It was the first publication that characterized in details a selected species being a source of a blue dye. The authors also described the complicated metabolism of precursors of indigo, that had not until that moment been explained and is still a subject of research. Apart from analytical achievements, the researchers attempted to explain the variability of quantitative composition of individual components depending on external factors. This knowledge is essential for correct interpretation of the research targeted to real samples of historical objects. Among 13 chemical compounds present in Isatis tinctoria the authors chose 9 that were of paramount importance in the analysis of samples from historical objects: indigotin, indirubin, indoxyl, isatin, isatan B, isatan C, indican, isoindigo, isoindirubin. The researchers also discovered that young leaves of I. tinctoria contained not two, but three precursors of indigo: isatan B, indican and newly discovered isatan C. Isatan C can only be found in young leaves, it reacts with isatan B, which creates more red pigment. Isatis tinctoria owes its unique color due to such compounds as iso-indirubin (red), cis-indigotin (blue), iso-indigotin (brown) or the presence of flavonoids (yellow).[Citation82]
Majority of published research described the use of C18 Zorbax SB, Altima HP column, 50–250 mm in length and particle size dp of 3.0, 3.5, 5.0 and 6.0 µm. In separation of indigoid derivatives acidified MeOH/H2O or ACN/H2O phases were mostly used in gradient elution. Typical acids added to the mobile phase were phosphoric acid (UV-Vis detection) or TFA and HCOOH (MS detection).[Citation88] As reported by Nowik, using strong acids such as TFA or MSA along with the increase of the column temperature improved peak shapes (height) which positively influenced signal-to-noise ratio.[Citation88]
The key compounds present in blue dyes were characterized by specific spectroscopic properties and mass spectra. The MS detector was useful in identification of brominated derivatives of indigo, however it turned out to be of less importance when distinguishing idigotine from indorubin—these two analytes have the same mass spectrum. Due to the specificity of blue dyes, it is extremely important to combine three sources of information, namely: UV-Vis absorbance spectra, mass spectra and differences in retention. Only the analysis of these three variables may give a full characteristics of the colorant tested (see ).
Table 14. Mass spectrum pdeudo-molecular ion and UV-Vis maximum absorbance of indigo chromophores and precursors.
The first use of MS detector in research on blue dyes isolated from historical objects was performed by Puchalska et al. (see and ).[Citation83] The PCA plots showed that M. brandaris and S. haemastoma species were not separated but H. trunculus samples were slightly separated from the two other species. The authors also investigated the chemical stability of indigotin in DMSO under the influence of light at room temperature. It turned out that indigotin dissolved in DMSO was partially converted to isatine after only 7 days and completely (100% yield) after 30 days.[Citation84]
Table 15. Analytes found in Tyrian purple extracts according to Wouters, Koren and Puchalska.
The work of Karapanagiotis et al. is one of the main publications characterizing as many as seven species of animals from which the blue dye Tyrian purple was extracted. In their very interesting report they separated seven indigoid derivatives (see and ).[Citation87]
Table 16. Comparison of the results obtained by Karapanagiotis, Wouters and Koren.
Comparison of the results obtained by Karapanagiotis and those reported earlier by Wouters[Citation42] and Koren[Citation86] (see ), showed significant discrepancies. Karapanagiotis increased the number od analyzed markers by three: 6’BINR, 6MBIR, 6,6DBIR. Yet, the above did not have a significant effect on differentiation between species. The biggest obstacles were encountered by all authors when attempting to differentiate between M. brandaris and T. haemastoma. Wouters et al. differentiated them from one another based on the presence of 6-BIND, which Karapanagiotis disagreed with, according to him could not be differentiated this way, because the marker was present in both M. brandaris and T. haemastoma.[Citation87]
Nowik et al. described the influence of the type of stationary and mobile phases as well as temperature on selected peak parameters (symmetry, height, area).[Citation88] An increase of the temperature in chromatographic column resulted in higher teoretical plate count as well as resolution. They confirmed earlier results by Koren that an increase of solubility of indigoid dyes in the mobile phase (7 derivatives of indigo) increased both symmetry and height of the peaks. However, contrary to that part of Koren research, they explained that a probable cause of peak tailing was precipitation of a dye in the stationary phase—not aggregating of dyes as Koren had supposed. Increasing solubility of indigoids turned out to be essential for correct calculations of peak areas and estimation relative quantities of chromophores in a sample. When injecting relatively high concentrations of dyes into a chromatographic system it should also be possible to identify side components without the loss of the semi-quantitative approach to all sample constituents. It has been proven that the main parameters improving symmetry and height of peaks for bromine indigoids are stationary phase and column temperature, but the composition of the mobile phase or column length did not have a significant influence on the mentioned parameters. Nowik et al. tested a series of different C18 columns. Among the tested columns, the best results were achieved with Altima C18 at the temperature of 70 °C. The authors proved that optimization of chromatographic conditions may improve solubility of a sample in a mobile phase by up to 400%.[Citation88]
Difficulties in identification of blue dyes are mainly caused by their low solubility and chemical instability in solutions.[Citation83] All indigo derivatives found in natural dyes are soluble in aprotic solvents such as: pyridine, DMF and DMSO. Because of the low solubility of indigo derivatives in mobile phases, peaks were tailing, particularly 6,6-DBIN. Indigotines are significantly less soluble than indirubins while solubility of indigoid dyes decreases as the number of bromine atoms attached in 6 and 6′ positions increases. DMSO was a better solvent than DMF—in one case only slightly higher peaks were obtained using DMF than DMSO (for mono- and dibromoindigotine).[Citation87] Improvement in solubility can also be obtained by increasing the column temperature (up to max 70 °C).[Citation88]
In addition to blue dyes—indigo derivatives, there is a small group of non-indigoid plant dyes. These are Sambucus nigra (elderberry) and Hematoxylon campechianum (logwood) that Puchalska et al. mentioned in their study. Their dyeing properties are connected with the presence of such compounds as hematoxylin, hematein (logwood) or anthocyanidins and flavonoids (elderberry). Puchalska et al. separated 15 key blue dyes belonging to various groups of compounds (analysis time − 50 min). Analysis of blue non-indigo dyes is quite difficult due to the problems with their glycoside forms instability in the MS ionization source and highly reactive character of anthocyanins which are easily degraded.[Citation84]
Blue dyes—analysis with electromigration techniques
As far there has been only one example published on the identification of the blue dye using capillary electrophoresis. Lopez-Montez et al. used sodium tetraborate (40 mM, pH 9.25) as the seperation buffer and the sample solvent was 0.1 M SDS. Lack of publications in this narrow field may have two reasons: (i) very poor solubility of indigotin derivatives in typical solvents used in electromigration techniques, according to the above data they dissolve rather in DMSO, DMF and pyridine, (ii) few publications on the identification of natural indigo derivatives by means of electromigration techniques in the scientific literature; scientists devote much more attention to the synetic derivative—indigo carmine, a compound used as a colorant in food, rather than to a natural derivative currently very limited in use. It should be emphasized that indigo carmine is a polar compound that dissolves in most aqueous solvents in contrast to indigotin and its derivatives.[Citation45]
Full profile of dyes extracted from hstoric samples
The key to obtaining a full profile of the original sample is the proper selection of extraction conditions. This is not easy due to the different mechanisms of connecting the dye with the historic matrix (usually textile) and aging effects of original sample .
The explanation of the dyeing mechanism is made by the authors in separate publications.[Citation31,Citation35,Citation55,Citation57] They pay attention to the impact of environmental factors on the durability of dyeing (dyeing raw material, the age of the plant or animals, dyeing bath temperature, type of textile, additives, fixatives).[Citation39,Citation90] Classical extraction methods based on strong acids effectively extract most of the historical dyes such as anthraquinones, flavonoids, hydroxy acids, crocin, crocetin, curcumin.[Citation11,Citation33,Citation36,Citation58] Unfortunately, vat dyes (e.g., indigoid) are resistant to acids, they dissolve only in strong alkaline pyridine solutions and DMF, DMSO aprotic solvents.[Citation9,Citation91] In addition to aglycons in the historical micro-samples precursors of antraquinones and flavonoids dyes are present. The possibility to extract them intact would considerably improve the information quality on the original sample. Unfortunately, extraction with a strong acid transforms dye precursors into their corresponding aglycons. Only a few acids are able to successfully extract research material without destroying the precursors. These are: oxalic acid,[Citation1,Citation12,Citation16] formic acid,[Citation49,Citation63,Citation92] EDTA,[Citation27] trifluoroacetic acid,[Citation53] citric acid and HF.[Citation61,Citation91]
Vallianou et al. in their excellent review article discussed the extraction methods very exhaustively.[Citation11] However, the set of isolation techniques should be extended to include two-step extraction methods.[Citation32,Citation34,Citation54,Citation67,Citation68] In the case when the object contains mixed dyes, during acidic extraction anthraquinone and flavonoid dyes are extracted first, and only in the second step (extraction with DMSO, DMF or pyridine) indigotin dyes can be.[Citation32,Citation34,Citation67] According to Puchalska, the addition of DMF to the extraction mixture (in the first step of the extraction) improved efficiency of most dyes except carminic derivatives; in this case, carminic acid derivatives were more efficiently isolated using only acidified methanol.[Citation67] Lech et al. used a different composition of the two-stage extraction mixture—the sample (textile fiber) was first treated with formic acid followed by hydrochloric acid which in result provided more information than a one-stage procedure.[Citation68] The first step allowed for isolation of glycosides, while the second one—aglycones, but with higher yield. The developed method was successfully applied to the identification of indigotin, carminic, kermesic, flavokermesic, dcII, dcIV, dcVII, and ellagic acids as well as luteolin, apigenin, andgenistein in historical chasubles.[Citation68]
At present, dual detection system (UV–Vis and ESI-MS) allows for differentiation of all compounds, even if they were not completely separated.[Citation13,Citation17,Citation31,Citation33,Citation40,Citation43,Citation61,Citation68] Lech et al. used HPLC–UV-Vis/ESI-MS for identification of 29 colorants of various polarities.[Citation68] Generally, ESI negative ionization (-) works best for flavonoid aglycons, the vast majority of anthraquinones, flavonoids, hydroxy acids, positive ESI (+) ionization and APCI (+)—indigo derivatives, APCI (-)[Citation17,Citation43,Citation46,Citation68,Citation74] derivatives carmine coffin, MRM—works well in the identification of hydroxy acids (hydroxy acids do not have the characteristic UV-VIS spectra).[Citation17] In electromigration techniques, due to the low flow rate, connection to the MS detector is not a problem. Negative ion ionization in ESI mode allowed for simultaneous analysis of flavonoids, anthraquinones and hydroxy acids ().[Citation46]
Figure 12. Extracted ion electropherograms in CE-DAD-MS analysis of mixture of the analyzed compounds (concentration of each 50 lM) in the optimum BGE conditions (pH 9.5, 40 mM ammonium acetate, 40% ACN); 1–rhamnetin, 2–quercetin, 3–apigenin, 4– luteolin, 5–emodin, 6– xanthopurpurin, 7–morin, 8–alizarin, 9–gallic acid, 10–purpurin, 11– carminic acid; separation conditions: capillary voltage, +25 kV; temperature, 25 °C; hydrodynamic injection, 25 mbar during 10 s; capillary, id 50 μm, od 375 μm, 75.0 cm total length, 20.0 cm to the DAD; sheath liquid flow-rate (MeOH/H2O, 1:1, v/v) 5 μL/min.[Citation46]
![Figure 12. Extracted ion electropherograms in CE-DAD-MS analysis of mixture of the analyzed compounds (concentration of each 50 lM) in the optimum BGE conditions (pH 9.5, 40 mM ammonium acetate, 40% ACN); 1–rhamnetin, 2–quercetin, 3–apigenin, 4– luteolin, 5–emodin, 6– xanthopurpurin, 7–morin, 8–alizarin, 9–gallic acid, 10–purpurin, 11– carminic acid; separation conditions: capillary voltage, +25 kV; temperature, 25 °C; hydrodynamic injection, 25 mbar during 10 s; capillary, id 50 μm, od 375 μm, 75.0 cm total length, 20.0 cm to the DAD; sheath liquid flow-rate (MeOH/H2O, 1:1, v/v) 5 μL/min.[Citation46]](/cms/asset/b0b860c0-8e11-424e-bbeb-3003cf01c8c8/batc_a_1743640_f0012_b.jpg)
As reported by Serrano et al. a significant improvement in resolution could be obtained when using UHPLC BEH Shield columns, which produced chromatograms with improved resolution and peak capacity, displaying an increase of up to 61% in plate number and an improvement of up to 422% for limit of detection and limit of quantification for the majority of the dye compounds, when compared to the results achieved with a conventional method (HPLC Luna column), using the same analytical equipment ().[Citation30]
Figure 13. Comparison of the analytical results for the mixture of dyestuff references (A and B), the mixture of insect dyes (C and D), and the madder (E and F) and the weld dye extracts (G and H), using the UHPLC optimized method (BEH Shield column) and the HPLC method (Luna column).[Citation30]
![Figure 13. Comparison of the analytical results for the mixture of dyestuff references (A and B), the mixture of insect dyes (C and D), and the madder (E and F) and the weld dye extracts (G and H), using the UHPLC optimized method (BEH Shield column) and the HPLC method (Luna column).[Citation30]](/cms/asset/16eea260-6574-41a8-8a97-012d8496cc89/batc_a_1743640_f0013_b.jpg)
summarizes only those publications in which the authors attempted to separate dyes belonging to at least three different chemical classes in one analytical run. The identified dyes were divided into 7 chemical classes: 1. anthraquinones, 2. flavonoids, 3. hydroxy acids, 4. indigo, 5. hematein derivatives (brazilin, hematein), 6. curcumin, 7. carotenoid (crocin and crocetin).
Table 17. Identification of dyes belonging to diffrerent classes in historical objects.
Concluding remarks and future perspectives
There is no doubt that it is the liquid chromatography that has been exhaustively developed in the studies on natural dyes that can be found in historical objects. Although it seems that coupling of UHPLC with mass spectrometers solves most of the analytical problems there is, in our opinion, some room to further interesting research. The electromigration techniques have also marked their potential in this field. Besides the importance of the sample solvent which, as it was discussed, plays very often a crucial role in capillary electrophoretic analysis, the electromigration techniques are in general less sensitive to the sample preparation as there is no possibility of stationary phase contamination.
Extracts of plant dyes used in works of art contain mainly derivatives of anthraquinones and flavonoids. So far, only two electromigration techniques have been used to analyze plant dyes found in historic objects: CE[Citation45,Citation46,Citation50,Citation75] and MEKC.[Citation47–49] A significant limitation of both methods is that they are based on aqueous buffers, sometimes modified by addition of relatively small amounts of organic solvents. Based on the literature data, however, it can be assumed that very promising results could be obtained using two other electromigration techniques—capillary electrochromatography (CEC)[Citation92–98] and non-aqueous capillary electrophoresis (NACE).[Citation99–102] Both methods were used to identify the composition of plant raw materials used in the field of pharmaceuticals and traditional medicine. Capillary electrochromatography is a separation technique that can be regarded as a hybrid of capillary electrophoresis and liquid chromatography. In CEC the separation is performed in a capillary column filled with a HPLC stationary phase (either particulate based or monolithic) while the electroosmotic flow is used to push the mobile phase across the column. The most important advantage of CEC over HPLC arises from the flat flow profile of EOF which make the separations much more efficient than in HPLC where the pressure induced flow profile is parabolic. On the other hand, NACE employs pure organic solvents so some solubility-based issues could be overcome. Hence, based on the literature survey, some useful conclusions can be drawn:
To the best of our knowledge CEC and NACE were not directly used to separate natural dyes that can be found in monuments and old works of art.
Many of the key dyes found in historic also play an important role in pharmacy as biomedical compounds (Lut, Gen, Kae, Api, Que) and in the food industry as food dyes and spices (cochineal, turmeric, saffron).
Most of the NACE and CEC tested plant extracts have medical applications. The analyzed compounds are considered as bioactive substances.
However, based on several publications that can be found it might be concluded that there is a room for interesting research in this field. For example, with regard to the red dyes, structurally similar antraquinone compounds (namely rhein, aloe-emodin, emodin, chrysophanol and physcoin) or flavonoids (Kae, Api, Que) were extracted among others from rhubarb and chinese tea and separated by CEC or NACE.[Citation94,Citation96,Citation98,Citation101,Citation102]
In the case of NACE, the use of ionic liquids as a separation buffer and sample solvent (separation of such compounds as Kae, Que, Api) deserves attention.[Citation101] Also noteworthy is the group of publications in which methanolic or MeOH/ACN solution of sodium cholate together with the addition of organic acids was used to separate flavonoids or anthraquinones.[Citation99,Citation100,Citation102] The use of a non-aqueous mobile phase is advantageous for the analysis of hydrophobic or water insoluble (or poorly soluble) compounds, which are the majority of flavonoids or anthraquinones. It is promising to use DMSO as a sample diluent. It is the only universal solvent.
Using CEC it was possible to separate derivatives of both flavonoids and anthraquinones found in plant raw materials such as rhubarb,[Citation94–96] black and green tea,[Citation98] and exotic plants such as Shiyacha.[Citation92] Among the analyzed compounds were, for example, Api, Quer, Rut, Gen, Kae, Emo—compounds of key importance in identifying yellow and red dyes. Very high sensitivities of several dozen nanograms per milliliter were obtained using CEC.[Citation92,Citation96] This might be a very good starting point for the development of a method for analyzing dyes found in historic objects, where small sample size and sensitivity are one of the most important criteria for analytical method selection.
In the case of CEC and pCEC (pressurized CEC) both packed silica particulate-based as well as monolithic columns can be used. Particularly monolithic polymeric stationary phases hold a great potential. The existing examples demonstrated (i) the use of poly(butyl methacrylate-co-ethylene glycol dimethacrylate) monolithic column to separate to separate epicatechin, camellianin A, rhoifolin, camellianin B and apigenin and (ii) using (polyLMA-co-EDMA) it was possible to effectively separate rutin, quercitrin, quercetin and kaempferol within 7 min.[Citation92,Citation93,Citation96,Citation97]
To conclude, there exist some further analytical possibilities in the field of identification of natural dyes in historic objects. In our opinion, the great potential is in the above mentioned CEC and NACE, however the use of the latter technique might be in some way limited when it comes to NACE/MS coupling if MS incompatible additives were used.
References
- Santos, R.; Hallett, J.; Oliveira, M. C.; Sousa, M. M.; Sarraguça, J.; Simmonds, M. S. J.; Nesbitt, M. HPLC-DAD-MS Analysis of Colorant and Resinous Components of Lac-Dye: A Comparison between Kerria and Paratachardina Genera. Dyes Pigm. 2015, 118, 129–136. DOI: 10.1016/j.dyepig.2015.02.024.
- de Graaff, J. H. H.; Roelofs, W. G. T.; van Bommel, M. R. The Colourful Past: Origins, Chemistry and Identification of Natural Dyestuffs; Archetype: UK, 2004.
- Cardon, D. Natural Dyes: Sources, Tradition, Technology and Science; Archetype: UK, 2007.
- Wouters, J. High Performance Liquid Chromatography of Anthraquinones: Analysis of Plant and Insect Extracts and Dyed Textiles. Stud. Conserv. 1985, 30, 119–128. DOI: 10.2307/1505927.
- Wouters, J.; Verhecken, A. The Coccid Insect Dyes: HPLC and Computerized Diode Array Analysis of Dyed Yarns. Stud. Conserv. 1989, 34, 189–200. DOI: 10.1179/sic1989.34.4.189. DOI: 10.1179/sic.1989.34.4.189.
- Halpine, S. M. An Improved Dye and Lake Pigment Analysis Method Using High-Performance Liquid Chromatography and Diode-Array Detector. Stud. Conserv. 1996, 41, 76–94. DOI: 10.2307/1506519.
- Ferreira, E. S. B.; Hulme, A. N.; McNab, H.; Quye, A. The Natural Constituents of Historical Textile Dyes. Chem. Soc. Rev. 2004, 33, 329–336. DOI: 10.1039/b305697j.
- Zadrożna, I.; Pawlak, K.; Głuch, I.; Ackacha, M.; Mojski, M.; Witowska-Jarosz, J.; Jarosz, M. Old Master Paintings—a Fruitful Field of Activity for Analysts: Targets, Methods, Outlook. J. Sep. Sci. 2003, 26, 996–1004. DOI: 10.1002/jssc.200301483.
- Rosenberg, E. Characterisation of Historical Organic Dyestuffs by Liquid Chromatography–Mass Spectrometry. Anal. Bioanal. Chem. 2008, 391, 33–57. DOI: 10.1007/s00216-008-1977-0.
- Pauk, V.; Barták, P.; Lemr, K. Characterization of Natural Organic Colorants in Historical and Art Objects by High-Performance Liquid Chromatography. J. Sep. Sci. 2014, 37, 3393–3410. DOI: 10.1002/jssc.201400650..
- Valianou, L.; Karapanagiotis, I.; Chryssoulakis, Y. Comparison of Extraction Methods for the Analysis of Natural Dyes in Historical Textiles by High-Performance Liquid Chromatography. Anal. Bioanal. Chem. 2009, 395, 2175–2189. DOI: 10.1007/s00216-009-3137-6.
- Serrano, A.; Sousa, M. M.; Hallett, J.; Lopes, J. A.; Oliveira, M. C. Analysis of Natural Red Dyes (Cochineal) in Textiles of Historical Importance Using HPLC and Multivariate Data Analysis. Anal. Bioanal. Chem. 2011, 401, 735–743. DOI: 10.1007/s00216-011-5094-0.
- Lech, K.; Jarosz, M. Identification of Polish Cochineal (Porphyrophora Polonica L.) in Historical Textiles by High-Performance Liquid Chromatography Coupled with Spectrophotometric and Tandem Mass Spectrometric Detection. Anal. Bioanal. Chem. 2016, 408, 3349–3358. DOI: 10.1007/s00216-016-9408-0.
- Nowik, W.; Bonose-Crosnier de Bellaistre, M.; Tchapla, A.; Héron, S. Separation of 9,10-Anthraquinone Derivatives: Evaluation of Functionalised Stationary Phases in Reversed Phase Mode. J. Chromatogr. A 2011, 1218, 3636–3647. DOI: 10.1016/j.chroma.2011.04.012.
- Bonose-Crosnier de Bellaistre, M.; Nowik, W.; Tchapla, A.; Heron, S. Separation of 9,10-Anthraquinone Derivatives: Evaluation of C18 Stationary Phases. J. Chromatogr. A 2011, 1218, 778–786. DOI: 10.1016/j.chroma.2010.12.032.
- Mouri, C.; Laursen, R. Identification of Anthraquinone Markers for Distinguishing Rubia Species in Madder-Dyed Textiles by HPLC. Microchim. Acta 2012, 179, 105–113. DOI: 10.1007/s00604-012-0868-4.
- Surowiec, I.; Szostek, B.; Trojanowicz, M. HPLC‐MS of Anthraquinoids, Flavonoids, and Their Degradation Products in Analysis of Natural Dyes in Archeological Objects. J. Sep. Sci. 2007, 30, 2070–2079. DOI: 10.1002/jssc.200700041.
- Sanyova, J.; Reisse, J. Development of a Mild Method for the Extraction of Anthraquinones from Their Aluminum Complexes in Madder Lakes Prior to HPLC Analysis. J. Cult. Heritage 2006, 7, 229–235. DOI: 10.1016/j.culher.2006.06.003.
- Wouters, J.; Rosario-Chirinos, N. Dye Analysis of Pre-Columbian Peruvian Tetiles with High Performance Liquid Chromtography and Diode Array Detection. J. Am. Inst. Conserv. 1992, 31, 237–255. DOI: 10.1179/019713692806066637.
- Novotná, P.; Pacáková, V.; Bosáková, Z.; Štulı́k, K. High-Performance Liquid Chromatographic Determination of Some Anthraquinone and Naphthoquinone Dyes Occurring in Historical Textiles. J. Chromatogr. A 1999, 863, 235–241. DOI: 10.1016/S0021-9673(99)00980-2.
- Ackacha, M.; Pawlak, K.; Jarosz, M. Identification of Anthraquinone Coloring Matters in Natural Red Dyestuffs by High Performance Liquid Chromatography with Ultraviolet and Electrospray Mass Spectrometric Detection. J. Sep. Sci. 2003, 26, 1028–1034. 10. 1002/jssc.200301484. DOI: 10.1002/jssc.200301484.
- Angelini, L. G.; Pistelli, L.; Belloni, P.; Bertoli, A.; Panconesi, S. Rubia Tinctorum a Source of Natural Dyes: agronomic Evaluation, Quantitative Analysis of Alizarin and Industrial Assays. Ind. Crops Prod. 1997, 6, 303–311. DOI: 10.1016/S0926-6690(97)00021-6.
- Gupta, D.; Bleakley, B.; Gupta, R. K. Dragon’s Blood: Botany, Chemistry and Therapeutic Uses. J. Ethnopharmacol. 2008, 115, 361–380. DOI: 10.1016/j.jep.2007.10.018.
- Jura-Morawiec, J.; Tulik, M. Dragon’s Blood Secretion and Its Ecological Significance. Chemoecology 2016, 26, 101–105. DOI: 10.1007/s00049-016-0212-2.
- Sousa, M. M.; Melo, M. J.; Parola, A. J.; Seixas de Melo, J. S.; Catarino, F.; Pina, F.; Cook, F. E. M.; Simmonds, M. S. J.; Lopes, J. A. Flavylium Chromophores as Species Markers for Dragon’s Blood Resins from Dracaena and Daemonorops Trees. J. Chromatogr. A 2008, 1209, 153–161. DOI: 10.1016/j.chroma.2008.09.007.
- Surowiec, I.; Nowik, W.; Trojanowicz, M. Identification of “Insoluble” Red Dyewoods by High Performance Liquid Chromatography–Photodiode Array Detection (HPLC-PDA) Fingerprinting. J. Sep. Sci. 2004, 27, 209–216. DOI: 10.1002/jssc.200301612.
- Manhita, A.; Ferreira, T.; Candeias, A.; Barrocas Dias, C. Extracting Natural Dyes from Wool—an Evaluation of Extraction Methods. Anal. Bioanal. Chem. 2011, 400, 1501–1514. DOI: 10.1007/s00216-011-4858-x.
- Dapson, R.; Bain, C. Brazilwood, Sappanwood, Brazilin and the Red Dye Brazilein: From Textile Dyeing and Folk Medicine to Biological Staining and Musical Instruments. Biotech. Histochem. 2015, 90, 401–423. DOI: 10.3109/10520295.2015.1021381.
- Blanc, R.; Espejo, T.; López-Montes, A.; Torres, D.; Crovetto, G.; Navalón, A.; Vílchez, J. L. Sampling and Identification of Natural Dyes in Historical Maps and Drawings by Liquid Chromatography with Diode-Array Detection. J. Chromatogr. A 2006, 1122, 105–113. DOI: 10.1016/j.chroma.2006.04.056.
- Serrano, A.; van Bommel, M.; Hallett, J. Evaluation between Ultrahigh Pressure Liquid Chromatography and High-Performance Liquid Chromatography Analytical Methods for Characterizing Natural Dyestuffs. J. Chromatogr. A 2013, 1318, 102–111. DOI: 10.1016/j.chroma.2013.09.062.
- Degano, I.; Biesaga, M.; Colombini, M. P.; Trojanowicz, M. Historical and Archaeological Textiles: An Insight on Degradation Products of Wool and Silk Yarns. J. Chromatogr. A 2011, 1218, 5837–5847. DOI: 10.1016/j.chroma.2011.06.095.
- Orska-Gawryś, J.; Surowiec, I.; Kehl, J.; Rejniak, H.; Urbaniak-Walczak, K.; Trojanowicz, M. Identification of Natural Dyes in Archeological Coptic Textiles by Liquid Chromatography with Diode Array Detection. J. Chromatogr. A 2003, 989, 239–248. DOI: 10.1016/S0021-9673(03)00083-9.
- Petroviciu, I.; Albu, F.; Medvedovici, A. LC/MS and LC/MS/MS Based Protocol for Identification of Dyes in Historic Textiles. Microchem. J. 2010, 95, 247–254. DOI: 10.1016/j.microc.2009.12.009.
- Petroviciu, I.; Vanden Berghe, I.; Cretu, I.; Albu, F.; Medvedovici, A. Identification of Natural Dyes in Historical Textiles from Romanian Collections by LC-DAD and LC-MS (Single Stage and Tandem MS). J. Cult. Heritage 2012, 13, 89–97. DOI: 10.1016/j.culher.2011.05.004.
- Clementi, C.; Nowik, W.; Romani, A.; Cibin, F.; Favaro, G. A Spectrometric and Chromatographic Approach to the Study of Ageing of Madder (Rubia Tinctorum L.) Dyestuff on Wool. Anal. Chim. Acta 2007, 596, 46–54. DOI: 10.1016/j.aca.2007.05.036.
- Peggie, A. D.; Hulme, N. A.; McNab, H.; Quye, A. Towards the Identification of Characteristic Minor Components from Textiles Dyed with Weld (Reseda Luteola L.) and Those Dyed with Mexican Cochineal (Dactylopius Coccus Costa). Microchim. Acta 2008, 162, 371–380. DOI: 10.1007/s00604-007-0866-0.
- Stathopoulou, K.; Valianou, L.; Skaltsounis, A.-L.; Karapanagiotis, I.; Magiatis, P. Structure Elucidation and Chromatographic Identification of Anthraquinone Components of Cochineal (Dactylopius Coccus) Detected in Historical Objects. Anal. Chim. Acta 2013, 804, 264–272. DOI: 10.1016/j.aca.2013.09.053.
- Niemeyer, H. M.; Agüero, C. Dyes Used in pre-Hispanic Textiles from the Middle and Late Intermediate Periods of San Pedro de Atacama (Northern Chile): New Insights into Patterns of Exchange and Mobility. J. Archaeolog. Sci. 2015, 57, 14–23. DOI: 10.1016/j.jas.2015.02.003.
- Serrano, A.; van den Doel, A.; van Bommel, M.; Hallett, J.; Joosten, I.; van den Berg, K. J. Investigation of Crimson-Dyed Fibres for a New Approach on the Characterization of Cochineal and Kermes Dyes in Historical Textiles. Anal. Chim. Acta 2015, 897, 116–127. DOI: 10.1016/j.aca.2015.09.046.
- Lech, K.; Witkoś, K.; Wileńska, B.; Jarosz, M. Identification of Unknown Colorants in pre-Columbian Textiles Dyed with American Cochineal (Dactylopius Coccus Costa) Using High-Performance Liquid Chromatography and Tandem Mass Spectrometry. Anal. Bioanal. Chem. 2015, 407, 855–867. DOI: 10.1007/s00216-014-8107-y.
- Trojanowicz, M.; Orska-Gawryś, J.; Surowiec, I.; Szostek, B.; Urbaniak-Walczak, K.; Kehl, J.; Wróbel, M. Chromatographic Investigation of Dyes Extracted from Coptic Textiles from the National Museum in Warsaw. Stud. Conserv. 2004, 49, 115–130. DOI: 10.1179/sic.2004.49.2.115.
- Wouters, J.; Verhecken, A. High-Performance Liquid Chromatography of Blue and Purple Indigoid Natural Dyes. J. Soc. Dyers Colour. 2008, 107, 266–269. DOI: 10.1111/j.1478-4408.1991.tb01351.x.
- Szostek, B.; Orska-Gawrys, J.; Surowiec, I.; Trojanowicz, M. Investigation of Natural Dyes Occurring in Historical Coptic Textiles by High-Performance Liquid Chromatography with UV–Vis and Mass Spectrometric Detection. J. Chromatogr. A 2003, 1012, 179–192. DOI: 10.1016/S0021-9673(03)01170-1.
- Puchalska, M.; Orlińska, M.; Ackacha, M. A.; Połeć-Pawlak, K.; Jarosz, M. Identification of Anthraquinone Coloring Matters in Natural Red Dyes by Electrospray Mass Spectrometry Coupled to Capillary Electrophoresis. J. Mass Spectrom. 2003, 38, 1252–1258. DOI: 10.1002/jms.549.
- López-Montes, A.; Blanc García, R.; Espejo, T.; Huertas-Perez, J. F.; Navalón, A.; Vílchez, J. L. Simultaneous Identification of Natural Dyes in the Collection of Drawings and Maps from the Royal Chancellery Archives in Granada (Spain) by CE. Electrophoresis. 2007, 28, 1243–1251. DOI: 10.1002/elps.200600446.
- Surowiec, I.; Pawelec, K.; Rezeli, M.; Kilar, F.; Trojanowicz, M. Capillary Electrophoretic Determination of Main Components of Natural Dyes with MS Detection. J. Sep. Sci. 2008, 31, 2457–2462. DOI: 10.1002/jssc.200800032.
- Ahmadi, S.; Absalan, G.; Craig, D.; Goltz, D. Photochemical Properties of Purpurin and Its Implications for Capillary Electrophoresis with Laser Induced Fluorescence Detection. Dyes Pigm. 2014, 105, 57–62. DOI: 10.1016/j.dyepig.2013.12.011.
- Ahmadi, S.; Craig, D.; Goltz, D. Micellar Electrokinetic Chromatography with Laser-Induced Fluorescence Detection for Separation of Red and Yellow Historical Dyes. Chromatography 2013, 1, 9–23. DOI: 10.3390/chromatography1010009.
- Maguregui, M. I.; Alonso, R. M.; Barandiaran, M.; Jimenez, R. M.; García, N. Micellar Electrokinetic Chromatography Method for the Determination of Several Natural Red Dyestuff and Lake Pigments Used in Art Work. J. Chromatogr. A 2007, 1154, 429–436. DOI: 10.1016/j.chroma.2007.03.089.
- Trojanowicz, M. W.; Lena, W.; Urbaniak-Walczak, K. Identification of Natural Dyes in Historical Coptic Textiles by Capillary Electrophoresis with Diode Array Detection. Chem. Anal. (Warsaw) 2003, 48, 607–620.
- Liang, H. R.; Sirén, H.; Riekkola, M. L.; Vuorela, P.; Vuorela, H.; Hiltunen, R. Optimized Separation of Pharmacologically Active Flavonoids from Epimedium Species by Capillary Electrophoresis. J. Chromatogr. A 1996, 746, 123–129. DOI: 10.1016/0021-9673(96)00287-7.
- Zhang, X.; Boytner, R.; Cabrera, J. L.; Laursen, R. Identification of Yellow Dye Types in Pre-Columbian Andean Textiles. Anal. Chem. 2007, 79, 1575–1582. DOI: 10.1021/ac061618f.
- Valianou, L.; Stathopoulou, K.; Karapanagiotis, I.; Magiatis, P.; Pavlidou, E.; Skaltsounis, A.-L.; Chryssoulakis, Y. Phytochemical Analysis of Young Fustic (Cotinus Coggygria Heartwood) and Identification of Isolated Colourants in Historical Textiles. Anal. Bioanal. Chem. 2009, 394, 871–882. DOI: 10.1007/s00216-009-2767-z.
- Lech, K.; Witkoś, K.; Jarosz, M. HPLC–UV–ESI MS/MS Identification of the Color Constituents of Sawwort (Serratula Tinctoria L.). Anal. Bioanal. Chem. 2014, 406, 3703–3708. DOI: 10.1007/s00216-013-7589-3.
- Troalen, L. G.; Phillips, A. S.; Peggie, D. A.; Barran, P. E.; Hulme, A. N. Historical Textile Dyeing with Genista Tinctoria L.: a Comprehensive Study by UPLC-MS/MS Analysis. Anal. Methods 2014, 6, 8915–8923. DOI: 10.1039/C4AY01509F.
- Nowik, W. HPLC-PDA Characterisation of Daphne Gnidium L. (Thymemeacea) Dyeing Extracts Using Two Different C-18 Stationary Phases. J. Sep. Sci. 2005, 28, 1595–1600. DOI: 10.1002/jssc.200401770.
- Mouri, C.; Mozaffarian, V.; Zhang, X.; Laursen, R. Characterization of Flavonols in Plants Used for Textile Dyeing and the Significance of Flavonol Conjugates. Dyes Pigments 2014, 100, 135–141. DOI: 10.1016/j.dyepig.2013.08.025.
- Colombini, M. P.; Andreotti, A.; Baraldi, C.; Degano, I.; Łucejko, J. J. Colour Fading in Textiles: A Model Study on the Decomposition of Natural Dyes. Microchem. J. 2007, 85, 174–182. DOI: 10.1016/j.microc.2006.04.002.
- Han, J.; Wanrooij, J.; van Bommel, M.; Quye, A. Characterisation of Chemical Components for Identifying Historical Chinese Textile Dyes by Ultra High Performance Liquid Chromatography—Photodiode Array—Electrospray Ionisation Mass Spectrometer. J. Chromatogr. A 2017, 1479, 87–96. DOI: 10.1016/j.chroma.2016.11.044.
- Zhang, X.; Laursen, R. A. Development of Mild Extraction Methods for the Analysis of Natural Dyes in Textiles of Historical Interest Using LC-Diode Array Detector-MS. Anal. Chem. 2005, 77, 2022–2025. DOI: 10.1021/ac048380k.
- Wouters, J.; Grzywacz, C. M.; Claro, A. A Comparative Investigation of Hydrolysis Methods to Analyze Natural Organic Dyes by HPLC-PDA Nine Methods, Twelve Biological Sources, Ten Dye Classes, Dyed Yarns, Pigments and Paints. Stud. Conserv. 2011, 56, 231–249. DOI: 10.1179/204705811X13110713013353.
- Marques, R.; Sousa, M. M.; Oliveira, M. C.; Melo, M. J. Characterization of Weld (Reseda Luteola L.) and Spurge Flax (Daphne Gnidium L.) by High-Performance Liquid Chromatography–Diode Array Detection–Mass Spectrometry in Arraiolos Historical Textiles. J. Chromatogr. A 2009, 1216, 1395–1402. DOI: 10.1016/j.chroma.2008.12.083.
- Zhang, X.; Laursen, R. Application of LC–MS to the Analysis of Dyes in Objects of Historical Interest. Int. J. Mass Spectrom 2009, 284, 108–114. DOI: 10.1016/j.ijms.2008.07.014.
- Zhang, X.; Mouri, C.; Mikage, M.; Laursen, R. Preliminary Studies toward Identification of Sources of Protoberberine Alkaloids Used as Yellow Dyes in Asian Objects of Historical Interest. Stud. Conserv. 2010, 55, 4, 177–185. DOI: 10.1179/sic.2010.55.3.177.
- Mantzouris, D.; Karapanagiotis, I.; Panayiotou, C. Comparison of Extraction Methods for the Analysis of Indigofera Tinctoria and Carthamus Tinctorius in Textiles by High Performance Liquid Chromatography. Microchem. J. 2014, 115, 78–86. DOI: 10.1016/j.microc.2014.02.010.
- Petroviciu, I.; Creţu, I.; Berghe, I. V.; Wouters, J.; Medvedovici, A.; Albu, F. Flavonoid Dyes Detected in Historical Textiles from Romanian Collections. In Sixth International Meeting of the Users’Group for Mass Spectrometry and Chromatography (MASC); Pisa, Italy, 2013; pp 84–90.
- Surowiec, I.; Quye, A.; Trojanowicz, M. Liquid Chromatography Determination of Natural Dyes in Extracts from Historical Scottish Textiles Excavated from Peat Bogs. J. Chromatogr. A 2006, 1112, 209–217. DOI: 10.1016/j.chroma.2005.11.019.
- Lech, K.; Jarosz, M. Novel Methodology for the Extraction and Identification of Natural Dyestuffs in Historical Textiles by HPLC–UV–Vis–ESI MS. Case Study: chasubles from the Wawel Cathedral Collection. Anal. Bioanal. Chem. 2011, 399, 3241–3251. DOI: 10.1007/s00216-010-4591-x.
- Szumski, M.; Buszewski, B. State of the Art in Miniaturized Separation Techniques. Crit. Rev. Anal. Chem. 2002, 32, 1–46. DOI: 10.1080/10408340290765434.
- Halpine, S. M. An Improved Dye and Lake Pigment Analysis Method Using High Performance Liquid Chromatography and Diode-Array Detector. Stud. Conserv. 1996, 41, 76–94. DOI: 10.2307/1506519.
- Karapanagiotis, I.; Lakka, A.; Valianou, L.; Chryssoulakis, Y. High-Performance Liquid Chromatographic Determination of Colouring Matters in Historical Garments from the Holy Mountain of Athos. Microchim. Acta 2008, 160, 477–483. DOI: 10.1007/s00604-007-0774-4.
- Zhang, X.; Cardon, D.; Cabrera, J. L.; Laursen, R. The Role of Glycosides in the Light-Stabilization of 3-Hydroxyflavone (Flavonol) Dyes as Revealed by HPLC. Microchim. Acta 2010, 169, 327–334. DOI: 10.1007/s00604-010-0361-x.
- Ferreira, E.; Quye, A.; McNab, H.; Hulme, A. Photo-oxidation Products of Quercetin and Morin as Markers for the Characterisation of natural Yellow Dyes in Ancient Textiles. Dyes History Archaeol 1999, 18, 63–72.
- Mantzouris, D.; Karapanagiotis, I.; Valianou, L.; Panayiotou, C. HPLC–DAD–MS Analysis of Dyes Identified in Textiles from Mount Athos. Anal. Bioanal. Chem. 2011, 399, 3065–3079. DOI: 10.1007/s00216-011-4665-4.
- López-Montes, A.; Blanc, R.; Espejo, T.; Navalón, A.; Vílchez, J. L. Characterization of Sepia Ink in Ancient Graphic Documents by Capillary Electrophoresis. Microchem. J. 2009, 93, 121–126. DOI: 10.1016/j.microc.2009.05.008.
- Rodrı́guez-Delgado, M. A.; Pérez, M. L.; Corbella, R.; González, G.; and.; Garcı́a Montelongo, F. J. ; Optimization of the Separation of Phenolic Compounds by Micellar Electrokinetic Capillary Chromatography. J. Chromatogr. A 2000, 871, 427–438. DOI: 10.1016/S0021-9673(99)00883-3.
- Hancu, G.; Simon, B.; Rusu, A.; Mircia, E.; Gyéresi, A. Principles of Micellar Electrokinetic Capillary Chromatography Applied in Pharmaceutical Analysis. Adv. Pharm. Bull. 2013, 3, 1–8. DOI: 10.5681/apb.2013.001.
- Herrero‐Martínez, J. M.; Oumada, F. Z.; Rosés, M.; Bosch, E.; Ràfols, C. Determination of Flavonoid Aglycones in Several Food Samples by Mixed Micellar Electrokinetic Chromatography. J. Sep. Sci. 2007, 30, 2493–2500. DOI: 10.1002/jssc.200700124.
- Volpi, N. Separation of Flavonoids and Phenolic Acids from Propolis by Capillary Zone Electrophoresis. Electrophoresis. 2004, 25, 1872–1878. DOI: 10.1002/elps.200405949.
- Głowacki, R.; Furmaniak, P.; Kubalczyk, P.; Borowczyk, K. Determination of Total Apigenin in Herbs by Micellar Electrokinetic Chromatography with UV Detection. J. Anal. Methods Chem. 2016, 2016, 1–8. DOI: 10.1155/2016/3827832.
- Wang, S.-P.; Huang, K.-J. Determination of Flavonoids by High-Performance Liquid Chromatography and Capillary Electrophoresis. J. Chromatogr. A 2004, 1032, 273–279. DOI: 10.1016/j.chroma.2003.11.099.
- Witkoś, K.; Lech, K.; Jarosz, M. Identification of Degradation Products of Indigoids by Tandem Mass Spectrometry. J. Mass Spectrom. 2015, 50, 1245–1251. DOI: 10.1002/jms.3641.
- Maugard, T.; Enaud, E.; Choisy, P.; Legoy, M. D. Identification of an Indigo Precursor from Leaves of Isatis Tinctoria (Woad). Phytochemistry 2001, 58, 897–904. DOI: 10.1016/S0031-9422(01)00335-1.
- Puchalska, M.; Połeć-Pawlak, K.; Zadrożna, I.; Hryszko, H.; Jarosz, M. Identification of Indigoid Dyes in Natural Organic Pigments Used in Historical Art Objects by High-Performance Liquid Chromatography Coupled to Electrospray Ionization Mass Spectrometry. J. Mass Spectrom. 2004, 39, 1441–1449. DOI: 10.1002/jms.728.
- Pawlak, K.; Puchalska, M.; Miszczak, A.; Rosłoniec, E.; Jarosz, M. Blue Natural Organic Dyestuffs—from Textile Dyeing to Mural Painting. Separation and Characterization of Coloring Matters Present in Elderberry, Logwood and Indigo. J. Mass Spectrom. 2006, 41, 613–622. DOI: 10.1002/jms.1018.
- Karapanagiotis, I.; de Villemereuil, V.; Magiatis, P.; Polychronopoulos, P.; Vougogiannopoulou, K.; Skaltsounis, A. L. Identification of the Coloring Constituents of Four Natural Indigoid Dyes. J Liq Chromatogr R T 2006, 29, 1491–1502. DOI: 10.1080/10826070600674935.
- Koren, Z. C. Archaeo-Chemical Analysis of Royal Purple on a Darius I Stone Jar. Microchim. Acta 2008, 162, 381–392. DOI: 10.1007/s00604-007-0862-4.
- Karapanagiotis, I.; Mantzouris, D.; Cooksey, C.; Mubarak, M. S.; Tsiamyrtzis, P. An Improved HPLC Method Coupled to PCA for the Identification of Tyrian Purple in Archaeological and Historical Samples. Microchem. J. 2013, 110, 70–80. DOI: 10.1016/j.microc.2013.02.008.
- Nowik, W.; Marcinowska, R.; Kusyk, K.; Cardon, D.; Trojanowicz, M. High Performance Liquid Chromatography of Slightly Soluble Brominated Indigoids from Tyrian Purple. J. Chromatogr. A 2011, 1218, 1244–1252. DOI: 10.1016/j.chroma.2011.01.004.
- Yan, C.; Dadoo, R.; Zhao, H.; Zare, R. N.; Rakestraw, D. J. Capillary Electrochromatography—Analysis of Polycyclic Aromatic-Hydrocarbons. Anal. Chem. 1995, 67, 2026–2029. DOI: 10.1021/ac00109a020.
- Pretorius, V.; Hopkins, B. J.; Schieke, J. D. Electro-Osmosis: A New Concept for High-Speed Liquid Chromatography. J. Chromatogr. A 1974, 99, 23–30. DOI: 10.1016/S0021-9673(00)90842-2.
- Sanyova, J. Mild Extraction of Dyes by Hydrofluoric Acid in Routine Analysis of Historical Paint Micro-Samples. Microchim. Acta 2008, 162, 361–370. DOI: 10.1007/s00604-007-0867-z.
- Lingyi, Z.; Jie, Z.; Hui, W.; Lihua, Z.; Weibing, Z.; Yukui, Z. Analysis of Flavonoids in Leaves of Adinandra Nitida by Capillary Electrochromatography on Monolithic Columns with Stepwise Gradient Elution. J. Sep. Sci. 2005, 28, 774–779. DOI: 10.1002/jssc.200400080.
- Chen, Z.; Cai, Y.; Cheng, J.; Zhang, L. Electrochromatographic Characterization of Methacrylate Ester-Based Monolith and Capillary Electrochromatography Separation of Flavonoids. J. Chromatogr. B 2010, 878, 2375–2378. DOI: 10.1016/j.jchromb.2010.07.005.
- Ding, J.; Ning, B.; Fu, G.; Lu, Y.; Dong, S. Separation of Rhubarb Anthraquinones by Capillary Electrochromatography. Chromatographia 2000, 52, 285–288. DOI: 10.1007/BF02491018.
- Li, Y.; Liu, H.; Ji, X.; Li, J. Optimized Separation of Pharmacologically Active Anthraquinones in Rhubarb by Capillary Electrochromatography. Electrophoresis 2000, 21, 3109–3115. DOI: 10.1002/1522-2683(20000901)21:15<3109::AID-ELPS3109>3.0.CO;2-Q.
- Lü, H.; Wang, J.; Wang, X.; Lin, X.; Wu, X.; Xie, Z. Rapid Separation and Determination of Structurally Related Anthraquinones in Rhubarb by Pressurized Capillary Electrochromatography. J. Pharm. Biomed. Anal. 2007, 43, 352–357. DOI: 10.1016/j.jpba.2006.06.023.
- Starkey, J. A.; Mechref, Y.; Byun, C. K.; Steinmetz, R.; Fuqua, J. S.; Pescovitz, O. H.; Novotny, M. V. Determination of Trace Isoflavone Phytoestrogens in Biological Materials by Capillary Electrochromatography. Anal. Chem. 2002, 74, 5998–6005. DOI: 10.1021/ac025929b.
- Stöggl, W. M.; Huck, C. W.; Stecher, G.; Bonn, G. K. Capillary Electrochromatography of Biologically Relevant Flavonoids. Electrophoresis. 2006, 27, 787–792. DOI: 10.1002/elps.200500540.
- Li, C.; Chen, A.; Chen, X.; Chen, X.; Hu, Z. Separation and Simultaneous Determination of Rutin, Puerarin, Daidzein, Esculin and Esculetin in Medicinal Preparations by Non-Aqueous Capillary. J. Pharm. Biomed. Anal. 2005, 39, 125–131. DOI: 10.1016/j.jpba.2005.03.018.
- Li, Y.; Qi, S.; Chen, X.; Hu, Z. Separation and Determination of the Anthraquinones in Xanthophytum Attopvensis Pierre by Nonaqueous Capillary Electrophoresis. Talanta 2005, 65, 15–20. DOI: 10.1016/j.talanta.2004.04.019.
- Lu, Y.; Jia, C.; Yao, Q.; Zhong, H.; Breadmore, M. C. Analysis of Flavonoids by Non-Aqueous Capillary Electrophoresis with 1-Ethyl-3-Methylimidazolium Ionic-Liquids as Background Electrolytes. J. Chromatogr. A 2013, 1319, 160–165. DOI: 10.1016/j.chroma.2013.10.014.
- Qi, S.; Li, Y.; Wu, S.; Chen, X.; Hu, Z. Novel Nonaqueous Capillary Electrophoresis Separation and Determination of Bioactive Flavone Derivatives in Chinese Herbs. J. Sep. Sci. 2005, 28, 2180–2186. DOI: 10.1002/jssc.200500134.