Abstract
The rapid growth of biotherapeutic industry, with more and more complex molecules entering the market, forces the need for advanced analytical platforms that can quickly and accurately identify and quantify product quality attributes. Mass spectrometry has the potential to provide more detailed information about the quality attributes of complex products, and MS methods are more sensitive than UV methods for detection of impurities. The multi-attribute method (MAM), a liquid chromatography-mass spectrometry based analytical approach is an emerging platform which supports biotherapeutic characterization and cGMP testing. The main advantage lies in the ability to monitor multiple quality attributes in a single assay, both at the peptide and the intact level, facilitating streamlined biopharmaceutical production, from research and development to the QC environment. This review highlights the current landscape of the MAM approach with special attention given to increased analytical throughput, general requirements for QC in terms of instrumentation and software, regulatory requirements, and industry acceptance of the MAM platform.
Introduction
Biotherapeutics are complex molecules produced by living cells that have seen large growth in recent decades, with more and more complex therapeutic proteins entering the market.[Citation1–3] Their significance for human health lies on the ability to treat life threatening diseases such as cancer, autoimmune, inflammatory, and infectious diseases.[Citation4–9] During their development, production, storage and handling, biotherapeutics can be exposed to stress factors which can alter their structure and composition and ultimately impact stability and safety.[Citation10,Citation11] Those modifications are known as product quality attributes (PQAs) or critical quality attributes (CQAs) when, following risk assessment, they are required to be within a specific limit or range, which is the case of methionine oxidation, asparagine deamidation or N-glycosylation.[Citation10,Citation12,Citation13] In this regard, extensive characterization is essential to successfully develop biologic drugs. In alignment with quality-by-design (QbD)[Citation14] and to advance a biologic to market, accelerating process and product development requires more complete product characterization.
Conventionally, complete biotherapeutic characterization has been performed by a combination of electrophoretic, chromatographic, and immunoassays, such as imaging capillary isoelectric focusing (iCIEF),[Citation15–17] capillary gel electrophoresis (CGE),[Citation18,Citation19] size exclusion chromatography (SEC),[Citation20,Citation21] ion-exchange chromatography (IEX),[Citation22,Citation23] hydrophilic interaction chromatography (HILIC)[Citation24] or enzyme-linked immunosorbent assay (ELISA).[Citation25] However, such techniques are time consuming, must be used orthogonally and often lack sensitivity for detection of impurities. The advent of mass spectrometry (MS)- based analytical platforms has shaken up the biopharmaceutical characterization landscape and has provided more insights into protein structures and modifications, allowing for CQA driven manufacturing process development instead of final product testing.[Citation26] Mass spectrometry has the potential to provide more detailed information about the CQAs of such complex products, and MS methods are more sensitive than UV methods for detection of impurities and low level CQAs. This is reflected in the increasing number of biologic license applications (BLA) within U.S. FDA which includes MS workflows for attribute characterization.[Citation27]
The multi-attribute method (MAM) is an emerging analytical approach which supports biotherapeutic characterization and cGMP testing. The main advantage lies in the ability to monitor multiple PQAs/CQAs in a single assay and it is intended to replace the conventional approaches mentioned earlier, becoming a more streamlined application throughout biopharmaceutical production, from research and development to the QC environment. MAM is one of the most sensitive approaches providing site-specific identification and quantitation of PTMs in biotherapeutics.
MAM overview
MAM is an LC-MS based peptide mapping technique which requires the enzymatic digestion of the protein and the subsequent chromatographic analysis of the generated peptides by reversed-phased liquid chromatography (RP-LC) coupled to high-resolution accurate mass mass spectrometry (HRAM MS). It was originally developed by scientists at Amgen[Citation28] and since then it has attracted substantial attention within the biopharma community[Citation29,Citation30] as is reflected by the increasing number of peer-reviewed publications. Overall, most studies report the application of MAM outside QC environment[Citation31–33] while only a few recent publications focus on the application for release and testing in QC laboratories.[Citation34–37] Some groups have focused on the optimization and automation of the sample preparation step to achieve robust digestion efficiency and low levels of protocol induced post-translational modifications (PTMs).[Citation38,Citation39] A small number of interlaboratory studies[Citation35,Citation40,Citation41] have also been reported to demonstrate the robustness of the method across different sites and operators. In addition, the evaluation of different LC-MS platforms has also been addressed,[Citation42,Citation43] although mass spectrometers with high resolution mass analyzers are preferred over the use of low-resolution mass analyzers.
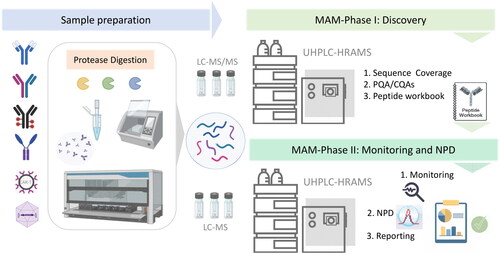
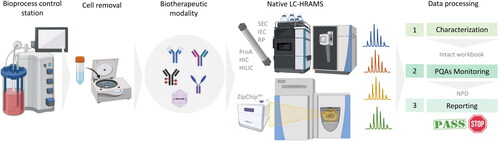
This bottom-up peptide centered approach consists of three steps: first, sample preparation which requires enzymatic digestion of the protein of interest. Second, a discovery phase which requires full MS and MS/MS analysis of the digested samples to determine quality attributes for monitoring, followed by the creation of a targeted workbook based on retention time plus high-resolution accurate mass analysis. The third step of MAM is the monitoring phase which uses the target peptide workbook previously generated and the new peak detection (NPD) tool to determine the presence, absence or change of any species by means of a differential analysis of a reference sample and a test sample (). It is important to highlight the need to evaluate the performance of the LC-HRAM-MS system prior to the application of the MAM approach, following instrument vendor recommendations.[Citation44] Setting appropriate system suitability criteria can ensure acceptable sample preparation and LC-MS analysis. The application of MAM also requires automated software platforms to help with extensive data acquisition and processing in all stages of the MAM approach. There are several software commercially available from different vendors such as Thermo Scientific™ BioPharma Finder™ and Chromeleon™ chromatography data system (CDS),[Citation36,Citation45] Byos® from Protein Metrics,[Citation46,Citation47] Expressionist® from Genedata,[Citation48,Citation49] UNIFI™ from Waters,[Citation50] BioPharmaView™ or Biologics Explorer from Sciex.[Citation51]
Figure 1. An overview of the MAM workflow for analysis of biotherapeutic proteins from process development to product characterization. Sample preparation using enzymatic digestion can be accomplished by manual handling or automated workflows involving robotic platforms with different proteases. The peptide mapping experiment comprises the discovery phase to assess sequence coverage and identify the product quality attributes (PQAs). A list of CQAs is created in a peptide workbook format which is then used for routine GMP-compliant monitoring of the selected targets, detection of new features, and reporting.
Advances in MAM
As the technique has progressed over recent years, MAM is now being increasingly used for routine PQA/CQA analysis of mAb molecules and this is being extended to other biotherapeutics modalities such as bispecific[Citation35] or multispecific[Citation38] antibodies (BsAbs or msAbs), Ab fragments,[Citation38] growth factors,[Citation52] fusion proteins[Citation46,Citation53,Citation54] or the recently introduced CAR-T therapy.[Citation55] Nowadays, the focus is still on the implementation in QC labs. The first study describing the implementation of a high-resolution LC-MS method for mAb subunit analysis in commercial QC laboratories for monitoring antibody oxidation has recently been published by Sokolowska et al.[Citation34] Subsequently, Evans et al.[Citation35] reported the use of MS-based peptide mapping method implemented in GMP compliant QC labs using a low-resolution MS system. This MAM method was validated for the quantitation of three selected CQAs (complementarity-determining region, CDR isomerization, Fc Met oxidation, and CDR Met oxidation) to ensure control of the oxidation and isomerization degradation pathways of a BsAb. Additionally, Hao et al.[Citation36] have focused on the MAM validation for QC of predefined PQAs, such as isomerization, deamidation, oxidation, sequence variant and N-glycosylation on 3 different mAbs, such as IgG1, IgG4 and a BsAb. Evaluated parameters were (1) specificity, or the ability to discriminate between the attribute of interest and other putative interfering species; (2) PQA range, in terms of relative abundances; (3) accuracy; (4) linearity; (5) precision (an overall acceptance criterion of 15% for repeatability, and 20% for intermediate precision was used); (6) limit of quantitation (LOQ) using a signal to noise ratio of 10:1; and 7) robustness. Recently, Numao et al.[Citation37] have also developed a comprehensive approach for performance evaluation of MAM as a QC method by using two internal standards as surrogates which were added to the in-house produced IgG1 mAb samples.
Currently, moving MAM from research and development into QC environments still poses some challenges.[Citation56] Overcoming such challenges requires collaboration between biopharmaceutical developers and manufacturers, the research community and LC-MS instrument manufacturers. To facilitate technology transfer from research and development organizations into QC environments, the following aspects must be adopted: (1) compliance-ready software for data acquisition, data processing, reporting and approval; (2) cost effective, robust, and easy to use MS instruments that can provide comparable results and can be used by analysts without extensive MS expertise; (3) long-term instrument support commitment from vendor; (4) consistent data generation (day to day, system to system and site to site); (5) scalability; (6) methods/information/knowledge sharing intra-company and with partners. In this regard, manufacturers are working on the creation of end-to-end solutions which facilitates the implementation in QC environments, with the introduction of more QC-friendly mass detectors[Citation57] and a centralized data management system which provide data security and integrity, increased performance by accelerating data processing and increased productivity by facilitating data sharing and information connectivity. An overview of the described advanced MAM workflow is summarized in .
Figure 2. Schematic overview of advanced MAM method transfer, from research and development to manufacturing and QC using an eWorkflow procedure that contains all the associated methods and the reporting template required to set up the injection sequence, acquire, process the data, and summarize the results in a report with a visual pass/fail representation. Data lake allows for software integration, instrument management, data storage, seamless data and workflow transfer, accelerated data processing and advanced reporting.
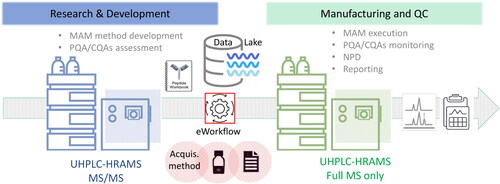
Another important aspect of debate is the use of MS versus MS/MS in the quality control space. The MAM discovery phase, normally conceived during research and development, requires MS/MS acquisition to confidently elucidate peptide composition, sequence, and site-specific modifications. Peptide tandem mass spectra generated upon collision induced fragmentation provide sequence information by cleaving the peptide backbone in a selective way, allowing to derive precise peptide sequence information. Instruments providing Full MS only acquisition are generally more applicable in the QC environment during the MAM monitoring phase. This is due to operational simplicity and the fact that the monitoring step is based on retention time plus accurate mass information provided in the peptide workbook which is created during the discovery phase. In this regard, high resolving power of the chromatographic column combined with high resolution mass analyzers are preferred over the use of low and unit resolution mass analyzers for both MS and tandem MS, because high mass resolution can improve mass accuracy and the reliability of peptide sequence identification as well as attribute monitoring. Yet as the attribute monitoring and new peak detection data processing steps rely entirely on Full MS only data, there is no requirement for acquisition of MS/MS data in the QC phase. However, some users prefer to acquire data sets including MS/MS spectra to not have to re-acquire data for samples that get flagged in the NPD step. Data consistency throughout the entire MAM workflow from R&D to QC can be another reason, in particular when the instrument deployed in R&D is not offered in a Full MS only instrument model from the same hardware platform. Yet this choice results in higher costs for both - instruments and higher trained personnel. The advanced MAM workflow offers fast decision making based on high-confidence PQAs/CQAs obtained using HRAM MS technology, together with seamless knowledge and method transfer across instruments, departments, and sites using compliance-ready CDS software and a cloud-based server solution,[Citation58] to centralize and secure data storage and facilitate data connectivity from discovery to QC.
Toward sample automation and high-throughput sample preparation
Sample preparation is one of the most critical steps of the MAM approach. The development of a robust and reproducible sample preparation protocol with minimal sample preparation-induced artificial protein modifications is key to design a robust and reliable MAM workflow. A comprehensive MAM workflow has been recently published with the aim to standardize sample preparation and all the steps involved.[Citation59] Manual sample preparation has been extensively used to monitor multiple attributes on different biotherapeutic molecules. Conventionally, it requires to denature, reduce, and alkylate the sample followed by a desalting step or buffer exchange into the digestion buffer prior to enzymatic digestion. However, to date there is no consensus in the used protocol and different reagents and buffers are used in this regard.[Citation60–62] summarizes some examples of the manual digestion protocols applied so far for the MAM approach. Overall, trypsin is the most commonly used protease for peptide mapping of mAbs, as the resulting peptides make it the most suitable option for reversed-phase LC-MS/MS analysis. However, certain mAbs or other biotherapeutic modalities might require other enzymes to achieve full sequence coverage and a reliable assessment of PTMs. Other frequently used proteases are chymotrypsin,[Citation63] Lys-C,[Citation37,Citation64,Citation65] Asp-N or Glu-C.[Citation52] In some cases, a combination is required, such as for some complex fusion proteins.[Citation66] Pepsin has also been used successfully for the digestion of adeno-associated viruses (AAV) capsid proteins.[Citation67]
Table 1. Manual sample preparation protocols used for MAM approach.
The suitability of MAM for high-throughput analysis is one of the main advantages for its use in development and monitoring or for batch release and purity testing in QC labs. In this regard, automation of sample preparation using robotic platforms has gained substantial attention. Liquid-handling workstations have been used to assist a buffer exchange step prior to protease digestion, by using SizeX100 IMCStips[Citation39,Citation68] on a single robotic liquid-handling system. Automated trypsin digestion has also been described to obtain a globally harmonized digestion method with the added benefit of increased throughput.[Citation38] Three sites located in three different countries applied the final developed automated digest method to demonstrate comparable LC-MS MAM results. Alternatively, automated digestion using trypsin magnetic beads has also been described[Citation40] and could be considered as a preliminary study to the implementation of a MAM approach in a QC lab. In 2022, Kristensen et al. published a modified workflow with an automatic digestion step which includes a two-step digestion at high and low temperatures and demonstrated a significant decrease in the number of missed cleavages for the studied mAbs.[Citation69] Finally, Liu et al. have published the use of a customized ProSIA flow injection system where the sample goes through additional carefully designed fluidic network including valves, tubing coils and mini reaction chambers to complete the automated enzymatic digestion.[Citation70] This approach allowed for a fully automated online UHPLC-MS for real time CQA monitoring of cell culture process. summarizes the automated sample preparation protocols described to date for MAM. Automated sample preparation systems not only improve robustness and consistency, but also enable MAM as a process analytical technology (PAT) tool to monitor and control CQAs of therapeutic proteins during process development and manufacturing.[Citation71]
Table 2. Automated sample preparation protocols used for MAM approach.
New peak detection (NPD)
NPD overview
NPD is the last step within MAM approach which allows for non-targeted detection of unmonitored quality attributes and potential process and/or product-related impurities in the sample of interest. It involves the comparison between a control and a test sample for the presence, absence or change in any peak that will be flagged by the NPD algorithm. It is more sensitive than current purity tests employed by QC, which normally are limited to spectroscopic detection and thus can be easily misled by co-eluting species that may mask the presence of an impurity and are not able to return any indication on the nature of the newly identified component. It is important to highlight that to keep variability under control, sample preparation quality and LC-MS system performance must also be assessed throughout the experiment. First, a system performance evaluation test (SET) is performed, following instrument vendor recommendations, before the analysis of the digested peptides. Secondly, a system suitability test is included within the sequence of analysis, with a reference standard or a well-known sample. As part of the measurements need to demonstrate the suitability of the NPD approach in the QC context, detection and quantitation limits should be determined. An approach could be to spike known peptides into the sample, which will be further discussed in the NPD application section.
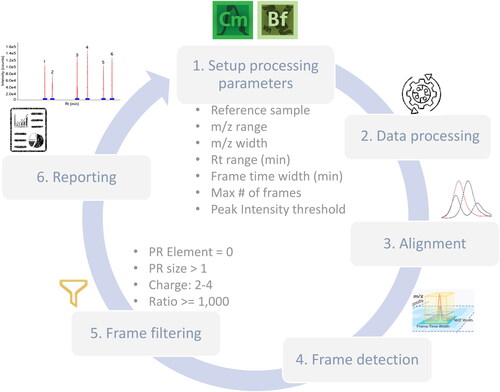
NPD analysis can be implemented using the different commercially available software platforms mentioned above. Although some general settings could be considered for all, certain parameters and the algorithm used would be software specific. As an example, the NPD process consists of 6 steps within Chromeleon CDS v. 7.3.2 software as summarized in : (1) Setup, where the user defines the processing parameters and select the reference sample; (2) Processing, where the selected raw data files will be interrogated according to the established method parameters; (3) Alignment, where the algorithm aligns chromatographic data points from the test sample to the reference sample; (4) Frame detection, where the algorithm performs pattern recognition to cluster mass peak groups to a single component, based on charge-state specific potential isotopic mass distributions. A frame is a component, or a peak defined by 3 parameters, such as m/z, chromatographic time, and intensity. (5) Frame filtering, to limit the results to only those frames which are most likely to be legitimate peaks and/or components; and finally, (6) Reporting of the obtained results in summary table and frame plot format. NPD involves the optimization of most critical parameters such as Rt window, tolerance (ppm) and peak intensity threshold, to reduce the detection of false positives or negatives, always depending on the question to be addressed. The output of the NPD analysis is either the presence or absence of a new peak, or a changed peak, and subsequent data analysis is always needed to identify the flagged peak. In this case, BioPharma Finder software was used for identification purposes without the need for extra sample analysis, as the raw files generated during the discovery phase will be interrogated against available databases.
Figure 3. New Peak detection workflow for Chromeleon CDS and BioPharma Finder software for identification purposes. PR (pattern recognition) Element = 0, indicates only features with monoisotopic mass will be included. PR size > 1, indicates that at least one additional isotope must be detected. Ratio allows for a 1000-fold change (either more or less) in terms of average intensity.
Currently, there are two different algorithms implemented in Chromeleon that can be used for NPD, SIEVE (Statistical Iterative Exploratory Visualization Environment)[Citation72] and the same algorithm used in BioPharma Finder.[Citation58] The latter has been implemented from Chromeleon CDS version 7.3.1 onwards and offers a more streamlined NPD application.[Citation73]
NPD applications
Although the number of peer-reviewed publications suggesting a MAM approach is increasing, there is still a lack of NPD analysis included in many of the published works. Strictly speaking, those studies without the use of NPD would be referred to as multi-attribute monitoring to differentiate it from the more standard MAM approach which will include the non-targeted MS data processing step or NPD. First studies on the NPD feature focused on the demonstration of the capability of MAM workflow for NPD by using a mAb digest spiked with different amounts of peptide retention time calibration (PRTC) standard.[Citation74,Citation75] All 15 PRTC peptides were identified as new peaks in the spiked sample compared to the control sample (unspiked mAb digest). One of the most critical parameters is the peak intensity threshold. This value must be carefully chosen based on not only the intensity of the total ion or base peak chromatogram but also on the question to be answered. The maximum number of frames should also be adjusted accordingly, allowing for a greater number of frames to be reported as the peak intensity threshold is reduced.
Early in 2021, the NPD tool was used to to demonstrate the potential for host cell proteins (HCPs) analysis and sequence variant analysis of an investigational IgG1 mAb.[Citation33] The application of NPD for the detection of low abundant impurities such as HCPs was studied on a drug product spiked with different levels of known HCPs from 10 to 1000 ppm. This study required the optimization of NPD by dividing the chromatogram into three processing sections and adjusting the Rt range, m/z range, and peak intensity threshold. As an example, shows the detection of 12 new peaks for the sample spiked with 1000 ppm (red traces) compared to the reference sample (blue traces), and the processing and filtering parameters used. To be able to detect the same HCPs at lower levels, those parameters were adjusted for lower peak intensity thresholds and reduced Rt and m/z ranges by defining different segments within the chromatogram, which allows to detect more frames for each Rt interval (). summarizes the frame table report for all the obtained results together with the identification of the new peaks using BioPharma Finder software and MS/MS data. Six peptides were identified for each HCP.
Figure 4. NPD for the detection of HCPs spiked into a commercial chimeric IgG1 drug product (DP): (a) new peaks (red trace) detected in the HCP 1000 ppm spiked sample compared to the commercial DP (blue trace) and (b) new peaks (red trace) detected in the HCP 100 ppm spiked sample compared to the commercial DP (blue trace). Corresponding defined frame detection and filtering parameters are summarized on the right-hand side for each frame plot.
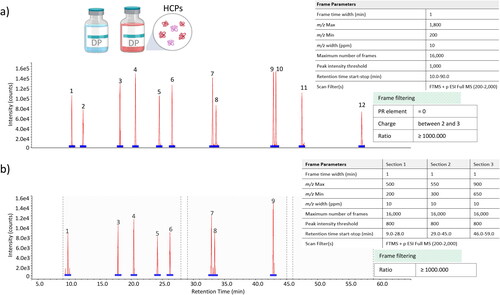
Table 3. Identified HCP peptides as new peaks in commercial DP spiked with 1000 ppm of HCPs by comparing to the reference sample (unspiked DP) using BioPharma Finder.
In 2022, Carvalho et al.[Citation76] described the implementation of NPD workflow using data from an oxidation stability study with and without digestion protocol optimization. The NPD criteria used for this study, based on BiopharmaView software, was peak height > 500 counts, peak quality > 0.6, retention time delta ≥ 0.2 min, +1 charge state peaks excluded and fold-change detection (FCD) threshold ≥ 3. Samples kept in the autosampler for 48 h and 72 h (at 4° C), showed fold change higher than 3 compared to the reference, and were automatically flagged by the software.
Finally, Niu et al.[Citation77] reported the use of NPD to solve sequence variant analysis challenges in bioprocess development using Progenesis software for feature detection and alignment and Byos software for sequence variant identification by database searching. The NPD parameters and thresholds employed in the study were from systematic evaluations and were carefully selected to achieve the best combination of sensitivity and specificity of sequence variant analysis. The recent study published by Sadek et al.[Citation78] also reported a unique experimental design utilizing sequence variant co-mixes to measure NPD performance. NPD parameters were optimized to have high sensitivity and selectivity and the optimized NPD workflow was qualified in a molecule-specific manner and demonstrated high performance for monitoring changes throughout the biotherapeutic product life cycle, from early development to QC.
NPD interlaboratory study
Recently, the MAM consortium organized and published the interlaboratory NPD performance metrics from 28 labs in the biopharmaceutical industry[Citation49] to report on the industry-wide performance of NPD using pre-digested samples of the NISTmAb Reference Material 8671 with the aim to provide insight for industry members beginning to develop the platform in their laboratories. Study participants included members of the biopharmaceutical industry, mass spectrometry instrument vendors and government agencies.
The NPD round robin study was designed to specifically focus on the performance of state-of-the art instrumentation and processing software being used for MAM across the industry. The LC and MS instrumentation used to acquire the data, as well as the software platforms and parameters used for data processing, varied between participants, but overall HRAM MS instrumentation was used (LIT-Orbitrap, Q-Orbitrap and QTOF). Moreover, the full spectrum of software platforms marketed for MAM applications were represented industry wide. The analytical column, chromatographic gradient, and injection sequence remained constant across all participants.
Participants were supplied with a “New Peak Detection kit” that included all materials required for analysis () to minimize any variation during the sample preparation step. Initially, a retention time repeatability and reproducibility analysis was performed using a calibration sample containing 15 peptides to establish the most appropriate retention time window. Interlaboratory mass accuracy was also assessed and kept below 5 ppm (absolute value) for all evaluated peptides. Next step was the application of NPD method to compare the reference sample to the spike, unknown, and pH stress samples. A FCD threshold was established based on the least reproducible peptide. NPD threshold values applied were spread across a wide range, with most participants using an absolute NPD threshold at or below 1.0E6 units. As Mouchahoir et al. described in the presented study, there are multiple approaches that may be considered for determining optimal NPD threshold values, and regardless of the approach taken, it should be empirically determined individually for specific processes and products as well as for different instruments and software platforms.
Table 4. NPD kit contents (for more details see reference 49).
The critical tolerance windows (retention time, m/z, and FCD threshold) and NPD threshold which could be used as a reference for a NPD experiment are summarized in . It is important to highlight that less than 50% of the participants in the round robin study achieved conformity to expected results for both the spike and unknown samples. For the application of NPD to the pH stress sample, low consensus between participants was observed which seems to indicate that other factors in addition to NPD and FCD thresholds are important for MAM, such as co-eluting species with undifferentiated m/z ions. Overall, the non-conforming results had identifiable causes, as summarized in , where putative measures to overcome them are also described.
Table 5. Critical NPD parameters and tolerance windows selected based on InterLab study.
Table 6. Sources of non-conformity and mitigation strategies for NPD experiments.
The results of the NPD interlaboratory study are the base for a refined NPD approach, which will require the use of system suitability controls that target appropriate NPD parameters representative of a given process/product, as well as traditional instrument preventative maintenance and best practices.
Peptide mapping-based MAM versus intact MAM (iMAM)
Although the conventional MAM approach is based on a bottom-up workflow, it can also be applied at the intact protein level. This is possible thanks to the technological advances experienced during recent years and the development of HRAM MS instrumentation, which has enabled the hyphenation of a variety of LC-based biomolecule separations to native-MS.[Citation79–82] The main advantage is the ability for high-throughput MS-based attribute tracking without the need for extensive sample preparation. Intact multi-attribute method, also referred as iMAM,[Citation83] offers great potential for unraveling the heterogeneity of glycoproteins while preserving higher order structure and non-covalent interactions. Overall, the iMAM workflow requires the dilution or limited sample preparation for desalting or cell removal, prior to chromatographic separation by any native MS-compatible separation technique, followed by HRAM MS analysis (). Data analysis involves a characterization step by using any of the commercially available compliance-ready software platforms for intact protein analysis to generate an intact workbook which contains the PQAs of interest. In a second step, targeted intact protein deconvolution is performed upon import of the intact protein workbook for PQA monitoring. Certain parameters within the intact protein deconvolution method must be defined to confirm the identity of detected proteoforms, such as composite scoring, deconvolution mass tolerance, target mass, Rt tolerance or identification mass tolerance. NPD can also be applied to search for the presence of new entities. Finally, an automatic report is generated showing the identified proteoforms by mass confirmation and their relative quantification, and the presence or absence of new entities.
Figure 5. Example of iMAM workflow as an in-process test to monitor the behavior of biotherapeutic product quality attributes. Depending on the therapeutic modality of interest, sample preparation may require just dilution, a desalting step or cell removal. Multiple chromatographic separation techniques are available for native intact protein analysis: SEC (size exclusion chromatography), IEC (ion-exchange chromatography), RP (reversed-phase chromatography), ProA (protein A affinity chromatography), HIC (hydrophobic interaction chromatography), HILIC (hydrophilic interaction liquid chromatography) or μCE (microfluidic capillary electrophoresis by ZipChip™). Data processing involves a characterization step to define a list of proteoforms which will be used in the target intact workbook for the monitoring phase. NPD is used for new entities searching. A final report summarizes all monitored attributes and their relative abundances and a pass/fail condition to indicate they meet the established acceptance criteria.
With the advantage of minimal sample preparation and the potential for real time monitoring, the implementation of MAM for intact mass analysis (including subunit analysis) has attracted high interest in the biopharmaceutical industry. Liu et al.[Citation84] have reported a MAM method based on subunit mass analysis at the intact level. Results from this study indicate that MAM with intact subunit mass analysis has the potential to replace three conventional methods widely used for mAb release testing including identification assay by ELISA, glycosylation profiling by hydrophilic interaction liquid chromatography (HILIC), and ratio determination for co-formulated mAbs by RP-LC. The suitability of the method for use in a QC environment was demonstrated by the evaluation of method accuracy, precision, linearity, range, and specificity.
Intact mass-based MAM has also allowed upstream scientists to analyze samples, make rapid decisions and key process adjustments during bioreactor operations, as described by Lanter et al.[Citation85] The method was optimized for the analysis of reduced intact mAbs which were sampled directly from bioreactors. It facilitated identity testing, N-glycan profiling, and the monitoring of glycation and non-glycosylation levels on LC and HC, respectively. The approach showed comparable results to the ones obtained by conventional approaches such as HILIC N-glycan profiling and capillary gel electrophoresis (CGE), and to the data obtained from LC-MS/MS peptide-based MAM experiments.
Other studies also showed the application of the iMAM approach for native intact analysis, without the need for a reduction step. Carillo et al. recently described the use of protein A affinity chromatography directly coupled to native Orbitrap-based MS (ProA-MS), to monitor trends of IgG1 proteoforms during a bioreactor campaign, using fully compliant data acquisition and processing.[Citation86] This work is based on the method previously developed by Jakes et al.[Citation87] Briefly, samples taken from a bioreactor were aseptically collected and clarified from cell debris and directly analyzed in a 5-min ProA-MS analysis, allowing for monitoring N-glycoform variability from day 3 to day 12 of cellular growth. Data processing was performed with Chromeleon CDS using a workbook containing the targeted proteoforms to be monitored, for report generation of the proteoform trends, and to evaluate acceptance criteria. Deconvoluted spectra showed considerable change in the N-glycans with increase of unglycosylated species as well as high mannose N-glycans.
A MAM based characterization of antibody drug conjugates (ADC) at the intact and subunit levels has also been described by Martelet at al.[Citation88] with the aim to overcome the limitations of conventional MAM for this type of biotherapeutic, which may result in important protein structural information loss. The implemented iMAM method was capable of monitoring multiple PQAs such as DAR (drug-to-antibody ratio), DDP (cis-diamminedichloroplatinum), integrity and identity in a single assay by combining sample preparation and SEC with optical as well as MS detection. This application demonstrated that, in addition of the automatic data processing, the software successfully discriminated stressed samples based on customized rules for PQA monitoring. The easy visualization of results made the workflow suitable for high-throughput analysis even for non-expert users.
Overall, the iMAM approach is not limited to mAbs but equally applicable to other types of biotherapeutic modalities such as ADCs, fusion proteins, or gene therapy products. It can also be implemented using different chromatographic techniques coupled to native HRAM MS, such as RP,[Citation89] size exclusion chromatography (SEC),[Citation90] ion-exchange chromatography (IEC),[Citation91] hydrophobic interaction chromatography (HIC),[Citation92] HILIC[Citation93] or microfluidic capillary electrophoresis (μCE)[Citation94] as summarized in . As for the conventional MAM approach, the successful implementation of iMAM will require a compliance-ready software solution which can accomplish all aspects of the workflow in a user-friendly manner. Although iMAM is not suitable to determine PQA site-specificity, it has its own advantages and is particularly interesting to quickly monitor the presence of fragments, dimers and larger aggregates or chain assembly in BsAbs. As mentioned above, another important use for iMAM is with ADCs, as it allows for product identity confirmation, quantification of the different conjugated species, and to monitor drug-to-antibody ratio, which cannot be accomplished with the conventional MAM approach, as after protein digestion the drug distribution profile of the ADC would be lost. Finally, iMAM could have a valuable impact for high throughput screening to support the process development or routine monitoring of product quality.
General requirements for QC instruments
MAM aims ultimately for the use in QC, yet the entire workflow spans across several departments which have different requirements. While in the R&D stage implementing new technologies and methods as well as updating software can be done rather flexibly, the implementation in a regulated Good Manufacturing Practice (GMP) environment such as a QC department requires a number of considerations and steps or rather procedures, which require a significant amount of planning and time, with the entire process taking between a couple of months up to an entire year, depending on the complexity and the infrastructure already in place. For implementing MAM in a QC laboratory, adhering to compliance for qualification of the equipment as well as validation of software and the method applied are basic GMP requirements.
Validation and qualification
Validation is an all-encompassing process ensuring that a system or method consistently yields accurate, reliable, and reproducible results within set limits. In contrast, qualification, a component of validation, verifies that individual elements, like equipment or instruments, function properly and satisfy predefined performance criteria in specific contexts.
In regulated settings, qualification of instruments is crucial for complying with regulations like the U.S. FDA’s Current Good Manufacturing Practice (cGMP) and consists of four phases: (1) design qualification (DQ) that relates to specification and instrument selection; (2) installation qualification (IQ) and (3) operational qualification (OQ) that relate to the installation of the instrument and functional testing; and (4) performance qualification (PQ) that confirm the suitability of the equipment for the intended use. IQOQ of instrument modules and data interpretation software is mandated for regulatory compliance and as part of the validation plan. While IQ and OQ are performed by the instrument vendor, DQ and PQ are performed by the user. For PQ a relevant system suitability test (SST) sample is required to be included in the analysis sequence to bracket the samples of interest. For MAM of a mAb type sample, users typically use a well characterized mAb standard produced in house or a commercially available mAb standard as an SST sample. Validation is needed following process changes, new facility or equipment introductions, regulatory submissions, and technology transfers. Organizations may also conduct periodic revalidation as part of their quality management system.
To achieve acceptance and approval of MAM for release and stability testing of biopharmaceutical products in a GMP environment, the method must be qualified and/or validated to be appropriate as well as comparable to the conventional physico-chemical methods that are intended to be replaced. Instrument and method validation is resource-intensive, necessitating extensive testing for robustness and reproducibility. As a result, an instrument’s reproducibility can significantly influence the validation process and timeline, potentially preventing completion and the instrument or software release for use.
Compliance
Compliance in the biopharmaceutical sector entails adhering to laws, regulations, and guidelines set by regulatory bodies. These govern all aspects of the industry, including research, development, manufacturing and distribution. With a constantly evolving regulatory environment, companies must stay current with regulations and guidelines, requiring substantial time, resources, and regulatory knowledge. Introducing new techniques into this environment can be complex; innovative methods must meet quality and compliance regulations.
One emerging technique in the regulated environment is the use of Liquid Chromatography - Mass Spectrometry (LC-MS) for MAM. Implementing LC-MS in a regulated setting can be challenging due to the complexity and sensitivity of the technique. Biopharmaceutical regulations demand strict adherence to protocols, data integrity, and validation procedures. Ensuring consistency and reproducibility of results is crucial for meeting regulatory standards. Sample preparation, which can introduce errors and lead to out-of-specification results, requires trained personnel. Manufacturers are focusing on sample automation ahead of LC-MS analysis to minimize errors, using digest kits and compact benchtop instruments for semi-automated sample preparation.
Moreover, the reproducibility of LC-MS systems and the software for interpreting results are critical for compliance. SSTs are mandatory to confirm system readiness and expected results. Pre-digested samples, such as bovine serum albumin (BSA), are used to evaluate systems. Clear SST acceptance criteria are vital to ensure samples are not being analyzed on unsuitable systems. During a sample analysis sequence, live samples should be bracketed by QC check samples at defined intervals to maintain system suitability and method precision and accuracy.
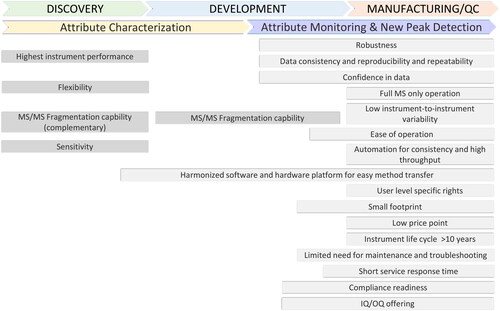
The requirements that the instrument hardware applied for MAM needs to fulfill from a user perspective comprise a variety of factors (). In the early stages of the MAM workflow during characterization, instrument capabilities for fragmentation, ideally offering even different fragmentation types, are essential for the identification of all product quality attributes. With state-of-the-art mass spectrometry instrumentation, the advanced capabilities of instrumentation typically result in higher complexity in operation, thus requiring highly skilled operators. Requirements for QC laboratories are however, on the opposite end. Instrumentation needs to be fit for purpose providing only the essential functionalities with an emphasis on being intuitive, user friendly, and requiring as little training as possible for efficient operation. The confidence in the data being produced is a key requirement, resulting from consistent, reproducible, and repeatable results over weeks, months, and years. This relates to the performance of chromatography based on stable and reproducible retention times as well as to the mass spectrometer performance regarding reproducible mass stability and sensitivity. This also goes hand in hand with the need for robust performance with instruments providing low instrument-to-instrument variability, and minimal need for maintenance and service, as well as short service response times from the instrument vendor in case issues arise requiring repair. In addition, an instrument life cycle of at least 10 years, a low price point, and small footprint to reduce required bench space are key requirements for implementation of MAM in QC. The software interface plays an essential role and must be intuitive, user friendly and ideally have the option to define user role specific rights to allow either full access to all method parameters or only deploy pre-defined methods without the need for significant user intervention. Fail proof operation, especially for the new peak detection step, is critical to avoid the requirement for additional investigations and the risk of causing delays in batch release. Automation of the data acquisition and processing all the way to report generation is desired. Automation of the sample preparation will greatly support the reproducibility and consistency of results, as the effect of different users on results and their variability, in particular related to certain modifications such as oxidation, is well known.
Figure 6. Summary of software and hardware requirements for MAM at the different stages.
Lastly, using a consistent hardware and software platform yet serving the different needs from development to QC allows for a smooth method transfer from development to QC, eliminating the need for method reevaluation and thus significantly reducing time and effort.
Software version/validation
Computer systems validation (CSV) is required for deployment of MAM as the LC-MS platform is controlled from a PC and the control software is used to carry out the data acquisition and analysis. CSV plays a vital role in regulated environments, ensuring quality control and adherence to regulatory requirements.[Citation95,Citation96] It is a mandatory step when deploying or integrating enterprise systems, particularly in pharmaceutical manufacturing, testing, and control. CSV activities involve planning, documentation, testing, verification, and validation in compliance with industry standards, which helps mitigate risks, maintain data integrity, confidentiality, and security, and minimize product quality issues and regulatory noncompliance.
CSV is typically carried out by a team of IT and metrology experts with a deep understanding of the organization’s IT infrastructure. Due to its resource-intensive nature, careful planning, testing, and verification are crucial. CSV is performed on a specific software version, and any changes to that version may necessitate re-validation. Managing software changes is essential to maintain validation, data integrity, security, and compliance.
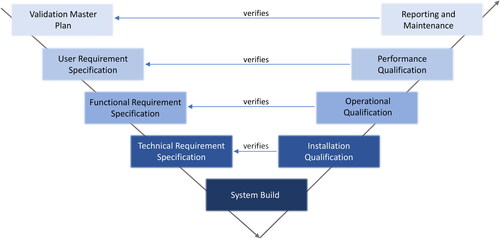
The V-model diagram[Citation97] is commonly used in CSV planning and execution, representing the system development lifecycle’s sequential stages (). The left arm of the V-model illustrates requirements definition, system design, and software/hardware design, while the right arm covers integration, verification, and validation activities. Connected by diagonal lines, the V-model emphasizes aligning design and validation, ensuring each system component is tested and validated at the appropriate development stage.
Figure 7. V-model diagram for CSV planning and execution.
Considerations for the regulatory and industry acceptance of MAM
In general, the regulatory considerations and expectations for the acceptance of MAM as a release method in QC are not any different from other methods that are currently being applied. Overall, the expectation is to demonstrate that the method is suitable for the intended use according to 21 CFR 211.165(e)[Citation98] and 211.194(a)(2)[Citation99] guidelines. Several regulatory agencies have invested significant effort in evaluating MAM, with the U.S. FDA being most active and engaged with the community, highlighted in the publication from Rogstad et al.,[Citation100] followed by a presentation at the MAM consortium in October 2019, as well as a webinar broadcast in October 2022.[Citation101] Four key aspects are being emphasized for evaluation as part of implementing MAM in a cGMP environment: (1) risk assessment regarding what benefits and possible risks the replacement of orthogonal methods by MAM would result in; (2) MAM method validation assessing the performance spanning across sample preparation, hardware instrumentation, and software capabilities; (3) comparison of MAM against conventional methods to demonstrate the suitability of the MAM approach for the control of product attributes at levels that were previously shown to be safe and efficacious; and (4) specificities including criteria definition of new peak detection, resulting in neither false positives nor false negatives. As Rogstad et al. concluded, “an industry-wide understanding in each of the areas for multiple protein molecules with various characteristics will be beneficial for all parties involved in support of the future implementation of MAM as a platform technology for QC of therapeutic proteins”.
The European Federation of Pharmaceutical Industries and Associations (EFPIA), representing the biopharmaceutical industry operating in Europe with a membership of 37 national associations from 38 leading pharmaceutical companies, has founded a “MAM as QC tool” working group in March 2021 under the EFPI Manufacturing and Quality Expert Group (MQEG). This teams includes 25 representatives from 17 pharmaceutical companies and focuses on promoting the global acceptance of MAM. The group effort has so far resulted in presentations at the CASSS CMC strategy forum in 2021 and 2022 as well as CASSS AT EU in 2022, a presentation at the European Medicines Agency Biologics Working Party (EMA BWP) in 2022, a regulatory position paper available on the EFPIA website[Citation102] published in October 2022, and a presentation in the MAM consortium December in 2022. In this presentation, three areas were brought up that require to be addressed in the future: (1) software solutions requiring alignment between users and vendors; (2) establishing best practices for NPD threshold definition (intensity threshold (IT) and fold change detection (FCD)) as well as NPD workflow validation; and (3) the use of common standards and SST criteria to enable comparison of instruments and performance.
In addition, the FDA has awarded the U.S. Pharmacopeia (USP) a grant to create a MAM knowledge base by studying “ways to enhance biosimilar and interchangeable biosimilar product development and regulatory science, specifically through the use of the Multi-Attribute Method (MAM)” as announced in a press release.[Citation103]
Lastly, a considerable milestone for MAM has been achieved in 2019 upon the FDAs Emerging Technology Teams review of MAM for control purpose involving several rounds of review, resulting in the acceptance of a sunset strategy for conventional methods for one applicant. As of today, several companies have established MAM in QC and the path has been started for more to follow.
Conclusions and perspectives
In the continuous effort to bring to market safer and more potent biotherapeutics, the concept of the multi-attribute method (MAM) emerged from biopharmaceutical companies to support the quality-by-design process development. In this review, the current landscape and advances in MAM are discussed in detail with special focus on sample throughput and new peak detection. Furthermore, the review discusses the general requirements for QC in terms of instrumentation and software, regulatory needs, and industry acceptance of MAM.
Since the introduction of the MAM concept in 2015 by Amgen scientists, the interest on this advanced analytical approach has shown an increasing growth within the biopharmaceutical industry. As the technique has progressed over the years, MAM is being increasingly used for routine PQA/CQA analysis of mAb-based molecules and this is being extended to other more complex biotherapeutics modalities as well outside of the QC laboratories, providing quick, critical, and insightful information during bioproduction, especially when using intact mass workflows. Although it is being consolidated in the research and development field, nowadays, the focus is still on the implementation in QC labs, which still poses some challenges, and requires the continuous and tight collaboration between biopharmaceutical developers and manufacturers, the research community and LC-MS instrument manufacturers.
Moving MAM to the next level will require the implementation of centralized data management systems which provide data security and integrity, increased performance by accelerating data processing and increased productivity by facilitating data sharing and information connectivity. It is important to highlight the need for a system suitability test which can ensure acceptable sample preparation and LC-MS analysis. The application of MAM also requires automated software platforms to help with extensive data acquisition and processing in all stages of the MAM approach. Finally, a successful NPD method should allow for sensitive and accurate detection of real changes and minimize false positives and false negatives which requires best practices in defining key parameters such as intensity threshold and fold change detection or ratio, as well as a community effort to create data libraries able to assist analysts in the determination of the alert level that newly identified peaks might initiate.
Authors contributions
SC, CJ, SMM and JB were involved in the conception and design of the review. SMM wrote the first draft. SC, CJ reviewed and edited the manuscript. JB edited the manuscript and was the academic lead. LG, KS, and KB wrote sections of the manuscript and contributed to the revision and editing. All authors contributed to manuscript revision, read, and approved the submitted version.
Disclosure statement
LG, KS, and KB are employees of Thermo Fisher Scientific. JB received funding to support undertaking this study as part of a funded collaboration between NIBRT and Thermo Fisher Scientific. SC, CJ and SMM are employed on this collaborative project at NIBRT. Beyond this, the authors are not aware of any affiliations, memberships, funding, or financial holdings that might be perceived as affecting the objectivity of this article. The authors declare no competing financial interests.
References
- Baedeker, M.; Ringel, M. S.; Schulze, U. 2021 FDA Approvals: Value Driven by COVID-19 Vaccines. Nat. Rev. Drug Discov. 2022, 21, 90. DOI: 10.1038/d41573-022-00015-3.
- Mullard, A. FDA Approves 100th Monoclonal Antibody Product. Nat. Rev. Drug Discov. 2021, 20, 491–495. DOI: 10.1038/d41573-021-00079-7.
- Mullard, A. 2021 FDA Approvals. Nat. Rev. Drug Discov. 2022, 21, 83–88. DOI: 10.1038/d41573-022-00001-9.
- Shu, S. A.; Wang, J.; Tao, M. H.; Leung, P. S. Gene Therapy for Autoimmune Disease. Clin. Rev. Allergy Immunol. 2015, 49, 163–176. DOI: 10.1007/s12016-014-8451-x.
- Islam, M. A.; Kundu, S.; Hassan, R. Gene Therapy Approaches in an Autoimmune Demyelinating Disease: Multiple Sclerosis. Curr. Gene Ther. 2020, 19, 376–385. DOI: 10.2174/1566523220666200306092556.
- Yasunaga, M. Antibody Therapeutics and Immunoregulation in Cancer and Autoimmune Disease. Semin. Cancer Biol. 2020, 64, 1–12. DOI: 10.1016/j.semcancer.2019.06.001.
- Shim, H. Bispecific Antibodies and Antibody-Drug Conjugates for Cancer Therapy: Technological Considerations. Biomolecules. 2020, 10, biom10030360. DOI: 10.3390/biom10030360.
- Kaplon, H.; Chenoweth, A.; Crescioli, S.; Reichert, J. M. Antibodies to Watch in 2022. MAbs. 2022, 14, 2014296. DOI: 10.1080/19420862.2021.2014296.
- Lee, K. P.; Koshelev, M. V.; Team, D. C.; Pacha, O, D3CODE Team The Effect of Biologic Therapy for Immune-Mediated Inflammatory Diseases on Clinical Outcomes of COVID-19 in the Greater Houston Area: A Retrospective Chart Review. J. Am. Acad. Dermatol. 2022, 87, 658–660.
- Das, T. K.; Narhi, L. O.; Sreedhara, A.; Menzen, T.; Grapentin, C.; Chou, D. K.; Antochshuk, V.; Filipe, V. Stress Factors in mAb Drug Substance Production Processes: Critical Assessment of Impact on Product Quality and Control Strategy. J. Pharm. Sci. 2020, 109, 116–133. DOI: 10.1016/j.xphs.2019.09.023.
- Wen, Y.; Jawa, V. The Impact of Product and Process Related Critical Quality Attributes on Immunogenicity and Adverse Immunological Effects of Biotherapeutics. J. Pharm. Sci. 2021, 110, 1025–1041. DOI: 10.1016/j.xphs.2020.12.003.
- Xu, Y.; Wang, D.; Mason, B.; Rossomando, T.; Li, N.; Liu, D.; Cheung, J. K.; Xu, W.; Raghava, S.; Katiyar, A.; et al. Structure, Heterogeneity and Developability Assessment of Therapeutic Antibodies. MAbs. 2019, 11, 239–264. DOI: 10.1080/19420862.2018.1553476.
- Beck, A.; Liu, H. Macro- and Micro-Heterogeneity of Natural and Recombinant IgG Antibodies. Antibodies 2019, 8, antib8010018. DOI: 10.3390/antib8010018.
- Yu, L. X.; Amidon, G.; Khan, M. A.; Hoag, S. W.; Polli, J.; Raju, G. K.; Woodcock, J. Understanding Pharmaceutical Quality by Design. Aaps J. 2014, 16, 771–783. DOI: 10.1208/s12248-014-9598-3.
- Lasdun, A. M.; Kurumbail, R. R.; Leimgruber, N. K.; Rathore, A. S. Validatibility of a Capillary Isoelectric Focusing Method for Impurity Quantitation. J. Chromatogr. A. 2001, 917, 147–158. DOI: 10.1016/s0021-9673(01)00662-8.
- Suba, D.; Urbanyi, Z.; Salgo, A. Capillary Isoelectric Focusing Method Development and Validation for Investigation of Recombinant Therapeutic Monoclonal Antibody. J. Pharm. Biomed. Anal. 2015, 114, 53–61. DOI: 10.1016/j.jpba.2015.04.037.
- Loughney, J. W.; Minsker, K.; Ha, S.; Rustandi, R. R. Development of an Imaged Capillary Isoelectric Focusing Method for Characterizing the Surface Charge of mRNA Lipid Nanoparticle Vaccines. Electrophoresis. 2019, 40, 2602–2609. DOI: 10.1002/elps.201900063.
- Racaityte, K.; Kiessig, S.; Kalman, F. Application of Capillary Zone Electrophoresis and Reversed-Phase High-Performance Liquid Chromatography in the Biopharmaceutical Industry for the Quantitative Analysis of the Monosaccharides Released from a Highly Glycosylated Therapeutic Protein. J. Chromatogr. A. 2005, 1079, 354–365. DOI: 10.1016/j.chroma.2005.03.080.
- Esterman, A. L.; Katiyar, A.; Krishnamurthy, G. Implementation of USP Antibody Standard for System Suitability in Capillary Electrophoresis Sodium Dodecyl Sulfate (CE-SDS) for Release and Stability Methods. J. Pharm. Biomed. Anal. 2016, 128, 447–454. DOI: 10.1016/j.jpba.2016.06.006.
- Hong, P.; Koza, S.; Bouvier, E. S. Size-Exclusion Chromatography for the Analysis of Protein Biotherapeutics and Their Aggregates. J. Liq. Chromatogr. Relat. Technol. 2012, 35, 2923–2950. DOI: 10.1080/10826076.2012.743724.
- Goyon, A.; Sciascera, L.; Clarke, A.; Guillarme, D.; Pell, R. Extending the Limits of Size Exclusion Chromatography: Simultaneous Separation of Free Payloads and Related Species from Antibody Drug Conjugates and Their Aggregates. J. Chromatogr. A. 2018, 1539, 19–29. DOI: 10.1016/j.chroma.2018.01.039.
- Fekete, S.; Beck, A.; Veuthey, J. L.; Guillarme, D. Ion-Exchange Chromatography for the Characterization of Biopharmaceuticals. J. Pharm. Biomed. Anal. 2015, 113, 43–55. DOI: 10.1016/j.jpba.2015.02.037.
- Trappe, A.; Fussl, F.; Carillo, S.; Zaborowska, I.; Meleady, P.; Bones, J. Rapid Charge Variant Analysis of Monoclonal Antibodies to Support Lead Candidate Biopharmaceutical Development. J. Chromatogr. B Analyt. Technol. Biomed. Life Sci. 2018, 1095, 166–176. DOI: 10.1016/j.jchromb.2018.07.037.
- Melmer, M.; Stangler, T.; Schiefermeier, M.; Brunner, W.; Toll, H.; Rupprechter, A.; Lindner, W.; Premstaller, A. HILIC Analysis of Fluorescence-Labeled N-Glycans from Recombinant Biopharmaceuticals. Anal. Bioanal. Chem. 2010, 398, 905–914. DOI: 10.1007/s00216-010-3988-x.
- Zhu-Shimoni, J.; Yu, C.; Nishihara, J.; Wong, R. M.; Gunawan, F.; Lin, M.; Krawitz, D.; Liu, P.; Sandoval, W.; Vanderlaan, M. Host Cell Protein Testing by ELISAs and the Use of Orthogonal Methods. Biotechnol. Bioeng. 2014, 111, 2367–2379. DOI: 10.1002/bit.25327.
- Apostol, I.; Bondarenko, P. V.; Ren, D.; Semin, D. J.; Wu, C.-H.; Zhang, Z.; Goudar, C. T. Enabling Development, Manufacturing, and Regulatory Approval of Biotherapeutics through Advances in Mass Spectrometry. Curr. Opin. Biotechnol. 2021, 71, 206–215. DOI: 10.1016/j.copbio.2021.08.001.
- Rogstad, S.; Faustino, A.; Ruth, A.; Keire, D.; Boyne, M.; Park, J. A Retrospective Evaluation of the Use of Mass Spectrometry in FDA Biologics License Applications. J. Am. Soc. Mass Spectrom. 2017, 28, 786–794. DOI: 10.1007/s13361-016-1531-9.
- Rogers, R. S.; Nightlinger, N. S.; Livingston, B.; Campbell, P.; Bailey, R.; Balland, A. Development of a Quantitative Mass Spectrometry Multi-Attribute Method for Characterization, Quality Control Testing and Disposition of Biologics. MAbs. 2015, 7, 881–890. DOI: 10.1080/19420862.2015.1069454.
- Rogers, R. S.; Abernathy, M.; Richardson, D. D.; Rouse, J. C.; Sperry, J. B.; Swann, P.; Wypych, J.; Yu, C.; Zang, L.; Deshpande, R. A View on the Importance of Multi-Attribute Method for Measuring Purity of Biopharmaceuticals and Improving Overall Control Strategy. Aaps J. 2017, 20, 7. DOI: 10.1208/s12248-017-0168-3.
- Xu, X.; Qiu, H.; Li, N. LC-MS Multi-Attribute Method for Characterization of Biologics. J. Appl. Bioanal. 2017, 3, 21–25. DOI: 10.17145/jab.17.003.
- Dong, J.; Migliore, N.; Mehrman, S. J.; Cunningham, J.; Lewis, M. J.; Hu, P. High-Throughput, Automated Protein a Purification Platform with Multiattribute LC-MS Analysis for Advanced Cell Culture Process Monitoring. Anal. Chem. 2016, 88, 8673–8679. DOI: 10.1021/acs.analchem.6b01956.
- Liu, Y.; Fernandez, J.; Pu, Z.; Zhang, H.; Cao, L.; Aguilar, I.; Ritz, D.; Luo, R.; Read, A.; Laures, A.; et al. Simultaneous Monitoring and Comparison of Multiple Product Quality Attributes for Cell Culture Processes at Different Scales Using a LC/MS/MS Based Multi-Attribute Method. J. Pharm. Sci. 2020, 109, 3319–3329. DOI: 10.1016/j.xphs.2020.07.029.
- Jakes, C.; Millán-Martín, S.; Carillo, S.; Scheffler, K.; Zaborowska, I.; Bones, J. Tracking the Behavior of Monoclonal Antibody Product Quality Attributes Using a Multi-Attribute Method Workflow. J. Am. Soc. Mass Spectrom. 2021, 32, 1998–2012. DOI: 10.1021/jasms.0c00432.
- Sokolowska, I.; Mo, J.; Rahimi Pirkolachahi, F.; McVean, C.; Meijer, L. A. T.; Switzar, L.; Balog, C.; Lewis, M. J.; Hu, P. Implementation of a High-Resolution Liquid Chromatography-Mass Spectrometry Method in Quality Control Laboratories for Release and Stability Testing of a Commercial Antibody Product. Anal. Chem. 2020, 92, 2369–2373. DOI: 10.1021/acs.analchem.9b05036.
- Evans, A. R.; Hebert, A. S.; Mulholland, J.; Lewis, M. J.; Hu, P. ID-MAM: A Validated Identity and Multi-Attribute Monitoring Method for Commercial Release and Stability Testing of a Bispecific Antibody. Anal. Chem. 2021, 93, 9166–9173. DOI: 10.1021/acs.analchem.1c01029.
- Hao, Z.; Moore, B.; Ren, C.; Sadek, M.; Macchi, F.; Yang, L.; Harris, J.; Yee, L.; Liu, E.; Tran, V.; et al. Multi-Attribute Method Performance Profile for Quality Control of Monoclonal Antibody Therapeutics. J. Pharm. Biomed. Anal. 2021, 205, 114330. DOI: 10.1016/j.jpba.2021.114330.
- Numao, E.; Yanagisawa, K.; Hosono, M.; Yagi, Y.; Nishimura, K.; Yamazaki, K. Development of a Comprehensive Approach for Performance Evaluation of a Quantitative Multi‑Attribute Method as a Quality Control Method. Anal. Sci. 2022, 38, 739–747. DOI: 10.1007/s44211-022-00090-x.
- Song, Y. E.; Dubois, H.; Hoffmann, M.; D Eri, S.; Fromentin, Y.; Wiesner, J.; Pfenninger, A.; Clavier, S.; Pieper, A.; Duhau, L.; Roth, U. Automated Mass Spectrometry Multi-Attribute Method Analyses for Process Development and Characterization of mAbs. J. Chromatogr. B Analyt. Technol. Biomed. Life Sci. 2021, 1166, 122540. DOI: 10.1016/j.jchromb.2021.122540.
- Ogata, Y.; Quizon, P. M.; Nightlinger, Pongkwan, N. S.; Sitasuwan, P.; Snodgrass, C.; Lee, L. A.; Meyer, J. D.; Rogers, R. S. eAutomated Multi-Attribute Method Sample Preparation Using High-Throughput Buffer Exchange Tips. Rapid Commun Mass Spectrom. 2021, 2021, e9222.
- Millán-Martín, S.; Jakes, C.; Carillo, S.; Buchanan, T.; Guender, M.; Kristensen, D. B.; Sloth, T. M.; Orgaard, M.; Cook, K.; Bones, J. Inter-Laboratory Study of an Optimised Peptide Mapping Workflow Using Automated Trypsin Digestion for Monitoring Monoclonal Antibody Product Quality Attributes. Anal. Bioanal. Chem. 2020, 412, 6833–6848. DOI: 10.1007/s00216-020-02809-z.
- Butré, C. I.; D’Atri, V.; Diemer, H.; Colas, O.; Wagner, E.; Beck, A.; Cianferani, S.; Guillarme, D.; Delobel, A. Interlaboratory Evaluation of a User-Friendly Benchtop Mass Spectrometer for Multiple-Attribute Monitoring Studies of a Monoclonal Antibody. Molecules. 2023, 28, 2855. DOI: 10.3390/molecules28062855.
- Zhang, Z.; Chan, P. K.; Richardson, J.; Shah, B. An Evaluation of Instrument Types for Mass Spectrometry-Based Multi-Attribute Analysis of Biotherapeutics. MAbs. 2020, 12, 1783062. DOI: 10.1080/19420862.2020.1783062.
- Arndt, J. R.; Wormwood Moser, K. L.; Van Aken, G.; Doyle, R. M.; Talamantes, T.; DeBord, D.; Maxon, L.; Stafford, G.; Fjeldsted, J.; Miller, B.; Sherman, M. High-Resolution Ion-Mobility-Enabled Peptide Mapping for High-Throughput Critical Quality Attribute Monitoring. J. Am. Soc. Mass Spectrom. 2021, 32, 2019–2032. DOI: 10.1021/jasms.0c00434.
- Yang, H.; Sato, M.; Quintyn, R.; Crone, C.; Kraegenbring, J.; Scheffler, K.; Du, M. An Integrated LC-MS System Performance Evaluation Test for Peptide Mapping and Monitoring, AN000336. Thermo Fisher Scientific, 2021. https://assets.thermofisher.com/TFS-Assets/CMD/Application-Notes/an-000336-lcms-protein-digest-peptide-mapping-monitoring-an000336-na-en.pdf.
- ThermoFisherScientific, HR Multi-Attribute Method: A comprehensive workflow for the assessment of critical quality attributes. BR72912-EN 0519M., 2019.
- Qian, C.; Niu, B.; Jimenez, R. B.; Wang, J.; Albarghouthi, M. Fully Automated Peptide Mapping Multi-Attribute Method by Liquid Chromatography-Mass Spectrometry with Robotic Liquid Handling System. J. Pharm. Biomed. Anal. 2021, 198, 113988. DOI: 10.1016/j.jpba.2021.113988.
- Bern, M.; Kil, Y. J.; Becker, C. Byonic: Advanced Peptide and Protein Identification Software. Curr. Protoc. Bioinform. 2012, 40, 13.20.1–13.20.14. DOI: 10.1002/0471250953.bi1320s40.
- Mesmin, C.; Manache-Alberici, L.; Jones, J. Validation of LC-MS Multi-Attribute Method (MAM) Supporting Biopharma Process Characterization. BioPharm International.com, 2020. https://www.biopharminternational.com/view/validation-lc-ms-multi-attribute-method-mam-supporting-biopharma-process-characterization.
- Mouchahoir, T.; Schiel, J. E.; Rogers, R.; Heckert, A.; Place, B. J.; Ammerman, A.; Li, X.; Robinson, T.; Schmidt, B.; Chumsae, C. M.; et al. New Peak Detection Performance Metrics from the MAM Consortium Interlaboratory Study. J. Am. Soc. Mass Spectrom. 2021, 32, 913–928. DOI: 10.1021/jasms.0c00415.
- Ranbaduge, N, Y. Y.Q Extending the Capabilities of the BioAccord LC-MS System with a Streamlined Workflow for Compliant-Ready Multi-Attribute Method (MAM), 720006963. WATERS 2020. https://www.waters.com/content/dam/waters/en/app-notes/2020/720006963/720006963-en.pdf.
- Zhang, Z.; Zhang, F.; McCarthy, S. Enabling Single-Software Multiple Attribute Methodology (MAM) for Assessment of Biopharmaceutical Product Quality Attributes. Application of BioPharmaView™ 3.0 Software for a Streamlined MAM Workflow. SCIEX 2017. https://sciex.com/content/dam/SCIEX/pdf/tech-notes/all/MAM-Overview.pdf.
- Buettner, A.; Maier, M.; Bonnington, L.; Bulau, P.; Reusch, D. Multi-Attribute Monitoring of Complex Erythropoetin Beta Glycosylation by GluC Liquid Chromatography-Mass Spectrometry Peptide Mapping. Anal. Chem. 2020, 92, 7574–7580. DOI: 10.1021/acs.analchem.0c00124.
- Guan, X.; Eris, T.; Zhang, L.; Ren, D.; Ricci, M. S.; Thiel, T.; Goudar, C. T. A High-Resolution Multi-Attribute Method for Product Characterization, Process Characterization, and Quality Control of Therapeutic Proteins. Anal. Biochem. 2022, 643, 114575. DOI: 10.1016/j.ab.2022.114575.
- Puranik, A.; Rasam, P.; Dandekar, P.; Jain, R. Development and Optimization of a LC-MS Based Multi-Attribute Method (MAM) Workflow for Characterization of Therapeutic Fc-Fusion Protein. Anal. Biochem. 2023, 660, 114969. DOI: 10.1016/j.ab.2022.114969.
- Rogers, R.; Swenson, S.; Khuu-Duong, K.; Zhang, T. Mass Spectrometry-Based Process Analytical Technologies for Cell Therapies; MAM Consortium, 2021. https://mamconsortium.org.
- Wang, T.; Lucey, J. A. Use of Multi-Angle Laser Light Scattering and Size-Exclusion Chromatography to Characterize the Molecular Weight and Types of Aggregates Present in Commercial Whey Protein Products. J. Dairy Sci. 2003, 86, 3090–3101. DOI: 10.3168/jds.S0022-0302(03)73909-5.
- ThermoFisherScientific, Orbitrap Exploris MX mass detector BR000169-EN 1021M. 2021.
- Yang, H.; Sato, M.; Quintyn, R.; Crone, C.; Kraegenbring, J.; Scheffler, K.; Du, M. The MAM 2.0 Workflow Enables Seamless Transition from Research and Development to Quality Control (AN000463); ThermoFisher Scientific, 2022. https://assets.thermofisher.com/TFS-Assets/CMD/Application-Notes/an-000463-lc-ms-mam-workflow-an000463-na-en.pdf.
- Millan-Martin, S.; Jakes, C.; Carillo, S.; Rogers, R.; Ren, D.; Bones, J. Comprehensive Multi-Attribute Method Workflow for Biotherapeutic Characterization and Current Good Manufacturing Practices Testing. Nat. Protoc. 2023, 18, 1056–1089. DOI: 10.1038/s41596-022-00785-5.
- Ren, D.; Pipes, G. D.; Liu, D.; Shih, L.-Y.; Nichols, A. C.; Treuheit, M. J.; Brems, D. N.; Bondarenko, P. V. An Improved Trypsin Digestion Method Minimizes Digestion-Induced Modifications on Proteins. Anal. Biochem. 2009, 392, 12–21. DOI: 10.1016/j.ab.2009.05.018.
- Wang, Y.; Li, X.; Liu, Y. H.; Richardson, D.; Li, H.; Shameem, M.; Yang, X. Simultaneous Monitoring of Oxidation, Deamidation, Isomerization, and Glycosylation of Monoclonal Antibodies by Liquid Chromatography-Mass Spectrometry Method with Ultrafast Tryptic Digestion. MAbs. 2016, 8, 1477–1486. DOI: 10.1080/19420862.2016.1226715.
- Xu, W.; Jimenez, R. B.; Mowery, R.; Luo, H.; Cao, M.; Agarwal, N.; Ramos, I.; Wang, X.; Wang, J. J. A Quadrupole Dalton-Based Multi-Attribute Method for Product Characterization, Process Development, and Quality Control of Therapeutic Proteins. MAbs. 2017, 9, 1186–1196. DOI: 10.1080/19420862.2017.1364326.
- Yang, Y.; Strahan, A.; Li, C.; Shen, A.; Liu, H.; Ouyang, J.; Katta, V.; Francissen, K.; Zhang, B. Detecting Low Level Sequence Variants in Recombinant Monoclonal Antibodies. MAbs. 2010, 2, 285–298. DOI: 10.4161/mabs.2.3.11718.
- Li, X.; Rawal, B.; Rivera, S.; Letarte, S.; Richardson, D. D. Improvements on Sample Preparation and Peptide Separation for Reduced Peptide Mapping Based Multi-Attribute Method Analysis of Therapeutic Monoclonal Antibodies Using Lysyl Endopeptidase Digestion. J. Chromatogr. A. 2022, 1675, 463161. DOI: 10.1016/j.chroma.2022.463161.
- Xu, C.; Khanal, S.; Pierson, N. A.; Quiroz, J.; Kochert, B.; Yang, X.; Wylie, D.; Strulson, C. A. Development, Validation, and Implementation of a Robust and Quality Control-Friendly Focused Peptide Mapping Method for Monitoring Oxidation of co-Formulated Monoclonal Antibodies. Anal. Bioanal. Chem. 2022, 414, 8317–8330. DOI: 10.1007/s00216-022-04366-z.
- Stavenhagen, K.; Gahoual, R.; Dominguez-Vega, E.; Palmese, A.; Hipgrave-Ederveen, A. L.; Cutillo, F.; Palinsky, W.; Bierau, H.; Wuhrer, M. Site-Specific N- and O-Glycosylation Analysis of Atacicept. MAbs. 2019, 11, 1053–1063. DOI: 10.1080/19420862.2019.1630218.
- Guapo, F.; Strasser, L.; Millán-Martín, S.; Anderson, I.; Bones, J. Fast and Efficient Digestion of Adeno Associated Virus (AAV) Capsid Proteins for Liquid Chromatography Mass Spectrometry (LC-MS) Based Peptide Mapping and Post Translational Modification Analysis (PTMs). J. Pharm. Biomed. Anal. 2022, 207, 114427. DOI: 10.1016/j.jpba.2021.114427.
- Sitasuwan, P.; Powers, T. W.; Medwid, T.; Huang, Y.; Bare, B.; Lee, L. A. Enhancing the Multi-Attribute Method through an Automated and High-Throughput Sample Preparation. MAbs. 2021, 13, e1978131. DOI: 10.1080/19420862.2021.1978131.
- Kristensen, D. B.; Orgaard, M.; Sloth, T. M.; Christoffersen, N. S.; Leth-Espensen, K. Z.; Jensen, P. F. Optimized Multi-Attribute Method Workflow Addressing Missed Cleavages and Chromatographic Tailing/Carry-Over of Hydrophobic Peptides. Anal. Chem. 2022, 94, 17195–17204. DOI: 10.1021/acs.analchem.2c03820.
- Liu, Y.; Zhang, C.; Chen, J.; Fernandez, J.; Vellala, P.; Kulkarni, T. A.; Aguilar, I.; Ritz, D.; Lan, K.; Patel, P.; Liu, A. A Fully Integrated Online Platform for Real Time Monitoring of Multiple Product Quality Attributes in Biopharmaceutical Processes for Monoclonal Antibody Therapeutics. J. Pharm. Sci. 2022, 111, 358–367. DOI: 10.1016/j.xphs.2021.09.011.
- Ren, D. Advancing Mass Spectrometry Technology in cGMP Environments. Trends Biotechnol. 2020, 38, 1051–1053. DOI: 10.1016/j.tibtech.2020.06.007.
- ThermoFisherScientific, Thermo Scientific SIEVE Software for Differential Expression Analysis BR63141_E12/09S. 2009.
- Millán-Martín, S.; Carillo, S.; Jakes, C.; Yang, H.; Sato, M.; Quintyn, R.; Crone, C.; Kraegenbring, J.; Scheffler, K.; Du, M.; Bones, B. Development of a Robust Multi-Attribute Method Suitable for Implementation in a QC environment (AN000753); ThermoFisher Scientific, 2022. https://assets.thermofisher.com/TFS-Assets/CMD/Application-Notes/an-000753-lc-hram-ms-multi-attribute-method-quality-control-an000753-na-en.pdf.
- Liu, H.; Quintyn, R.; Rontree, J. A High-Resolution Accurate Mass Multi-Attribute Method for Critical Quality Attribute Monitoring and New Peak Detection (AN72916). ThermoFisher Scientific, 2019. https://assets.thermofisher.com/TFS-Assets/CMD/Application-Notes/an-72916-lc-ms-multi-attribute-method-cqa-mab-an72916-en.pdf.
- Rogers, R. Implementation of a Quantitative Mass Spectrometry Multi-Attribute Method (MAM) for Characterization, Quality Control Testing and Disposition of Biotherapeutics (Just Biotherapeutics); MAM Consortium, 2016. https://mamconsortium.org.
- Carvalho, S. B.; Gomes, R. A.; Pfenninger, A.; Fischer, M.; Strotbek, M.; Isidro, I. A.; Tugc, U. N.; Gomes-Alves, P. Multi Attribute Method Implementation Using a High Resolution Mass Spectrometry Platform: From Sample Preparation to Batch Analysis. PLoS One. 2022, 17, e0262711. DOI: 10.1371/journal.pone.0262711.
- Niu, B.; Lu, Y.; Chen, X.; Xu, W. Using New Peak Detection to Solve Sequence Variants Analysis Challenges in Bioprocess Development. J. Am. Soc. Mass Spectrom. 2023, 34, 401–408. DOI: 10.1021/jasms.2c00292.
- Sadek, M.; Moore, B. N.; Yu, C.; Ruppe, N.; Abdun-Nabi, A.; Hao, Z.; Alvarez, M.; Dahotre, S.; Deperalta, G. A Robust Purity Method for Biotherapeutics Using New Peak Detection in an LC-MS-Based Multi-Attribute Method. J. Am. Soc. Mass Spectrom. 2023, 34, 484–492. DOI: 10.1021/jasms.2c00355.
- Yan, Y.; Xing, T.; Wang, S.; Li, N. Versatile, Sensitive, and Robust Native LC-MS Platform for Intact Mass Analysis of Protein Drugs. J. Am. Soc. Mass Spectrom. 2020, 31, 2171–2179. DOI: 10.1021/jasms.0c00277.
- Vimer, S.; Ben-Nissan, G.; Sharon, M. Mass Spectrometry Analysis of Intact Proteins from Crude Samples. Anal. Chem. 2020, 92, 12741–12749. DOI: 10.1021/acs.analchem.0c02162.
- Jones, J.; Pack, L.; Hunter, J. H.; Valliere-Douglass, J. F. Native Size-Exclusion Chromatography-Mass Spectrometry: Suitability for Antibody-Drug Conjugate Drug-to-Antibody Ratio Quantitation across a Range of Chemotypes and Drug-Loading Levels. MAbs. 2020, 12, 1682895. DOI: 10.1080/19420862.2019.1682895.
- Fussl, F.; Strasser, L.; Carillo, S.; Bones, J. Native LC-MS for Capturing Quality Attributes of Biopharmaceuticals on the Intact Protein Level. Curr. Opin. Biotechnol. 2021, 71, 32–40. DOI: 10.1016/j.copbio.2021.05.008.
- Carillo, S.; Criscuolo, A.; Fussl, F.; Cook, K.; Bones, J. Intact Multi-Attribute Method (iMAM): A Flexible Tool for the Analysis of Monoclonal Antibodies. Eur. J. Pharm. Biopharm. 2022, 177, 241–248. DOI: 10.1016/j.ejpb.2022.07.005.
- Liu, P.; Zhu, X.; Wu, W.; Ludwig, R.; Song, H.; Li, R.; Zhou, J.; Tao, L.; Leone, A. M. Subunit Mass Analysis for Monitoring Multiple Attributes of Monoclonal Antibodies. Rapid Commun. Mass Spectrom. 2019, 33, 31–40. DOI: 10.1002/rcm.8301.
- Lanter, C.; Lev, M.; Cao, L.; Loladze, V. Rapid Intact Mass Based Multi-Attribute Method in Support of mAb Upstream Process Development. J. Biotechnol. 2020, 321, 96. DOI: 10.1016/j.jbiotec.2020.04.001.
- Carillo, S.; Jakes, C.; Fussl, F.; Sutton, J.; Kraegenbring, J.; Crone, C.; Scheffler, K.; Bones, J. At-Line Monoclonal Antibody Analysis using Affinity-Chromatography with Mass Spectrometry Detection and Fully Compliant Data Acquisition and Processing. 69th ASMS 2021., 2021.
- Jakes, C.; Füssl, F.; Zaborowska, I.; Bones, J. Rapid Analysis of Biotherapeutics Using Protein a Chromatography Coupled to Orbitrap Mass Spectrometry. Anal. Chem. 2021, 93, 13505–13512. DOI: 10.1021/acs.analchem.1c02365.
- Martelet, A.; Garrigue, V.; Zhang, Z.; Genet, B.; Guttman, A. Multi-Attribute Method Based Characterization of Antibody Drugconjugates (ADC) at the Intact and Subunit Levels. J. Pharm. Biomed. Anal. 2021, 201, 1.
- Chen, T. H.; Yang, Y.; Zhang, Z. R.; Fu, C. X.; Zhang, Q. Y.; Williams, J. D.; Wirth, M. J. Native Reversed-Phase Liquid Chromatography: A Technique for LCMS of Intact Antibody-Drug Conjugates. Anal. Chem. 2019, 91, 2805–2812. DOI: 10.1021/acs.analchem.8b04699.
- Deslignière, E.; Ehkirch, A.; Botzanowski, T.; Beck, A.; Hernandez-Alba, O.; Cianférani, S. Toward Automation of Collision-Induced Unfolding Experiments through Online Size Exclusion Chromatography Coupled to Native Mass Spectrometry. Anal. Chem. 2020, 92, 12900–12908. DOI: 10.1021/acs.analchem.0c01426.
- Fussl, F.; Cook, K.; Scheffler, K.; Farrell, A.; Mittermayr, S.; Bones, J. Charge Variant Analysis of Monoclonal Antibodies Using Direct Coupled pH Gradient Cation Exchange Chromatography to High-Resolution Native Mass Spectrometry. Anal. Chem. 2018, 90, 4669–4676. DOI: 10.1021/acs.analchem.7b05241.
- Yan, Y.; Xing, T.; Wang, S.; Daly, T. J.; Li, N. Online Coupling of Analytical Hydrophobic Interaction Chromatography with Native Mass Spectrometry for the Characterization of Monoclonal Antibodies and Related Products. J. Pharm. Biomed. Anal. 2020, 186, 113313. DOI: 10.1016/j.jpba.2020.113313.
- Gargano, A. F. G.; Roca, L. S.; Fellers, R. T.; Bocxe, M.; Dominguez-Vega, E.; Somsen, G. W. Capillary HILIC-MS: A New Tool for Sensitive Top-Down Proteomics. Anal. Chem. 2018, 90, 6601–6609. DOI: 10.1021/acs.analchem.8b00382.
- Carillo, S.; Jakes, C.; Bones, J. In-Depth Analysis of Monoclonal Antibodies Using Microfluidiccapillary Electrophoresis and Native Mass Spectrometry. J. Pharm. Biomed. 2020, 185, 1.
- McDowall, R. D. Practical Computer Validation for Pharmaceutical Laboratories. J. Pharm. Biomed. Anal. 1995, 14, 13–22. DOI: 10.1016/0731-7085(95)01629-5.
- Hussain, K. A Practical Approach to Computerized System Validation. In Handbook of Research on Distributed Medical Informatics and E-Health; Athina A. Lazakidou and Konstantinos M. Siassiakos, Eds.; IGI Global, 2009; pp. 456–469. DOI: 10.4018/978-1-60566-002-8.ch032.
- Forsberg, K.; Mooz, H. The Relationship of System Engineering to the Project Cycle. In INCOSE International Symposium; Wiley Online Library: Hoboken, NJ, USA, 1991; Volume 1, pp. 57–65. DOI: 10.1002/j.2334-5837.1991.tb01484.x.
- eCFR:211.165, 21 CFR 211.165 -Testing and release for distribution. Available at https://www.ecfr.gov/current/title-21/chapter-I/subchapter-C/part-211/subpart-I/section-211.165.,. 2023.
- eCFR:211.194, 21 CFR 211.194 - Laboratory records. https://www.ecfr.gov/current/title-21/chapter-I/subchapter-C/part-211/subpart-J/section-211.194.,. 2023.
- Rogstad, S.; Yan, H.; Wang, X.; Powers, D.; Brorson, K.; Damdinsuren, B.; Lee, S. Multi-Attribute Method for Quality Control of Therapeutic Proteins. Anal. Chem. 2019, 91, 14170–14177. DOI: 10.1021/acs.analchem.9b03808.
- FDA, Quality Considerations for the Multi-Attribute Method (MAM) for Therapeutic Proteins. https://www.fda.gov/science-research/fda-grand-rounds/quality-considerations-multi-attribute-method-mam-therapeutic-proteins-10132022. 2022.
- EFPIA Use of Multi Attribute Method by Mass Spectrometry as a QC Release and Stability Tool for Biopharmaceuticals – Regulatory Considerations. European Federation of Pharmaceutical Industries and Associations (EFPIA) 2022. https://www.efpia.eu/media/676706/efpia-regulatory-position-paper_mam-as-qc-tool_final.pdf.
- USP, https://www.usp.org/news/us-pharmacopeia-awarded-fda-funding-to-create-a-multi-attribute-method-knowledge-base. 2022.