Abstract
Gas chromatography (GC) is crucial for measuring atmospheric halogenated greenhouse gases (hGHGs), usually coupled with electron capture detector (ECD, with higher sensitivity) or mass spectrometry (MS, with higher selectivity). This review compares GC-ECD and GC-MS for analyzing atmospheric hGHGs in terms of analytical methodology, performance, and instrumentation. For hGHGs such as SF6, chlorofluorocarbons, and N2O, ECD can be employed in the single column, forecut-backflush (FCBF), and preconcentration methods. The order of appearance of SF6 and N2O is an important consideration for selecting the separation column to avoid chromatographic interference from the long-tailed N2O and O2 on SF6. Single column and FCBF GC-ECD methods suffer from nonlinear responsivity, but the preconcentration method can compensate for nonlinearity. The last method also offers a low drift, which eliminates the need for multipoint calibration and enables perfect linearity at atmospheric SF6 levels. GC-MS demonstrates strong separability and identification capabilities, and over 60 hGHGs can be qualitatively analyzed by leveraging the separation power of MS and established MS databases. However, GC-MS requires a preconcentrator operating at −165 °C utilizing specialized adsorbents. Two notable preconcentrator-GC-MS systems, Medusa-GC-MS and detachable trap preconcentrator (DTP) GC-MS, differ in trap design, temperature scheme, and separation column type. Medusa-GC-MS employs a three-phased temperature operation before MS. DTP-GC-MS separates the preconcentration cycle into highly and less volatile compounds, using a different temperature scheme from that of Medusa-GC-MS. The preconcentrator-GC-MS system is widely employed for measuring perfluorocarbons, hydrofluorocarbons, and other hGHGs. This method necessitates multiple adsorption traps to discriminate the most abundant air components.
1. Introduction
The Kyoto Protocol regulates the emissions of major chlorofluorocarbons (CFCs), specifically CFC-11, CFC-12, and CFC-113. As a result, their global concentrations have decreased substantially.[Citation1] However, the emissions of other anthropogenic halogenated greenhouse gases (hGHGs) such as SF6, NF3, CF4, and hydrofluorocarbons (HFCs) have been increasing, leading to an increase in their ambient concentrations.[Citation1,Citation2] the Advanced Global Atmospheric Gases Experiment (AGAGE) has continuously monitored 44 species globally since 1978.[Citation3] In addition, the National Oceanic and Atmospheric Administration (NOAA) have published monitoring data of 60 species under the Halocarbons & other Atmospheric Trace Species (HATS) program since 1978.[Citation4] Extensive studies on inverse estimation using long-term data from the AGAGE and the HATS have demonstrated the ability to accurately determine local and global emissions.[Citation5–16] To reduce the overall greenhouse effect, researchers also tried to substitute widely used chemicals that have a high global warming potential (GWP) with those having a low GWP. These low-GWP alternatives are associated with unsaturated HFC derivatives with functional groups such as nitryl, ether, carbonyl, and carboxyl.[Citation17–20] Clearly, highly sensitive and selective measurement methods are crucial for monitoring the ambient levels of these hGHGs as well as their low-GWP alternatives.[Citation21] Gas chromatography (GC) coupled to either mass spectrometry (MS) or electron capture detector (ECD) is a suitable method for analyzing ambient hGHGs, due to its high sensitivity to these compounds. In this review, we provide an overview of GC-ECD and GC-MS methodologies for measuring ambient levels of hGHGs. GC-ECD is known for its high sensitivity for atmospheric SF6 and CFCs, making it ideal for background-level monitoring of these compounds. Additionally, the integration of a cryogenic preconcentrator often enhances linearity and long-term stability of the GC-ECD system. GC-MS also has the capability to measure most of these compounds. Because it exhibits a lower sensitivity compared to GC-ECD, a preconcentration unit is required to improve its performance in analyzing atmospheric hGHGs. Unfortunately, designing a preconcentration unit for GC-MS is more complex, and it requires a higher cryogenic power to compensate for the lower sensitivity as well as to discriminate physisorbed air components such as N2, O2, Ar, CO2, and Kr. Nevertheless, it is worthwhile to construct a preconcentration system, considering GC-MS’s capability of qualitative analysis and universal detection. The following sections describe various GC-ECD and GC-MS measurement methodologies, highlighting the advantages and disadvantages of each based on previous publications by the Korea Research Institute of Standards and Science (KRISS), National Oceanic and Atmospheric Administration (NOAA), and Scripps Institution of Oceanography (SIO).
2. GC-ECD
2.1. Single column method
Atmospheric SF6 was measured using GC-ECD with a Molecular 5 Å (MS-5A) column.[Citation22] The retention order of SF6 was faster than that of O2, which had long tails. A carrier gas consisting of 5% CH4/Ar (P5 gas) was used, and the system exhibited moderate sensitivity to CO2.[Citation23,Citation24] Since ECD is also sensitive to the ambient level of N2O (∼400 nmol/mol and exhibiting long tail), an important consideration is ensuring its separability from SF6 (∼10 pmol/mol). Hall et al. proposed several analytical methods that utilized GC-ECD with a Porapak-Q (PP-Q) column, which is a single column (SC) method. CO2 was introduced into the N2 carrier gas to minimize interference between the early-eluting CO2 and the subsequently eluting N2O.[Citation25] Hall et al. added an MS-5A as a postcolumn to achieve the elution order of SF6, N2O, and CO2, ensuring that SF6 eluted before N2O. This approach eliminated interference between SF6 and the long-tailed N2O peak ().[Citation27] Lim et al. employed an activated alumina-F1 (AA-F1) column with GC-μECD to measure SF6 ().[Citation28] With AA-F1, the order of elution was SF6 followed by N2O. This method simplified the column configuration because it did not require a postcolumn for the early appearance of SF6, unlike the method of Hall et al.
Figure 1. Representative chromatograms of working gases obtained using (a) the SC method, (b) the FCBF method, and (c) the preconcentration method. The inset in (c) shows chromatograms measured by the preconcentration method with varying desorption temperature set at 200 °C (blue), 150 °C (red), and 100 °C (green). Tailing effects were observed at lower desorption temperatures due to significant interactions between the adsorbent (Carboxen 1000) and the absorbates (SF6 and N2O). The chemical selectivity of Carboxen 1000 resulted in a diminished area of the oxygen peak in the preconcentration method compared to the conventional method. The signal-to-noise ratio for the three methods was 220, 280, and 3480, respectively. Adapted from ref. [Citation26] with permission from the copyright holder.
![Figure 1. Representative chromatograms of working gases obtained using (a) the SC method, (b) the FCBF method, and (c) the preconcentration method. The inset in (c) shows chromatograms measured by the preconcentration method with varying desorption temperature set at 200 °C (blue), 150 °C (red), and 100 °C (green). Tailing effects were observed at lower desorption temperatures due to significant interactions between the adsorbent (Carboxen 1000) and the absorbates (SF6 and N2O). The chemical selectivity of Carboxen 1000 resulted in a diminished area of the oxygen peak in the preconcentration method compared to the conventional method. The signal-to-noise ratio for the three methods was 220, 280, and 3480, respectively. Adapted from ref. [Citation26] with permission from the copyright holder.](/cms/asset/7660b0fa-9a30-4172-a83d-0ae698718e1a/batc_a_2302576_f0001_c.jpg)
Table 1. Summary of analytical conditions for measuring atmospheric level SF6 using various methods. Adapted from ref. [Citation26] with permission from the copyright holder.
2.2. Forecut-backflush method
In the SC method, the long-tailed O2 peak interferes with the peaks of SF6 (when using AA-F1) or N2O (when using Porapak-Q), thereby reducing the measurement precision. To overcome these limitations, the heart-cut and back-flush technique can be employed for measuring ambient SF6 and N2O, as suggested by Hall et al.[Citation27] In this approach, the fastest eluent O2 is forecut (heart-cut) before reaching ECD, which holds it for an extended period and prevents it from interfering with the ionization of SF6 (). In the forecut-backflush (FCBF) method, the GC-μECD system consists of multiposition valves. shows one example of the FCBF method from KRISS,[Citation26] which combines 4-port and 10-port valves. It could be compared with NOAA method,[Citation27] which has the different working mechanism and identical functionalities. A PP-Q precolumn (80/100 mesh, 1.8 m × 3.2 mm, Restek) is utilized, along with a PP-Q main column (80/100 mesh, 3.7 m × 3.2 mm, Restek) and an MS-5A postcolumn (1.8 m × 3.2 mm, Restek) (). The peak of O2 (the fastest eluent) is forecut before entering the detector in step (b). In this step, the 10-port valve is changed to the “Off” state to connect the main column to the vent. A moment later, in step (c) the 4-port valve is changed to the “On” state to connect the main column to the detector. In step (d) for the backflush of late-eluting CFCs, the 10-port valve is switched back to the “Off” state for the CFCs. The CFCs are kept in the precolumn to be vented. In contrast to the SC method, a frit filter as a flow restrictor was patched at the detector vent. Restriction in analyte flow in the detector cavity, dwelling time of the analyte increased to enhance detection sensitivity. Though the sampling volume of the FCBF method was a factor of five lower than that of the SC method, the flow restrictor effectively increased the detection sensitivity. In addition, decreasing the make-up gas flow might be another source to increase sensitivity. But this effect seemed to be minor and hardly distinguishable from the contribution by the frit filter.
Figure 2. Detailed configuration of gas flows illustrating the working mechanism of the FCBF method used at KRISS.[Citation26] The NOAA method[Citation27] is different from that of the KRISS, but the configuration should have identical functionalities. (a) In the preparation stage, the sample flow (black line) is vented out through the sample loop and the carrier gas flow (red line) is vented out through the PP-Q precolumn, while the other carrier gas flows (green line) into the detector through the PP-Q main column to maintain detector activity. (b) In the forecut stage, sample in the sample loop is injected into the separation columns (precolumn and main column), and oxygen is vented out (‘forecut’) before reaching the postcolumn MS-5A. (c) In the injection stage, the target gases (SF6 and N2O) are injected into the detector. The elution times of N2O and SF6 are independently controlled by adjusting the temperature of the MS-5A postcolumn. (d) In the backflush step, CFCs in the precolumn are allowed to vent out in the reverse direction to the detector (“backflush”). Further details on the analytical conditions can be found in . Adapted from ref. [Citation26] with permission from the copyright holder.
![Figure 2. Detailed configuration of gas flows illustrating the working mechanism of the FCBF method used at KRISS.[Citation26] The NOAA method[Citation27] is different from that of the KRISS, but the configuration should have identical functionalities. (a) In the preparation stage, the sample flow (black line) is vented out through the sample loop and the carrier gas flow (red line) is vented out through the PP-Q precolumn, while the other carrier gas flows (green line) into the detector through the PP-Q main column to maintain detector activity. (b) In the forecut stage, sample in the sample loop is injected into the separation columns (precolumn and main column), and oxygen is vented out (‘forecut’) before reaching the postcolumn MS-5A. (c) In the injection stage, the target gases (SF6 and N2O) are injected into the detector. The elution times of N2O and SF6 are independently controlled by adjusting the temperature of the MS-5A postcolumn. (d) In the backflush step, CFCs in the precolumn are allowed to vent out in the reverse direction to the detector (“backflush”). Further details on the analytical conditions can be found in Table 1. Adapted from ref. [Citation26] with permission from the copyright holder.](/cms/asset/f4a12cb8-be57-4844-94b9-0ec9aec0c28d/batc_a_2302576_f0002_c.jpg)
2.3. Preconcentration method
The cryogenic preconcentrator is utilized to increase the concentration of the analyte. While a bare GC-ECD system is sufficient for detecting atmospheric levels of SF6 and CFCs, the addition of a preconcentrator can improve the signal-to-noise ratio (SNR). A preconcentrator-GC-μECD system developed by our research group consisted of two 6-port multiposition valves, two solenoid valves (open/close), a three-way valve, and an adsorption trap filled with Carboxen 1000 (80/100 mesh, 140 mg, Supelco) integrated into the refrigerator ().[Citation26] The gas line was purged with high-purity helium (>99.999%). A sampling volume of SF6 in the preconcentration trap was preserved, because O2 and N2 have minimal adsorptivity on Carboxen 1000 at the designated temperature of −50 to −30 °C. During the flushing step, residual O2 and N2 in the adsorption trap were vented out using helium. This design has the advantage of discriminating atmospheric O2 without the forecut step (which might disturb the measurement precision). Meanwhile, the sample for the next measurement could be preconcentrated while the previous sample is processed in the GC part, resulting in a measurement time similar to that of the FCBF method. The precolumn and main column were separated for the backflushing of CFCs. AA-F1 was used in both the precolumn (80/100 mesh, 1.8 m × 3.2 mm, Restek) and the main column (80/100 mesh, 3.7 m × 3.2 mm, Restek). The steering of gas flows was similar to that of the FCBF method. The precolumn held late eluents such as the CFCs. The forecut process was not required due to the chemical selectivity of the Carboxen 1000 adsorbent.
Figure 3. Depiction of the working mechanism of the preconcentrator in each step: (a) ready, (b) preconcentration, (c) flushing, (d) desorption, (e) injection, and (f) purge. Colored lines represent the connectivity of SF6 (green) and helium (blue) lines to the trap or the separation column. Red lines represent the carrier gas, helium. The precolumn served as a holder of the late eluents such as CFCs to be backflushed. Adapted from ref. [Citation26] with permission from the copyright holder.
![Figure 3. Depiction of the working mechanism of the preconcentrator in each step: (a) ready, (b) preconcentration, (c) flushing, (d) desorption, (e) injection, and (f) purge. Colored lines represent the connectivity of SF6 (green) and helium (blue) lines to the trap or the separation column. Red lines represent the carrier gas, helium. The precolumn served as a holder of the late eluents such as CFCs to be backflushed. Adapted from ref. [Citation26] with permission from the copyright holder.](/cms/asset/ba4e2c4a-3369-40fd-954f-6613bda09c81/batc_a_2302576_f0003_c.jpg)
2.4. Nonlinear responsivity
ECD is known for its nonlinear responsivity to SF6, requiring the construction of a calibration curve that typically follows a second-order polynomial to cover the full range of atmospheric concentrations.[Citation29] It is widely acknowledged that the detection sensitivities of ECDs may deviate from the typical linearity, exhibiting curvatures that depend on the specific device.[Citation27,Citation28] Therefore, complicated calibration procedure and internal consistency of calibration standards were highly required for accurate measurement and long-term monitoring. Note that because ECD is highly sensitive to CFCs, dedicated measurement of SF6 using GC-ECD requires baking out the late-eluting CFCs or back-flushing them. Shortening the total elapsed time can help reduce measurement errors due to drift. However, under the specified operational parameters of the GC-µECD dedicated to the home-built preconcentrator (), a linear responsivity to SF6 against the preconcentration volume (= flow rate × preconcentration time) was observed (). The sample flow rate of the 11.925 pmol/mol SF6 in air, used as a working standard, was varied at 20, 40, 60, and 80 mL/min, translating into increasing preconcentration volume or, in turn, concentrations. By increasing the preconcentration volume, well-linearized responses of SF6 were achieved up to 48 pmol/mol. After conducting these tests, sample flow rate and preconcentration time were chosen as the central values, 40 mL/min and 5 min, respectively, within the tested ranges.
Figure 4. (a) SF6 response (peak area) for 11.925 pmol/mol SF6 in air as the working gas, as a function of the sample flow rate for preconcentration. (b) SF6 response as a function of preconcentration time at a flow rate of 40 mL/min. The preconcentration volume is also indicated in the upper x-axis. Both tests demonstrated well-linearized responses of SF6 across a wide range of preconcentration volumes. The measurement repeatability among the data points did not show significant variations, and some of the error bars representing repeatability may not be visible due to their small size. The overall repeatability is less than 0.1%. Adapted from ref. [Citation26] with permission from the copyright holder.
![Figure 4. (a) SF6 response (peak area) for 11.925 pmol/mol SF6 in air as the working gas, as a function of the sample flow rate for preconcentration. (b) SF6 response as a function of preconcentration time at a flow rate of 40 mL/min. The preconcentration volume is also indicated in the upper x-axis. Both tests demonstrated well-linearized responses of SF6 across a wide range of preconcentration volumes. The measurement repeatability among the data points did not show significant variations, and some of the error bars representing repeatability may not be visible due to their small size. The overall repeatability is less than 0.1%. Adapted from ref. [Citation26] with permission from the copyright holder.](/cms/asset/814b9bb6-d5c2-45e6-8a90-df6cca0c95b2/batc_a_2302576_f0004_c.jpg)
Linear behavior of the preconcentration method is attributed to the compensatory effect of increased flexibility in the amount-of-analyte, contrasting with the nonlinearity observed in the bare GC-ECD methods (SC and FCBF methods).[Citation29] Detection sensitivity, correlated with linearity, can be adjusted using the detector temperature and gas flow within the cavity of µECD. To showcase the adjustability of sensitivity and nonlinearity, two extreme detector conditions were tested. An increase in detector temperature enhances detection sensitivity, whereas an increase in gas flow (make-up gas flow and carrier gas flow) at the detector cavity reduces sensitivity. Case 1 (380 °C, 1 mL/min make-up gas flow, 80 psi carrier gas flow, and 80 ml/min sample flow rate) and Case 2 (350 °C, 15 mL/min make-up gas flow, 95 psi carrier gas flow, and 100 mL/min sample flow rate) exhibited well-linearized responses against gravimetric SF6 concentration, though Case 1 showed better linearity (). Given that the detector parameters for both cases significantly diverged to each limit, it suggests that nonlinear behavior can be manifested by adjusting preconcentration volume in any detector parameters. As the response behavior of ECD (sensitivity and linearity) varies among individual instruments, optimizing linearity condition is a subject of each laboratory’s own task. Given the complexity of calibration strategies with a nonlinearly responding instrument across a range of analyte concentrations, the linear characteristics identified in this study with the preconcentration method offer advantages. These advantages include enabling a simple calibration scheme as well as a drift correction scheme.
Figure 5. Responsivity tests conducted in the cases of high detector temperature/low gas flow (Case 1) and low detector temperature/high gas flow (Case 2). Both cases show well-linearized responses against SF6 concentration, though a linearity in the case 1 was better. Note that detector parameters significantly diverged to operable extremes. Adapted from ref. [Citation26] with permission from the copyright holder.
![Figure 5. Responsivity tests conducted in the cases of high detector temperature/low gas flow (Case 1) and low detector temperature/high gas flow (Case 2). Both cases show well-linearized responses against SF6 concentration, though a linearity in the case 1 was better. Note that detector parameters significantly diverged to operable extremes. Adapted from ref. [Citation26] with permission from the copyright holder.](/cms/asset/f87f44eb-f682-4926-b076-bccdadd3c981/batc_a_2302576_f0005_c.jpg)
2.5. Limit of detection and measurement precision
The limit of detection (LOD) is a critical parameter for assessing measurement capability, particularly when dealing with atmospheric concentrations of hGHGs that can reach extremely low levels (e.g. a few pmol/mol). To capture the temporal and regional variations in hGHG concentrations, the required measurement precision can be as small as 1/1000 or 1/100 of the annual variations. GC-ECD or GC-μECD methods can generally achieve the necessary measurement precision for SF6. A reasonably low LOD (at the sub pmol/mol level for SF6, for instance) is crucial for assessing SF6 impurity in the raw gases such as O2 and N2 that serve as the matrix. Improving the uncertainty of the impurity assessment is essential to minimize the uncertainty in the amount fraction of the measurand (SF6).[Citation29] According to ISO 6142, any undetected impurity concentration and its associated uncertainty in the raw gases are solely determined by the LOD. Therefore, reducing the LOD is key for obtaininglow uncertainty and unbiased concentration values of reference materials. For instance, the uncertainty arising from impurity analysis of SF6 is comparable to that of gravimetric preparation.[Citation29] Considering the limited scope for improving gravimetric uncertainty using existing weighing technology, the establishment of sensitive measurement methods or techniques with low LODs becomes a major pathway for reducing uncertainty in the gravimetric preparation of standards. In ref. [Citation26], the LOD of the SC method was determined to be 0.03 pmol/mol while that of the FCBF method was 0.02 pmol/mol, based on a linear fit of measurement data around the expected LODs. Similar LOD values were obtained in ref. [Citation26], because the separation methods did not significantly impact detection sensitivity. The difference in LOD values between these two methods can be solely attributed to the instrument. On the other hand, the preconcentration method exhibited an LOD of 0.008 pmol/mol. Since the detector operating conditions (detector temperature and makeup gas flow rate) were set identically between the FCBF and the preconcentration methods, the improved SNR and LOD of the latter method can be solely attributed to the preconcentration technique.
The measurement precision of the SC method was determined to be 0.17% at 1σ, while the FCBF method exhibited a slightly better repeatability of 0.14% at 1σ due to its higher SNR. One reason for the better precision of the FCBF method is the absence of oxygen interference due to the forecutting process.[Citation27] Another factor contributing to the compromise in measurement precision with the SC method is the instability of the oven temperature. This instability arises from the frequent heating-up and cooling-down of the column during the baking process for venting out late-appearing CFCs. Furthermore, the typical total run time of the SC method (50 min) is twice as long as that of the FCBF method, which contributes to its lower repeatability. The preconcentration method demonstrated improved measurement repeatability (0.08% from 10 consecutive measurements) due to its high SNR of 15,241, which is approximately 10 times higher than the other two methods. The enhanced response helps overcome fluctuations in the detector baseline. The repeatability of the preconcentrator could have a minor impact on the overall repeatability, but the net contribution is negligible. Additionally, the preconcentration method exhibits a lack of oxygen due to the chemical selectivity of Carboxen 1000. The absence of oxygen in the μECD detector contributes to the improved precision in SF6 measurement.[Citation26]
2.6. Responsivity drift
To assess the long-term instrumental drift of each method, the measurement systems were tested simultaneously at the same laboratory conditions to ensure that they were subjected to identical environmental factors. In , the normalized sensitivity for the three methods over time is represented by dotted lines. In , and , the red lines represent the slow drift component, which was separated from the randomly scattered values within a short time window. present the residuals of each measurement value from the moving average. The normal distribution of the residuals (side panels) confirms that the measurement precision was governed by random effects. The corresponding standard deviations (1σ) for each method were determined to be 0.22%, 0.20%, and 0.05%, respectively, which were equivalent to the repeatability test conducted using 10 consecutive measurements as described in the previous section. In all three methods, the normalized sensitivities of each measurement displayed an inverse relationship with the laboratory pressure (), while there was a less significant correlation with the laboratory temperature (). Note that an absolute comparison cannot be made due to the use of independent detectors in each method. Instead, the precision-to-drift ratio (p/d ratio) was used to compare these methods. The p/d ratios for the conventional, FCBF, and preconcentration methods were determined to be 0.10, 0.11, and 0.03, respectively. The preconcentration method exhibited a superior p/d ratio compared with the other methods, suggesting that this method can serve as an effective alternative for reference-gas-free drift correction. As illustrated in , the correlation between sensitivity and laboratory pressure for SF6 in the preconcentration method exhibits superiority, as indicated by a standard deviation of residuals at 0.14% () from the moving average fit of sensitivity drift (). This implies the potential utility of laboratory pressure as a reference for drift correction in SF6 measurement (drift-corrected sensitivity = sensitivity/lab pressure) when employing the preconcentration method. In addition, this method may not require multipoint calibration, considering that the preconcentrator-GC-µECD system equipped with Carboxen 1000 adsorbent demonstrated superior linearity for atmospheric levels of SF6 ().
Figure 6. Normalized sensitivity as a function of time for (a) the SC method (△), (c) the FCBF method (□), and (e) the preconcentration method with sample flow rate of 40 mL/min for 5 min and (○). (b), (d), and (f) The corresponding residuals from the moving average, which is marked by the red line (―). The standard deviations of the residuals (1σ) are 0.22%, 0.20%, and 0.05%, respectively, and they are presented as histograms in the side panels. Changes in the laboratory pressure and temperature are also depicted in (g) and (h), respectively. Gravimetric gas mixtures (SF6 in air) with the concentrations of 13.29 (D232832), 11.93 (D442241), and 11.93 pmol/mol (D442234) were used as the working standards for the conventional method, FCBF method, and preconcentration method, respectively. Adapted from ref. [Citation26] with permission from the copyright holder.
![Figure 6. Normalized sensitivity as a function of time for (a) the SC method (△), (c) the FCBF method (□), and (e) the preconcentration method with sample flow rate of 40 mL/min for 5 min and (○). (b), (d), and (f) The corresponding residuals from the moving average, which is marked by the red line (―). The standard deviations of the residuals (1σ) are 0.22%, 0.20%, and 0.05%, respectively, and they are presented as histograms in the side panels. Changes in the laboratory pressure and temperature are also depicted in (g) and (h), respectively. Gravimetric gas mixtures (SF6 in air) with the concentrations of 13.29 (D232832), 11.93 (D442241), and 11.93 pmol/mol (D442234) were used as the working standards for the conventional method, FCBF method, and preconcentration method, respectively. Adapted from ref. [Citation26] with permission from the copyright holder.](/cms/asset/b2b39e01-8582-4928-b3ce-09534992dbb1/batc_a_2302576_f0006_c.jpg)
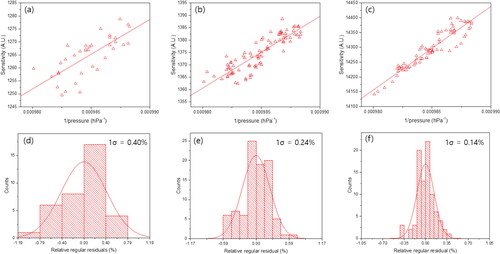
Figure 7. Correlation between sensitivities of the (a) conventional method, (b) FCBF method, (c) preconcentration method and ‘‘1 over laboratory pressure’’ (P−1). Inversely proportional behavior between laboratory pressure and sensitivities is clearly observed. The Pearson’s R values for (a), (b), and (c) are 0.73, 0.88, and 0.94, respectively. Respective standard deviations (1s) of relative regular residuals are (d) 0.40%, (e) 0.24%, and (f) 0.14%.
3. GC-MS coupled with the preconcentrator
3.1. Overview
Simmonds et al. developed a Peltier-cooled preconcentration technique coupled with GC-MS.[Citation30] The AGAGE initiated in-situ trace gas measurements using the adsorption-desorption system (ADS) at the remote field locations of Mace Head in Ireland in 1994 and Cape Grim in Tasmania in 1998.[Citation31] Equipped with a single-stage preconcentration trap at −50 °C, the ADS employed a mixture of two strong Carboxen adsorbents (Supelco, Bellefonte, PA, USA) to quantitatively trap the most volatile analytes. This ADS system closely resembles the preconcentrator designed for GC-ECD described in the previous section.[Citation32] However, perfluorocarbons (PFCs), SF6, and low-boiling point HFCs showed breakthrough on the trap when using a nominal sample size of 2 L.
The Medusa-GC-MS system expanded the analyte range to include compounds with higher volatility (e.g. CF4 with a boiling point of −128 °C) while maintaining the capability to analyze those with higher boiling points (e.g. CHBr3 with a boiling point of +149 °C).[Citation33] This was achieved through a balanced combination of cooling temperatures (−165 °C) and relatively mild adsorbents (HayeSep D) with controlled removal of interfering air components (O2, N2, Ar, CO2, Kr, etc.). The AGAGE program started field operations of the Medusa instrument in 2003, and those systems are operational at all five AGAGE remote field stations.[Citation31] Three more systems are currently under construction at SIO and the University of Bristol. Inspired by Medusa-GC-MS, our group developed the detachable trap preconcentrator (DTP) with GC-MS by utilizing Cryotiger PT-14 (Brooks Automation, USA).[Citation21] However, because Cryotiger PT-16 used in the Medusa-GC-MS system offers a higher cooling power than Cryotiger PT-14, our preconcentration trap was detached during heating, in contrast to the Medusa-GC-MS system.[Citation33] The ability to detach the preconcentration trap compensated for the insufficient cooling power of the DTP-GC-MS. The DTP-GC-MS system operated at a cooling temperature of −135 °C and identified 11 hGHGs, whereas the Medusa-GC-MS operated at −165 °C and detected 60 atmospheric hGHGs. The instrumental design for gas flow manipulation was very similar between the two systems, while the design and temperature control methods for the cold fingers, types of adsorbents, and separation columns differed (). A key component common to both systems was the customized multiposition valve, which was used to set three different gas flow configurations and greatly simplify the entire gas manifold (). The lowest trap temperature in DTP-GC-MS was −135 °C. Otherwise, the temperature scheme was similar to that of Medusa-GC-MS, although DTP-GC-MS separated the measurement cycle into highly volatile and less volatile compounds.[Citation21] The following sections will discuss the differences between the Medusa-GC-MS and DTP-GC-MS systems, particularly in the trap design, temperature scheme, and types of separation columns. The other notable preconcentration system was described by Florian Obersteiner et al.[Citation34] This system was powered by a Stirling cooler, maintaining a cooling temperature at −80 °C, and had the advantage of not requiring a liquid refrigerant or cryogen refilling. With no moving parts, it exhibited remarkable robustness and reliable operation. The working principle of Florian’s preconcentrator closely resembled that of the Medusa-GC-MS and the DTP-GC-MS. However, Florian’s preconcentrator utilized a single preconcentration trap, which limited its preconcentration efficiency, being resulting also by a relatively higher cooling temperature (−80 °C) compared to the Medusa-GC-MS and the DTP-GC-MS (−165 °C). In the subsequent sections, the discussion will focus on the Medusa-GC-MS and the DTP-GC-MS, providing a detailed comparison of their working mechanisms, component specifics, and analytical performance.
Figure 8. (a) Configuration details of DTP-GC-MS. The five multiposition valves are denoted as V1, V2, V3, V4, and V5, while the traps are referred to as T1 and T2. The default positions of V1, V2, V3, V4, and V5 are indicated below their respective symbols as (Off, Off, Off, Off, 2). The gas flow pathways at V5 are depicted in (b), (c), and (d). The carrier gas (helium) is purified and then directed through the purifier, with its flow rate controlled by the electric pressure controllers (EPC1 and EPC2). The sample flow rate is adjusted using the mass flow controller (MFC) and located upstream of T1. A combined precolumn filled sequentially with MS-5A and HiSiv 3000 is utilized to separate CF4 and other interfering substances before the analyte is transferred to the main column at T2. When measuring NF3, the combined precolumn is bypassed to prevent NF3 removal by HiSiv 3000. CO2 is selectively desorbed in T1, which is set to a temperature of –75 °C, and then vented out before transfer to T2. The flow meters are referred to as FM1 and FM2. The gas flow pathways of V5 correspond to positions (1), (2), and (3), indicated in panels (b), (c), and (d), respectively. For easy reference, connected lines are in the same color in the diagram. Adapted from ref. [Citation21] with permission from the copyright holder.
![Figure 8. (a) Configuration details of DTP-GC-MS. The five multiposition valves are denoted as V1, V2, V3, V4, and V5, while the traps are referred to as T1 and T2. The default positions of V1, V2, V3, V4, and V5 are indicated below their respective symbols as (Off, Off, Off, Off, 2). The gas flow pathways at V5 are depicted in (b), (c), and (d). The carrier gas (helium) is purified and then directed through the purifier, with its flow rate controlled by the electric pressure controllers (EPC1 and EPC2). The sample flow rate is adjusted using the mass flow controller (MFC) and located upstream of T1. A combined precolumn filled sequentially with MS-5A and HiSiv 3000 is utilized to separate CF4 and other interfering substances before the analyte is transferred to the main column at T2. When measuring NF3, the combined precolumn is bypassed to prevent NF3 removal by HiSiv 3000. CO2 is selectively desorbed in T1, which is set to a temperature of –75 °C, and then vented out before transfer to T2. The flow meters are referred to as FM1 and FM2. The gas flow pathways of V5 correspond to positions (1), (2), and (3), indicated in panels (b), (c), and (d), respectively. For easy reference, connected lines are in the same color in the diagram. Adapted from ref. [Citation21] with permission from the copyright holder.](/cms/asset/4b06e7ad-13b8-4a7c-90c0-eb630b16bd0a/batc_a_2302576_f0008_c.jpg)
3.2. Medusa-GC-MS
Sample analysis using Medusa-GC-MS involved three phases of temperature operation. In the first phase, the sample was introduced into the inlet and preconcentrated at a low temperature on the first trap (T1) at −165 °C. In the second phase, by heating T1 to −65 °C, the most volatile analytes (such as NF3 and CF4) and residual air components (mostly N2, O2, Ar, and Kr) were transferred to a second trap (T2) cooled at −165 °C for refocusing. This left behind the less volatile analytes and most of the CO2 on T1. Following their desorption, NF3, CF4, and remaining air components were separated on a precolumn before transfer to the main column in the GC oven. T2 was flushed at −115 °C to reduce bulk air components other than CO2. After the transfer was complete, T2 was isolated and heated to +100 °C to be completely flushed, and then cooled down to −165 °C again. In the third phase, compounds that still remained on T1 were desorbed at +100 °C during the analyte transfer for refocusing on T2 at −100 °C. Finally, the analytes were desorbed and transported to the main column for separation before the mass spectrometer. This sequential transfer between highly volatile greenhouse gases (GHGs) (NF3 and CF4) and remaining analytes is necessary because abundant gas species from bulk air in the sample (including O2, N2, Kr, Ar, and CO2) must be carefully separated from the highly volatile NF3 and CF4.[Citation33,Citation35]
The adsorbent used for T1 was HayeSep D (200 mg, 100/120 mesh), which retained the hGHGs. This adsorbent was held in place by silanized glass wool and a piece of tightly rolled no. 200 mesh stainless steel wire cloth (length: 2.5 cm). These components also provided cooled surfaces for weak absorption of compounds that have higher boiling points. The refocusing trap T2 contained HayeSep D (5.5 mg) held by packing stops made of stainless steel. The standoffs were attached to a copper baseplate, which in turn was cooled by the cold-end of the Cryotiger PT-16. The standoffs were designed to restrict thermal flow between the trap and the baseplate/cold-end assembly, allowing independent temperature control of the two traps. A high temperature (100 °C) was achieved by resistive heating of the trap tube itself at a low voltage and high current. Thermocouples were affixed to the standoffs and baseplate with Omega 200 (Omega Engineering, USA), an epoxy with high thermal conductivity and a wide temperature range tolerance. A thick hard-anodized layer on the standoff electrically isolated it from the heating voltage in the trap tubing, while a polyetheretherketone (PEEK) union downstream in the gas line electrically floated the traps. The entire assembly was contained in a high-vacuum chamber to prevent thermal flow through the air and maintain cooling efficiency.
The precolumn and main column used in both Medusa-GC-MS (ver. 1) and DTP-GC-MS were custom micro-packed columns. The precolumn contained MS-4A + HiSiv 3000, and the main column contained Porabond Q. In the later version of Medusa-GC-MS (ver. 2), an upgrade was made to enhance the sensitivity to NF3 by replacing HiSiv 3000 in the precolumn with a Gaspro PLOT column, because HiSiv 3000 helps promote the separation power of O2, N2, CH4, Kr, CO2, and CF4 but strongly adsorbs NF3.[Citation35] The instrumental details are summarized in .
Table 2. Summary of instrumental parameters of Medusa-GC-MS and DTP-GC-MS. Adapted from ref. 21 with permission from the copyright holder.
3.3. DTP-GC-MS
The traps in the DTP-GC-MS system could be set at temperatures ranging from −135 °C to 100 °C. A differential trapping method was employed to remove a significant portion of major interfering substances such as CO2, Kr, N2, and O2, ensuring a sufficient sampling volume for T2. Initially, all gases were adsorbed in T1, which was maintained at −135 °C. Then, the temperature of T1 was set to −75 °C for selective desorption of a substantial amount of CO2, which could be vented out. Any remaining CO2 was chromatographically separated in the main column of Porabond Q. At the same time, major air components such as N2 and O2 were also vented out before transferring the analytes to T2. This step played a crucial role in breaking the gas seal and preventing pressure shock induced by the rapid release of interfering substances when the temperature of T1 ramped up at a rate exceeding 100 °C/min. When the traps were heated to 125 °C to facilitate the desorption of all absorbed gases, it was detached from the cold-end to prevent heat transfer to the freezer and other traps. Such detachment improved the stability of temperature control and the cooling rate.
HayeSep D was used as the adsorbent, with 120 mg of it loaded in T1 and 10 mg in T2. The precolumn was filled with MS-4A (50 mg, 100/120 mesh) followed by HiSiv 3000 (200 mg, 100/120 mesh). The precolumn was utilized to separate CF4 from interfering gases such as N2, O2, Ar, Kr, CH4, and CO2. Specifically, an excess of CO2 was back-flushed with the aid of strong retention in MS-4A. However, when measuring NF3, the precolumn was bypassed in the flow path due to the NF3 removal characteristics of HiSiv 3000. To address the interference caused by CO2 resulting from the bypass of MS-4A, partial venting was introduced, and its efficiency was determined by the transfer temperature.
A cold-end was attached to the Cryotiger PT-14, which has a cooling capacity of 30 − 50% at −160 °C compared to that of the PT-16 used in the Medusa-GC-MS system. This configuration required the detachable trap to interrupt the thermal flow from the heated trap to the cold-end. Although the ground-state temperature of the baseplate could reach as low as −145 °C, it was maintained at −135 °C during continuous measurements.[Citation21] In contrast to the Medusa-GC-MS, the baseplates for the two traps in the DTP-GC-MS system were divided into two parts. Each baseplate had two grooves to establish tight contact with the straight adsorption tube, where thermocouples and a cartridge heater were welded (). However, the temperatures of the two traps could interfere with each other during the T1-T2 transfer period, potentially leading to a loss of adsorption efficiency. To address this, the trap was physically detached using air-actuated linear motions (L-2171-1, Huntington Mechanical Laboratories) when it was heated above 0 °C. For cooling to the background temperature or maintaining a moderate temperature, the trap was pushed toward the baseplate and reattached. A polymer union placed between the arm of linear motion and the trap served to block incoming and outgoing heat through the linear motion. This setup allowed the temperature of the baseplate to remain at the background level of −135 °C even when the trap was heated to 200 °C, ensuring sufficient cooling power for quick cooling. Due to the limited cooling power, consecutive transfers of NF3 followed by HFCs, which were required to maintain T1 at −75 °C during the transfer, were conducted in separate cycles. The linear motion and the detachable traps were separated by a polymer union made of fiberglass laminate (G10, Glass epoxy) to prevent heat transfer from the chamber wall to the cold traps.
Figure 9. View of the detachable preconcentration trap. (a) The baseplate is divided into two parts to prevent heat transfer from the heated trap. Two grooves are provided for secure attachment of the trap unit, which consists of the adsorbent line and the heating cartridge. Thermocouples are welded on the rear side of the baseplate. The trap unit is connected to the arm of the linear motion system with a polymer union, which effectively blocks incoming and outgoing heat through the linear motion. (b) In the “On” state, the trap is pushed toward the baseplate and securely attached for cooling or maintaining a moderate temperature. (c) The “Off” state. Adapted from ref. [Citation21] with permission from the copyright holder.
![Figure 9. View of the detachable preconcentration trap. (a) The baseplate is divided into two parts to prevent heat transfer from the heated trap. Two grooves are provided for secure attachment of the trap unit, which consists of the adsorbent line and the heating cartridge. Thermocouples are welded on the rear side of the baseplate. The trap unit is connected to the arm of the linear motion system with a polymer union, which effectively blocks incoming and outgoing heat through the linear motion. (b) In the “On” state, the trap is pushed toward the baseplate and securely attached for cooling or maintaining a moderate temperature. (c) The “Off” state. Adapted from ref. [Citation21] with permission from the copyright holder.](/cms/asset/5115511f-52b1-4fc0-ae0d-bad798845177/batc_a_2302576_f0009_c.jpg)
3.4. Detection capability
The mass spectrometer enables qualitative analysis of measurands by utilizing a MS database. Therefore, GC-MS provides two-dimensional separability based on the retention time and mass-to-charge ratio (m/z). illustrates an unseparated peak (peak h) that actually consisted of two chemical species. The more abundant species with a faster retention time exhibited heavier fragments (40–45 m/z), while the less abundant species with a slower retention time exhibited lighter fragments (35–40 m/z). Due to a lack of match in the MS database, the shoulder peak in this study could not be assigned. However, these two peaks can be distinguished in the selective ion mode (SIM), and the m/z scanning mode can greatly assist the qualitative analysis of unknown samples by providing initial assignments. While CO2, despite being highly abundant, was initially discriminated during the preconcentration stage, it eventually broke through and appeared in the mass spectrometer. Nevertheless, successful chromatographic and mass spectrometric separations from the early-appearing species NF3 were confirmed in the DTP-GC-MS, particularly when utilizing Porabond-Q.[Citation21] When the GasPro column was employed, as in the Medusa-GC-MS (ver. 2), the retention time of CO2 was separated from the earlier-appearing group (CH4, Kr, CF4, and NF3).[Citation35] However, mass spectrometric separation was capable of distinguishing individual species. The use of Nafion in the Medusa-GC-MS enabled the discrimination of water before the preconcentration stage. Alternatively, a chemical trap, such as Mg(ClO)4, could be employed for water removal. Chemical traps pose challenges in continuous measurement systems like the Medusa-GC-MS, as they require frequent replacement with fresh agents. The confirmed detectable species for the DTP-GC-MS totaled 14, including NF3, utilizing a scanning mode without m/z = 14, 16, 17, 18, 28, 29, 32, and 44. () In contrast, the Medusa-GC-MS (ver. 2) reported the capability to measure over 57 species, encompassing NF3, CF4 and CHBr3, using the SIM mode specifically set to the target species. Notably, while the latest eluent of the DTP-GC-MS with a Porabond-Q column was CH3CClF2, the Medusa-GC-MS (ver. 1) utilizing the same Porabond-Q column additionally detected 16 species appearing after CH3CClF2. Additionally, the detection of emerging hGHGs at trace levels can be achieved using GC-MS coupled with the preconcentrator. For example, HFO-1234yf (peak g) was detected on the Korean Peninsula using the scanning mode and clearly resolved in the SIM mode. If calibration standards are available, the preconcentrator-GC-MS method may provide new evidence regarding the emission of emerging, traced, and potentially hidden GHGs in a quantitative manner as studied by Vollmer et al.Citation36
Figure 10. Mass spectra according to the retention time of the total ion chromatogram (TIC) (top) and analytes (bottom). m/z = 14, 16, 17, 18, 28, 29, 32, and 44 were blinded with a high baseline to facilitate peak identification (see text). (a) PFC-218 (CF2CFCF2) and HFC-143a (CH3CF3), (b) Hexafluoropropylene (CF3CF = CF2), (c) HFC-134a (CH2FCF3), (d) HCFC-22 (CHClF2), (e) Combined peaks of 3,3,3-trifluoropropyne (CF3C2H) and HFC-245ca (CH2FCF2CHF2), (f) Propene (CH3CH = CH2), (g) HFO-1234yf (CH2=CFCF), (h) Chloromethane (CH3Cl), i: HFC-1243zf (CH2=C2HF3), (j) CFC-12 (CCl2F2), and (k) HCFC-142b (C2H3ClF2). Adapted from ref. [Citation21] with permission from the copyright holder.
![Figure 10. Mass spectra according to the retention time of the total ion chromatogram (TIC) (top) and analytes (bottom). m/z = 14, 16, 17, 18, 28, 29, 32, and 44 were blinded with a high baseline to facilitate peak identification (see text). (a) PFC-218 (CF2CFCF2) and HFC-143a (CH3CF3), (b) Hexafluoropropylene (CF3CF = CF2), (c) HFC-134a (CH2FCF3), (d) HCFC-22 (CHClF2), (e) Combined peaks of 3,3,3-trifluoropropyne (CF3C2H) and HFC-245ca (CH2FCF2CHF2), (f) Propene (CH3CH = CH2), (g) HFO-1234yf (CH2=CFCF), (h) Chloromethane (CH3Cl), i: HFC-1243zf (CH2=C2HF3), (j) CFC-12 (CCl2F2), and (k) HCFC-142b (C2H3ClF2). Adapted from ref. [Citation21] with permission from the copyright holder.](/cms/asset/f51c9c0a-4d61-4231-b906-e51ef1fe95cf/batc_a_2302576_f0010_c.jpg)
Long-term atmospheric NF3 measurements in directly sampled air were conducted using Medusa-GC-MS (ver. 2), achieving a precision of less than 2% (1σ) with a 2 L sampling volume.[Citation35] DTP-GC-MS was also used to measure NF3 in synthetic air gas mixtures with well-controlled compositions (i.e., without CO2 or H2O), providing a precision of less than 0.35% (1σ) with a 2 L sampling volume (). However, a direct comparison between the reported precisions of Medusa-GC-MS and DTP-GC-MS is not feasible, due to the inclusion of long-term drift and uncertainty from the calibration standard. There is an opportunity to improve the LOD of DTP-GC-MS for NF3 by changing the precolumn from HiSiv 3000 to the Gaspro and replacing the cryo-cooler. As discussed above, HiSiv 3000 tends to adsorb more NF3 compared to the Gaspro column. The cooling unit of DTP-GC-MS (Cryotiger PT-16) also has a lower cooling power than that of Medusa-GC-MS (Cryotiger PT-14).[Citation21]
Figure 11. Sensitivity in DTP-GC-MS as a function of NF3 concentration. A gravimetric mixture of 5 pmol/mol NF3 in air was diluted with 99.9999% N2 using N2-calibrated MFCs. The gray line represents the confidence band (2σ) of normal distributions centered at each measured value. At 1 pmol/mol, the confidence band was widened by 3σ. The LOD was evaluated to be 0.21 pmol/mol. Adapted from ref. [Citation21] with permission from the copyright holder.
![Figure 11. Sensitivity in DTP-GC-MS as a function of NF3 concentration. A gravimetric mixture of 5 pmol/mol NF3 in air was diluted with 99.9999% N2 using N2-calibrated MFCs. The gray line represents the confidence band (2σ) of normal distributions centered at each measured value. At 1 pmol/mol, the confidence band was widened by 3σ. The LOD was evaluated to be 0.21 pmol/mol. Adapted from ref. [Citation21] with permission from the copyright holder.](/cms/asset/5d49a890-f074-420b-bd41-6d15d3d5134a/batc_a_2302576_f0011_b.jpg)
4. Conclusions
GC methodologies for measuring ambient levels of hGHGs were reviewed here, with ECD and MS as the typical detection units. Packed columns such as PP-Q and AA-F1 have been widely used for the separation of hGHGs, particularly SF6 and CFCs when using an ECD. In the case of MS, a capillary form of the PP-Q column (Porabond Q) has been employed for the separation of PFCs and HFCs. GC-ECD demonstrates high sensitivities in detecting atmospheric SF6 and CFCs (typically at pmol/mol levels), making it superior for monitoring their background levels. However, the interference of atmospheric N2O (∼400 nmol/mol) with a long tail in the chromatogram must be addressed when using PP-Q columns. This can be achieved through temperature control of the column oven or the use of an additional column (MS-5A) to reverse the retention order of N2O and SF6. The AA-F1 column provides a simpler solution to this problem, due to its inherently reversed order of N2O and SF6 within the PP-Q. Another important consideration is the interference from O2, which is intense in the ECD and can disrupt the measurement precision of SF6. To mitigate this interference, a forecut of the initial appearance of O2 is necessary. Forecutting O2 in the separation column means that it does not stay in the detector cavity, thus avoiding the long tail. Another method to eliminate O2 interference is using a preconcentrator based on Carboxen 1000, which lacks chemical selectivity toward O2. Additionally, the preconcentration method offers improved SNR for SF6 by increasing the sampling volume. It can also provide better linearity in its response to SF6.[Citation26] Typically, multi-reference standards are used to construct a calibration curve for interpolating the “true value” of unknown samples. Good linearity enables a simple calibration procedure using a single standard instead of multiple ones. For analyzing atmospheric CFCs using GC-ECD, it is important to note that their retention times are very long when using the aforementioned PP-Q, AA-F1, and MS-5A columns. When the measurement focuses on SF6, back-flushing is required to avoid bake-out, which can cause oven temperature instability and worsen the measurement stability.
GC-MS coupled with a preconcentrator is widely used to measure PFCs, HFCs, and other hGHGs that GC-ECD is also sensitive to. Since the bare GC-MS is not sufficiently sensitive to detect atmospheric levels of PFCs, HFCs, and hGHGs, the use of a preconcentration unit is essential. However, achieving cryogenic conditions for the preconcentrator in GC-MS is more challenging compared to the case of GC-ECD. Therefore, multiple adsorption traps are required to discriminate against the most abundant air components. Extremely low temperatures are also needed in the preconcentrator to activate physisorption of air components that do not readily attach to adsorbents such as HayeSep D. Precise adjustment of the trap temperatures during the transfer process is a key to ensure higher sampling volumes for the measurands compared to the air components. In Medusa-GC-MS, the trap is heated by either Joule heating or a cartridge heater. The Joule heating method helps minimize the heating volume, since the adsorption trap is directly heated using a high-current-low-voltage power source. Standoffs on the baseplate, which is attached to the cold-end of the cooler, enable the maintenance of the baseplate temperature. In DTP-GC-MS, the cooling power of the cooler is lower than that of Medusa-GC-MS, necessitating detachment of the adsorption trap from the baseplate during trap heating. While the baseline temperature of DTP-GC-MS is higher than that of Medusa-GC-MS, the former is capable of measuring atmospheric levels of HFCs. However, only the Medusa-GC-MS method underwent an evaluation of measurement quality for a period exceeding a year, providing long-term monitoring data for HFCs, PFCs, and hGHGs in the atmosphere.[Citation3] In contrast, the focus of the DTP-GC-MS was directed toward measuring synthetic gas. To enable its application in long-term monitoring, it is essential to enhance the durability of the trap. The effectiveness of this approach has been demonstrated by the long application history of Medusa-GC-MS at remote sites for GHG baseline monitoring. The detachability of the adsorption trap suggests further possible advancements in using Medusa-GC-MS to measure hGHGs.
Author contributions
Conceptualization: Jeong Sik Lim; Writing – Original Draft: Jeong Sik Lim; Writing – Review & Editing: Noh soo Han and Jeong Sik Lim; Visualization: Noh Soo Han, Supervision: Jeong Sik Lim.
Disclosure statement
No potential conflict of interest was reported by the authors.
Additional information
Funding
References
- Lickley, M.; Solomon, S.; Fletcher, S.; Velders, G. J. M.; Daniel, J.; Rigby, M.; Montzka, S. A.; Kuijpers, L. J. M.; Stone, K. Quantifying Contributions of Chlorofluorocarbon Banks to Emissions and Impacts on the Ozone Layer and Climate. Nat. Commun. 2020, 11, 1380. DOI: 10.1038/s41467-020-15162-7.
- Prinn, R. G.; Weiss, R. F.; Arduini, J.; Arnold, T.; DeWitt, H. L.; Fraser, P. J.; Ganesan, A. L.; Gasore, J.; Harth, C. M.; Hermansen, O.; et al. History of Chemically and Radiatively Important Atmospheric Gases from the Advanced Global Atmospheric Gases Experiment (AGAGE). Earth Syst. Sci. Data 2018, 10, 985–1018. DOI: 10.5194/essd-10-985-2018.
- Prinn, R. G.; Weiss, R. F.; Arduini, J.; Arnold, T.; Fraser, P. J.; Ganesan, A. L.; Gasore, J.; Harth, C. M.; Hermansen, O.; Kim, J.; et al. The ALE/GAGE/AGAGE Data Base. http://agage.mit.edu/data.
- The Halocarbon & other Atmospheric Trace Species (HATS) program. https://gml.noaa.gov/hats/
- Mühle, J.; Kuijpers, L. J. M.; Stanley, K. M.; Rigby, M.; Western, L. M.; Kim, J.; Park, S.; Harth, C. M.; Krummel, P. B.; Fraser, P. J.; et al. Global Emissions of Perfluorocyclobutane (PFC-318, c-C4F8) Resulting from the Use of Hydrochlorofluorocarbon-22 (HCFC-22) Feedstock to Produce Polytetrafluoroethylene (PTFE) and Related Fluorochemicals. Atmos. Chem. Phys. 2022, 22, 3371–3378. DOI: 10.5194/acp-22-3371-2022.
- Velders, G. J. M.; Daniel, J. S.; Montzka, S. A.; Vimont, I.; Rigby, M.; Krummel, P. B.; Muhle, J.; O'Doherty, S.; Prinn, R. G.; Weiss, R. F.; Young, D. Projections of Hydrofluorocarbon (HFC) Emissions and the Resulting Global Warming Based on Recent Trends in Observed Abundances and Current Policies. Atmos. Chem. Phys. 2022, 22, 6087–6101. DOI: 10.5194/acp-22-6087-2022.
- Western, L. M.; Redington, A. L.; Manning, A. J.; Trudinger, C. M.; Hu, L.; Henne, S.; Fang, X.; Kuijpers, L. J. M.; Theodoridi, C.; Godwin, D. S.; et al. A Renewed Rise in Global HCFC-141b Emissions between 2017–2021. Atmos. Chem. Phys. 2022, 22, 9601–9616. DOI: 10.5194/acp-22-9601-2022.
- Rust, D.; Katharopoulos, I.; Vollmer, M. K.; Henne, S.; O'Doherty, S.; Say, D.; Emmenegger, L.; Zenobi, R.; Reimann, S. Swiss Halocarbon Emissions for 2019 to 2020 Assessed from Regional Atmospheric Observations. Atmos. Chem. Phys. 2022, 22, 2447–2466. DOI: 10.5194/acp-22-2447-2022.
- Choi, H.; Park, M.-K.; Fraser, P. J.; Park, H.; Geum, S.; Mühle, J.; Kim, J.; Porter, I.; Salameh, P. K.; Harth, C. M.; et al. Top-down and Bottom-up Estimates of Anthropogenic Methyl Bromide Emissions from Eastern China. Atmos. Chem. Phys. 2022, 22, 5157–5173. DOI: 10.5194/acp-22-5157-2022.
- Park, S.; Western, L. M.; Saito, T.; Redington, A. L.; Henne, S.; Fang, X.; Prinn, R. G.; Manning, A. J.; Montzka, S. A.; Fraser, P. J.; et al. A Decline in Emissions of CFC-11 and Related Chemicals from Eastern China. Nature 2021, 590, 433–437. DOI: 10.1038/s41586-021-03277-w.
- Rigby, M.; Park, S.; Saito, T.; Western, L. M.; Redington, A. L.; Fang, X.; Henne, S.; Manning, A. J.; Prinn, R. G.; Dutton, G. S.; et al. Increase in CFC-11 Emissions from Eastern China Based on Atmospheric Observations. Nature 2019, 569, 546–550. DOI: 10.1038/s41586-019-1193-4.
- Montzka, S. A.; Dutton, G. S.; Portmann, R. W.; Chipperfield, M. P.; Davis, S.; Feng, W.; Manning, A. J.; Ray, E.; Rigby, M.; Hall, B. D.; et al. A Decline in Global CFC-11 Emissions during 2018 − 2019. Nature 2021, 590, 428–432. DOI: 10.1038/s41586-021-03260-5.
- Manning, A. J.; Redington, A. L.; Say, D.; O'Doherty, S.; Young, D.; Simmonds, P. G.; Vollmer, M. K.; Mühle, J.; Arduini, J.; Spain, G.; et al. Evidence of a Recent Decline in UK Emissions of Hydrofluorocarbons Determined by the InTEM Inverse Model and Atmospheric Measurements. Atmos. Chem. Phys. 2021, 21, 12739–12755. DOI: 10.5194/acp-21-12739-2021.
- Say, D.; Manning, A. J.; Western, L. M.; Young, D.; Wisher, A.; Rigby, M.; Reimann, S.; Vollmer, M. K.; Maione, M.; Arduini, J.; et al. Global Trends and European Emissions of Tetrafluoromethane (CF4), Hexafluoroethane (C2F6) and Octafluoropropane (C3F8). Atmos. Chem. Phys. 2021, 21, 2149–2164. DOI: 10.5194/acp-21-2149-2021.
- An, M.; Western, L. M.; Say, D.; Chen, L.; Claxton, T.; Ganesan, A. L.; Hossaini, R.; Krummel, P. B.; Manning, A. J.; Mühle, J.; et al. Rapid Increase in Dichloromethane Emissions from China Inferred through Atmospheric Observations. Nat. Commun. 2021, 12, 7279. DOI: 10.1038/s41467-021-27592-y.
- Stanley, K. M.; Say, D.; Mühle, J.; Harth, C. M.; Krummel, P. B.; Young, D.; O'Doherty, S. J.; Salameh, P. K.; Simmonds, P. G.; Weiss, R. F.; et al. Increase in Global Emissions of HFC-23 despite near-Total Expected Reductions. Nat. Commun. 2020, 11, 397. DOI: 10.1038/s41467-019-13899-4.
- Andersen, M. P. S.; Kyte, M.; Andersen, S. T.; Nielsen, C. J.; Nielsen, O. J. Atmospheric Chemistry of (CF3)2CF–C≡N: A Replacement Compound for the Most Potent Industrial Greenhouse Gas, SF6. Environ. Sci. Technol. 2017, 51, 1321–1329. DOI: 10.1021/acs.est.6b03758.
- Zhao, M.; Han, D.; Zhou, Z.; Zhang, G. Experimental and Theoretical Analysis on Decomposition and by-Product Formation Process of (CF3)2CFCN Mixture. AIP Adv. 2019, 9, 105204. DOI: 10.1063/1.5116211.
- Trisna, B. A.; Park, S.; Park, I.; Lee, J.; Lim, J. S. Measurement Report: Radiative Efficiencies of (CF3)2CFCN, CF3OCFCF2, and CF3OCF2CF3. Atmos. Chem. Phys. 2023, 23, 4489–4500. DOI: 10.5194/acp-23-4489-2023.
- Devecioğlu, A. G.; Oruç, V. Characteristics of Some New Generation Refrigerants with Low GWP. Energy Proc. 2015, 75, 1452–1457. DOI: 10.1016/j.egypro.2015.01.258.
- Yoon, D.; Lee, J.; Lim, J. S. Detachable Trap Preconcentrator with a Gas Chromatograph–Mass Spectrometer for the Analysis of Trace Halogenated Greenhouse Gases. Anal. Chem. 2019, 91, 3342–3349. DOI: 10.1021/acs.analchem.8b04551.
- Simmonds, P. G.; Shoemake, G. R.; Lovelock, J. E.; Lord, H. C. Improvements in the Determination of Sulfur Hexafluoride for Use as a Meterological Tracer. Anal. Chem. 1972, 44, 860–863. DOI: 10.1021/ac60312a029.
- Elkins, J. W. Determination of Dissolved Nitrous Oxide in Aquatic Systems by Gas Chromatography Using Electron-Capture Detection and Multiple Phase Equilibration. Anal. Chem. 1980, 52, 263–267. DOI: 10.1021/ac50052a011.
- Elkins, J. W.; Fahey, D. W.; Gilligan, J. M.; Dutton, G. S.; Baring, T. J.; Volk, C. M.; Dunn, R. E.; Myers, R. C.; Montzka, S. A.; Wamsley, P. R.; et al. Airborne Gas Chromatograph for in Situ Measurements of Long-Lived Species in the Upper Troposphere and Lower Stratosphere. Geo. Res. Lett. 1996, 23, 347–350. DOI: 10.1029/96GL00244.
- Hall, B. D.; Dutton, G. S.; Elkins, J. W. The NOAA Nitrous Oxide Standard Scale for Atmospheric Observations. J. Geophys. Res. 2007, 112, D09305. DOI: 10.1029/2006JD007954.
- Lee, J.; Kim, G.; Lee, H.; Moon, D.; Lee, J.-B.; Lim, J. S. Comparative Study of Various Methods for Trace SF6 Measurement Using GC-µECD: Demonstration of Lab-Pressure-Based Drift Correction by Preconcentrator. J. Atmos. Ocean. Tech. 2020, 37, 901–910. DOI: 10.1175/JTECH-D-19-0044.1.
- Hall, B. D.; Dutton, G. S.; Mondeel, D. J.; Nance, J. D.; Rigby, M.; Butler, J. H.; Moore, F. L.; Hurst, D. F.; Elkins, J. W. Improving Measurements of SF6 for the Study of Atmospheric Transport and Emissions. Atmos. Meas. Tech. 2011, 4, 2441–2451. DOI: 10.5194/amt-4-2441-2011.
- Lim, J. S.; Moon, D. M.; Kim, J. S.; Yun, W. T.; Lee, J. High-Precision Analysis of SF6 at Ambient Level. Atmos. Meas. Tech. 2013, 6, 2293–2299. DOI: 10.5194/amt-6-2293-2013.
- Lim, J. S.; Lee, J.; Moon, D. M.; Kim, J. S.; Lee, J.; Hall, B. D. Gravimetric Standard Gas Mixtures for Global Monitoring of Atmospheric SF6. Anal. Chem. 2017, 89, 12068–12075. DOI: 10.1021/acs.analchem.7b02545.
- Simmonds, P. G.; O'Doherty, S.; Nickless, G.; Sturrock, G. A.; Swaby, R.; Knight, P.; Ricketts, J.; Woffendin, G.; Smith, R. Automated Gas Chromatograph/Mass Spectrometer for Routine Atmospheric Field Measurements of the CFC Replacement Compounds, the Hydrofluorocarbons and Hydrochlorofluorocarbons. Anal. Chem. 1995, 67, 717–723. DOI: 10.1021/ac00100a005.
- Prinn, R. G.; Weiss, R. F.; Fraser, P. J.; Simmonds, P. G.; Cunnold, D. M.; Alyea, F. N.; O'Doherty, S.; Salameh, P.; Miller, B. R.; Huang, J.; et al. A History of Chemically and Radiatively Important Gases in Air Deduced from ALE/GAGE/AGAGE. J. Geophys. Res. 2000, 105, 17751–17792. DOI: 10.1029/2000JD900141.
- O'Doherty, S. J.; Simmonds, P. G.; Nickless, G. Analysis of Replacement Chlorofluorocarbons Using Carboxen Microtraps for Isolation and Preconcentration in Gas Chromatography-Mass Spectrometry. J. Chromatogr 1993, 657, 123–129. DOI: 10.1016/0021-9673(93)83043-R.
- Miller, B. R.; Weiss, R. F.; Salameh, P. K.; Tanhua, T.; Greally, B. R.; Mühle, J.; Simmonds, P. G. Medusa: A Sample Preconcentration and GC/MS Detector System for in Situ Measurements of Atmospheric Trace Halocarbons, Hydrocarbons, and Sulfur Compounds. Anal. Chem. 2008, 80, 1536–1545. DOI: 10.1021/ac702084k.
- Obersteiner, F.; Bönisch, H.; Keber, T.; O'Doherty, S.; Engel, A. A Versatile, Refrigerant- and Cryogen-Free Cryofocusing–Thermodesorption Unit for Preconcentration of Traces Gases in Air. Atmos. Meas. Tech. 2016, 9, 5265–5279. DOI: 10.5194/amt-9-5265-2016.
- Arnold, T.; Mühle, J.; Salameh, P. K.; Harth, C. M.; Ivy, D. J.; Weiss, R. F. Automated Measurement of Nitrogen Trifluoride in Ambient Air. Anal. Chem. 2012, 84, 4798–4804. DOI: 10.1021/ac300373e.
- Vollmer, M. K.;Reimann, S.;Hill, M.;Brunner, D. First Observations of the Fourth Generation Synthetic Halocarbons HFC-1234yf, HFC-1234ze(E), and HCFC-1233zd(E) in the Atmosphere. Environ. Sci. Technol. 2015, 49, 2703–2708. 10.1021/es505123x.